
Abstract
This article presents an economical and efficient way to assess the structural safety and fatigue reliability of the bolster, a key structure for the metro-train. First, its finite element model was validated based on the comparison between numerical results and experimental data of stresses and displacements recorded during a static test. Then, the fatigue life of the bolster under loading scheme was predicted using Gerber diagram, in which the validated finite element model was applied to determine the weak points, and its structural safety was also evaluated by a full-scale fatigue test and non-destructive test method. Finally, the metro-train bolster was modeled as a series system of weak points, and a new fatigue reliability model for mechanical component derived based on stress-life interference model was used to assess its fatigue reliability under the application of the design passenger number spectra. The results show that not only does this bolster satisfy the structural safety requirement during its service life, but also its fatigue reliability is more than 99.993% after 30-year service under normal atmospheric conditions.
Keywords
Introduction
The metros, one kind of efficient and convenient transportations, have been constructed in many cities as economy continues to develop in China. More and more metro railway vehicles are produced to meet the rising market demands. Since the vehicles must be capable of protecting passengers from injury, their safety is of significant importance. The bolster, a significant component of the vehicle, is a welded structure seated on the bogies using air springs and is designed to sustain the weight of car-body and passengers and transmit the motive forces to car-body from bogies. During metro-train service, the bolster will experience cumulative damage by the alternating loads from passengers and bogie, so it is necessary to evaluate its fatigue life and reliability. However, the traditional method using a large amount of fatigue test data is expensive and time-consuming for such a large and complex mechanical component. Thus, because of the limitation in economics and time, it will be a meaningful work to assess the structural safety and fatigue reliability of the bolster based on a few tests.
In the last few decades, a great deal of innovation research has been carried out on the experimental validation of finite element (FE) model, and validation of all FE models was based on the comparison between numerical results and experimental data of displacements, strains, and accelerations recorded during the field test. 1 In the field of the bridge structure, such as a skewed two-span bridge and a highway bridge on US 90 in Florida, their FE models were established and validated through a series of field tests, and then the updated models were applied to set a baseline for post construction investigations and monitor the long-term structural health of the bridge system.2,3 In the field of construction structure,4,5 the FE model of the thin-walled cold-formed circular hollow sections (CHS) was updated by analyzing the results from the eight different CHS tests conducted by Elchalakani et al., 6 while the validation of the FE model of the steel–concrete–steel (SCS) sandwich beams was carried out based on the load–central deflection curves, ultimate strength, and failure modes of the specimens. In the field of material structure, the mechanical behavior of E-glass/epoxy tube predicted by its thick shell FE model was compared successfully with the experimental results from a series of biaxial static tests, 7 the numerical model of GFRP laminate, recommended in engineering calculations, was determined based on the standard 3-point bending test of a GFRP mixed laminate beam, 8 and an FE model of the sandwich construction for alpine skis was developed and validated to simulate the influence of changes of the ski construction on its bending and torsional stiffness. 9 In the field of biomedical engineering, the FE model of human clavicle, which can predict the structural response and bone fractures, was developed and validated based on the results of quasi-static and three-point bending tests conducted on a male clavicle, 10 while 10 human proximal femurs were tested until complete fracture under one-legged stance quasi-static load to validated the QCT/FE models of the human femur, which can predict hip fracture in more adequate physical terms based on continuum damage mechanics. 11 In the field of mechanical structure, the FE models of the corrugated core sandwich panels, the child seat, the four-point contact ball bearing, the aluminum egg-box, and the railroad passenger car were also validated in the similar way mentioned above, and these models were also used to do other further researches, like improving crashworthiness.12–16
According to the researches in these papers, it will be a more economical and efficient method to assess the structural safety and fatigue reliability using an FE model validated through a simple static test. Hence, a static test of the metro-train bolster was performed to validate its FE model first in this article, and then its structural safety was assessed using the Gerber diagram and a fatigue test. In addition, the fatigue reliability of the metro-train bolster was calculated using a new fatigue reliability model. The assessment method given in this article is also applicable to other large and complex mechanical components.
Metro-train bolster
A metro-train bolster specimen, with a length of 2.8 m, width of 1.755 m, and height of 0.25 m, from the car-body is shown in Figure 1. It is composed of a bolster, a metro-train floor, 2 side beams, and 14 lugs. The side beams and the floor were welded together, and the bolster, after being welded with the side beams directly, was then fixed on the floor by the lugs.

Metro-train bolster structures.
This specimen is made of EN AW-6005A aluminum alloy. 17 The side beams and floor are extruded profiles, and the lugs are aluminum alloy sheets, while the bolster is a welded box structure of profiles and sheets. In the box structure, two rectangle-shaped profiles placed in the Z direction were welded with four upper and three lower cover plates, eight vertical rib plates were welded between the two rectangle-shaped profiles in the Y direction, and four vertical plates were welded on the side of a rectangle-shaped profile near the side beams. The thickness of the rectangle-shaped profiles, lower cover plates, and vertical plates is 10 mm, while the upper cover plates of 18 mm, the vertical rib plates of 15 mm, and the lug plates of 13 mm.
According to the international standards,17–20 the forces acting on the bolster during the metro-train service typically fall into two categories: (1) center pin force (Fef) by the combination of the lateral vibration of the car-body and the driving force from bogie and (2) air spring force (Fas) by the weight of car-body and passengers. Table 1 lists the forces in detail, and their action positions on the specimen are shown in Figure 1. The center pin force is applied on a specially manufactured jig installed at the center pin position, its direction is 56.257° to the X direction, and its height is 516 mm off the bolster surface. Meanwhile, the air spring forces are applied on the air spring position of the bolster directly in the Y direction.
Loading scheme.

FE model validation
In this section, a static test was performed to obtain the mechanical behavior of the structure, like the stresses and displacements, to validate the FE model of the metro-train bolster. Meanwhile, the same static FE simulation studies were completed, and the results were compared with the experimental measurements.
Static test
The maximum loads case listed in Table 1 was adopted for static load condition, and the experimental setup for the static test of the specimen was set up as shown in Figure 2. Since the side beam is originally a whole part in the car-body, all degrees of freedoms are fixed for the four corners of the side beams to avoid the bolster specimen motion, and this specimen was fixed by the fixing jig placed on the support beams. The test load is generated by the hydraulic actuator and is controlled by a closed-loop system, which is composed of a fatigue test control system and a force sensor. Three hydraulic actuators were used for the test. For the two air spring forces (Fas), two actuators of 25-ton capacity were installed on the bolster using the jigs. The center pin force (Fef) was generated by an actuator of 10-ton capacity and a set of special jigs.
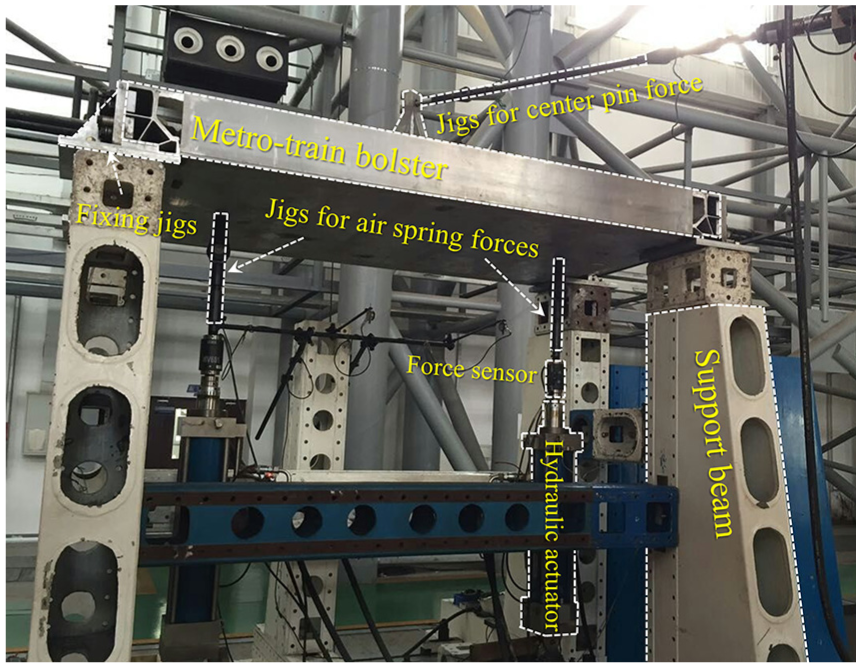
Experimental setup of the metro-train bolster.
A total of 18 strain gauges were bonded on the bolster specimen surface to capture the stresses during the static test, and their positions are shown in Figure 3. Meanwhile, three displacement meters were placed at the bottom of the bolster specimen as shown in Figure 4 to detect the displacements.
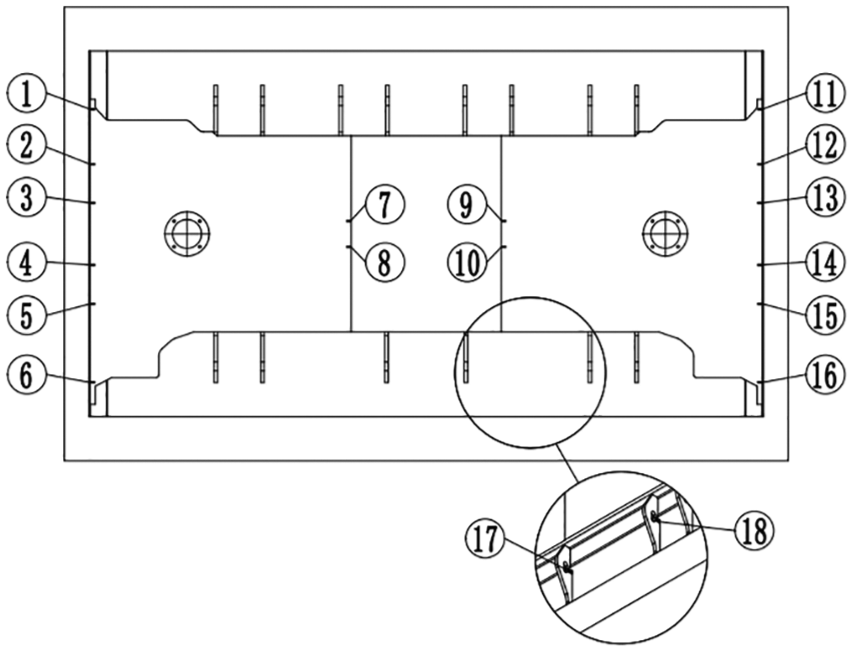
Strain gauge positions on the bolster specimen.

Displacement meter sites under the bolster specimen.
The static test of this bolster specimen was carried out under normal atmospheric conditions, and the static loads were set as the maximum values in Table 1. After the test, the stresses and displacements of the specimen under the static load condition were obtained.
Finite element method analysis
Based on the design drawings of the bolster specimen, its three-dimensional model was established using SolidWorks, and then the finite element method (FEM) analysis was performed using ANSYS Workbench. After analyzing the data obtained from strain gauges and displacement meters, the bolster model was determined to be meshed with Solid 186 elements, and there are totally 1,671,165 nodes and 890,337 elements with a mesh size of 10 mm. Meanwhile, the material was aluminum alloy with the elastic modulus of 69 GPa, Poisson’s ratio of 0.3, and density of 2700 kg/m3.
As illustrated in Figure 5, the load and boundary conditions of the FEM analysis are all the same with the static test. The center pin force is applied on a specially designed jig model, its direction is 56.257° to the X direction, and its height is 516 mm off the bolster surface. Meanwhile, the air spring forces are applied to the circular areas with a diameter of 680 mm, and the boundary condition is established by fixing the four corners of the side beams.

FEM simulation model.
Using the static structural module of the ANSYS Workbench, the mechanical behavior of the bolster specimen under the static load condition was studied, and the simulation results about the stresses and displacements at the positions shown in Figures 3 and 4 were also obtained.
Results and discussion
Validation of the FE model was done by comparing simulation results with data obtained from strain gauges and displacement meters. The Von-Mises stresses at the strain gauge positions in Figure 3, which were got from the static test and FEM calculation, are listed in Table 2. These stresses are relatively small, and nearly half of them are less than 5 MPa while 89% are less than 10 MPa, which may lead to the greater relative error due to the test errors. Thus, the further comparison of the measurements with FE stress results obtained at the strain gauge positions is shown in Figure 6 where the static test measurement results are depicted as red squares, while the FEM calculation results as black dots.
The Von-Mises stress at the strain gauge position (MPa).

FEM: finite element method.

Changing trends of the stresses.
From Figure 6, these stresses are not exactly the same, but the calculated stresses show a similar trend with the measured one, while the stress errors of No.1, 2, 3, 14, 16, 17 and 18 are relatively large but acceptable. Therefore, the results from FE model are observed to be in good agreement with experimental strain gauge measurement especially at No. 6, whose stress is the maximum.
The relative differences are used to analyze the displacements of the bolster specimen got from the static test and FEM simulation, and the results are shown in Table 3

where the superscripts E and S are used for the displacements from the static test and FEM simulation, respectively, and k is the displacement meter position number.
Displacement analysis.

As illustrated in Table 3, the measurement results of displacement are found to be a little higher than the FEM simulation, which indicated that the FE model is a little stiffer than the actual bolster specimen, and the relative displacement gaps are lower than 10%, which satisfies the engineering requirements. Overall, the FEM simulation results also agree well and show a similar trend with the measurement results.
Since Figure 6 and Table 3 confirm that the current FE model can predict well the mechanical behavior of the bolster specimen under the static load condition, this FE model is fairly consistent with its actual structure and can be used to predict the stress states of the stress concentration area, the site of potential fatigue initiation, that cannot be measured directly by strain gauges.
Structural safety assessment
The metro-train bolster should be designed for fatigue such that there is an acceptable level of probability that its performance will be satisfactory throughout its design life, so the structural safety for this metro-train bolster was assessed by analytical studies, fatigue, and non-destructive tests. As no crack is allowed during the bolster service, the fatigue life of the bolster is thus the crack initiation life, and the fatigue test and fatigue life assessment21,22 in this article are all only focus on the crack initiation. However, to extend the bolster service life and reduce the cost, the crack propagation life, 23 fatigue crack growth rate, 24 the critical crack size, and the final fracture failure mechanism are worth to be studied in the future.
In this section, the stress concentration areas were determined through the FEM analysis, and the fatigue life of the bolster was evaluated by Gerber diagram. The loading scheme in Table 1 was used for this FEM analysis and full-scale fatigue test because it was designed to verify the absence of any risk of fatigue crack occurring under the combine effect of the main forces encountered during the bolster service.
As the fatigue failure of the metro-train bolster will occur when only any one of the stress concentration sites, namely weak points, fails, the bolster could be modeled as a series system of the weak points, which means that the shortest life among theirs will be the bolster’s life. From the FEM simulation results of the metro-train bolster under the fatigue loads, the stress concentration areas are located around the welding area between the side beams and the bolster, which are inside the bolster specimen and inconvenient to bond the strain gauges, and then 28 weak points were selected to assess the fatigue life of the bolster by analytical studies. Figure 7 shows the fatigue life prediction results, in which the stress states of the weak points calculated using the FE model are depicted with the red triangle. The red dash line is the Gerber curve of welding with the life of 1 × 10⁸ load cycles at a 95% confidence level of 99% probability of survival, the black solid line with the life of 1 × 10⁷ load cycles, and the blue dotted line with the life of 5 × 10⁶ load cycles. The strength limit of the welding is 193.25 MPa. 25 As illustrated in Figure 7, the shortest life of the weak points is more than 1 × 10⁷ load cycles.

Gerber diagram for the metro-train bolster.
The fatigue test enables the overall bolster service life to be ascertained, the safety margin to be evaluated, and possible weak points not identified by the static test to be detected. This full-scale fatigue test was performed on the experimental setup shown in Figure 2 and under normal atmospheric conditions. Its boundary condition is the same as the static test, and the dynamic variations of the forces listed in Table 1 are at the same frequency, namely 3 Hz. During the fatigue test, the strain gauges bonded on bolster surface can not only measure the stresses but also monitor the bolster state, and the test would not stop until the loads frequency or the stress monitoring results changed dramatically. This metro-train bolster is designed to serve for 30 years without any fatigue crack appearance, namely the bolster has the infinite life under the design loads cases. Therefore, its fatigue test was carried out up to 1 × 10⁷ load cycles, corresponding to the 30-year design life. After the fatigue test, fatigue crack detection test using the liquid penetrant test (PT) was conducted, and the non-destructive test results are shown in Figure 8, in which no visible fatigue cracks were found.

PT detection results after the fatigue test.
In summary, all of the stresses at the weak points are under the black solid line in Figure 7 so that the fatigue life of this bolster is more than 1 × 10⁷ load cycles at a 95% confidence level of 99% probability of survival, and the bolster shows no visible fatigue crack after the fatigue test, indicating its life is more than 1 × 10⁷ load cycles in the test environment. Therefore, it is concluded that this metro-train bolster satisfies the structural safety requirement and its service life is more than 30 years.
Fatigue reliability assessment
This type of metro-train bolster will be put in service in many different cities all over the country, where the load conditions are random and varied and are totally different from the loading scheme listed in Table 1, so it is crucial to know the actual fatigue reliability of the bolster for extending service life and reducing production cost, although it has satisfied the structural safety requirement. In this section, the fatigue reliability of the metro-train bolster is evaluated using a new fatigue reliability model.
Fatigue reliability model
Based on the explanation of the traditional stress–strength interference (SSI) model in the view of the statistical theory, Xie and Wang 26 developed a stress-life interference (SLI) model. Compared with the SSI model, this model (see equation (2)) is simpler and more practical because it can use the life distribution, which is easy to be obtained from fatigue tests directly, to calculate the fatigue reliability. However, the SLI model is only valid for dealing with the reliability problem of one weak point

where the s is called identification stress and represents a deterministic stress process, f(s) is the probability density function of identification stress, and g(n|s) is the life probability density function when a deterministic stress process is applied.
Since the mechanical component can be modeled as a series system of the m weak points, its fatigue reliability can be assessed using the series system reliability methods. 27 Based on the SLI model, the reliability of the component can be expressed as follows
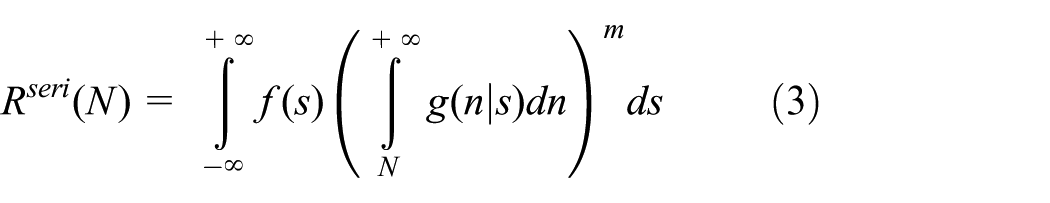
When the same stress process acts on the m weak points, their life distributions will be different due to the uncertainty of the material performance. Suppose that their probability density functions could be described as g1(n|s), g2(n|s) …gm(n|s), the reliability of the component can be written as follows

Moreover, when the random load is applied to the mechanical component, its stress distribution will be uneven since the structural complexity, which may lead to the difference of the identification stress distributions at the weak points. Hence, suppose that the identification stress distribution at the ith weak point follows the normal distribution, the reliability of the component can be calculated as follows

where s0 is a standard normal random variable, namely s0 ∼ N(0,1), μ i is the mean value, and σi is the standard deviation.
As this metro-train bolster is a complex mechanical structure and has been modeled as a series system of 28 weak points in section “Structural safety assessment,” its fatigue reliability under the random load conditions can be evaluated using equation (5). Since the bolster has not served in the rail line and the loads history is not available, so the load spectra for this fatigue reliability assessment are designed.
Load spectra
According to the JIS E 7106:2006, 18 the air spring force and the center pin force are both the function of the whole vehicle weight composed of the weight of car-body and passengers. This metro-train car-body weighing about 20.5 ton is designed to carry up to 226 passengers. Assuming that each passenger weighs 60 kg, the total weight of passengers will be ranged from 0 to 13.56 ton during the metro-train service, which accounts for 40% of the whole vehicle weight. Therefore, the passengers can be treated as the main factor affecting the fatigue loads of the metro-train bolster.
The Poisson stochastic process, as a counting process, can be applied to describe the relationship between the number of load applications and time. 28 Similarly, the number of the metro passenger also can be described as a Poisson stochastic process, as shown in Figure 9. Taking the Shenyang Metro Line 1 for an example, there are 22 stations on the metro line, and the metro-train will stop 396 times a day. Thus, the passenger number will change 396 times every day. Here, based on the situation in Shenyang, 10 passenger number spectra were generated by Poisson stochastic processes, in which the parameters representing the passenger density of different cities were randomly generated, and the passenger number distribution in each city is shown in Figure 10. The fatigue loads were assumed to change in proportion to the passenger number in this fatigue reliability assessment.

Passenger number at each station of Shenyang Metro Line 1 at a particular moment.
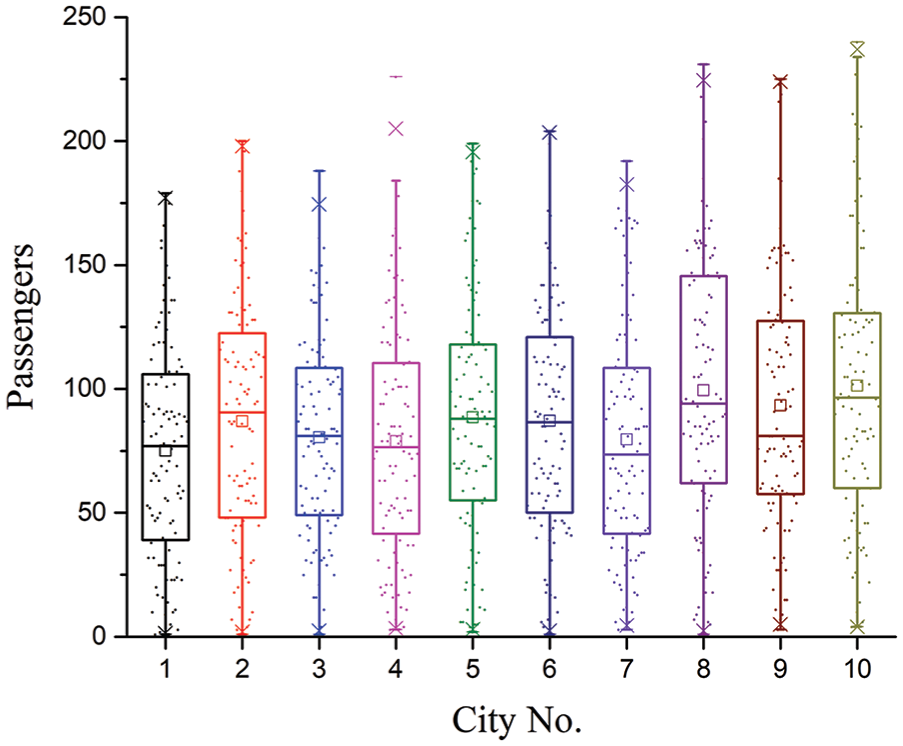
Passenger number distribution in each city.
After determining the load spectra, the parameters in the new fatigue reliability model can be calculated, like life distribution parameters of weak points and identification stress distribution parameters.
Parameter calculation
To assess the fatigue reliability of the bolster using the new reliability model, the parameters in equation (5) were calculated following the procedures, as shown in Figure 11.
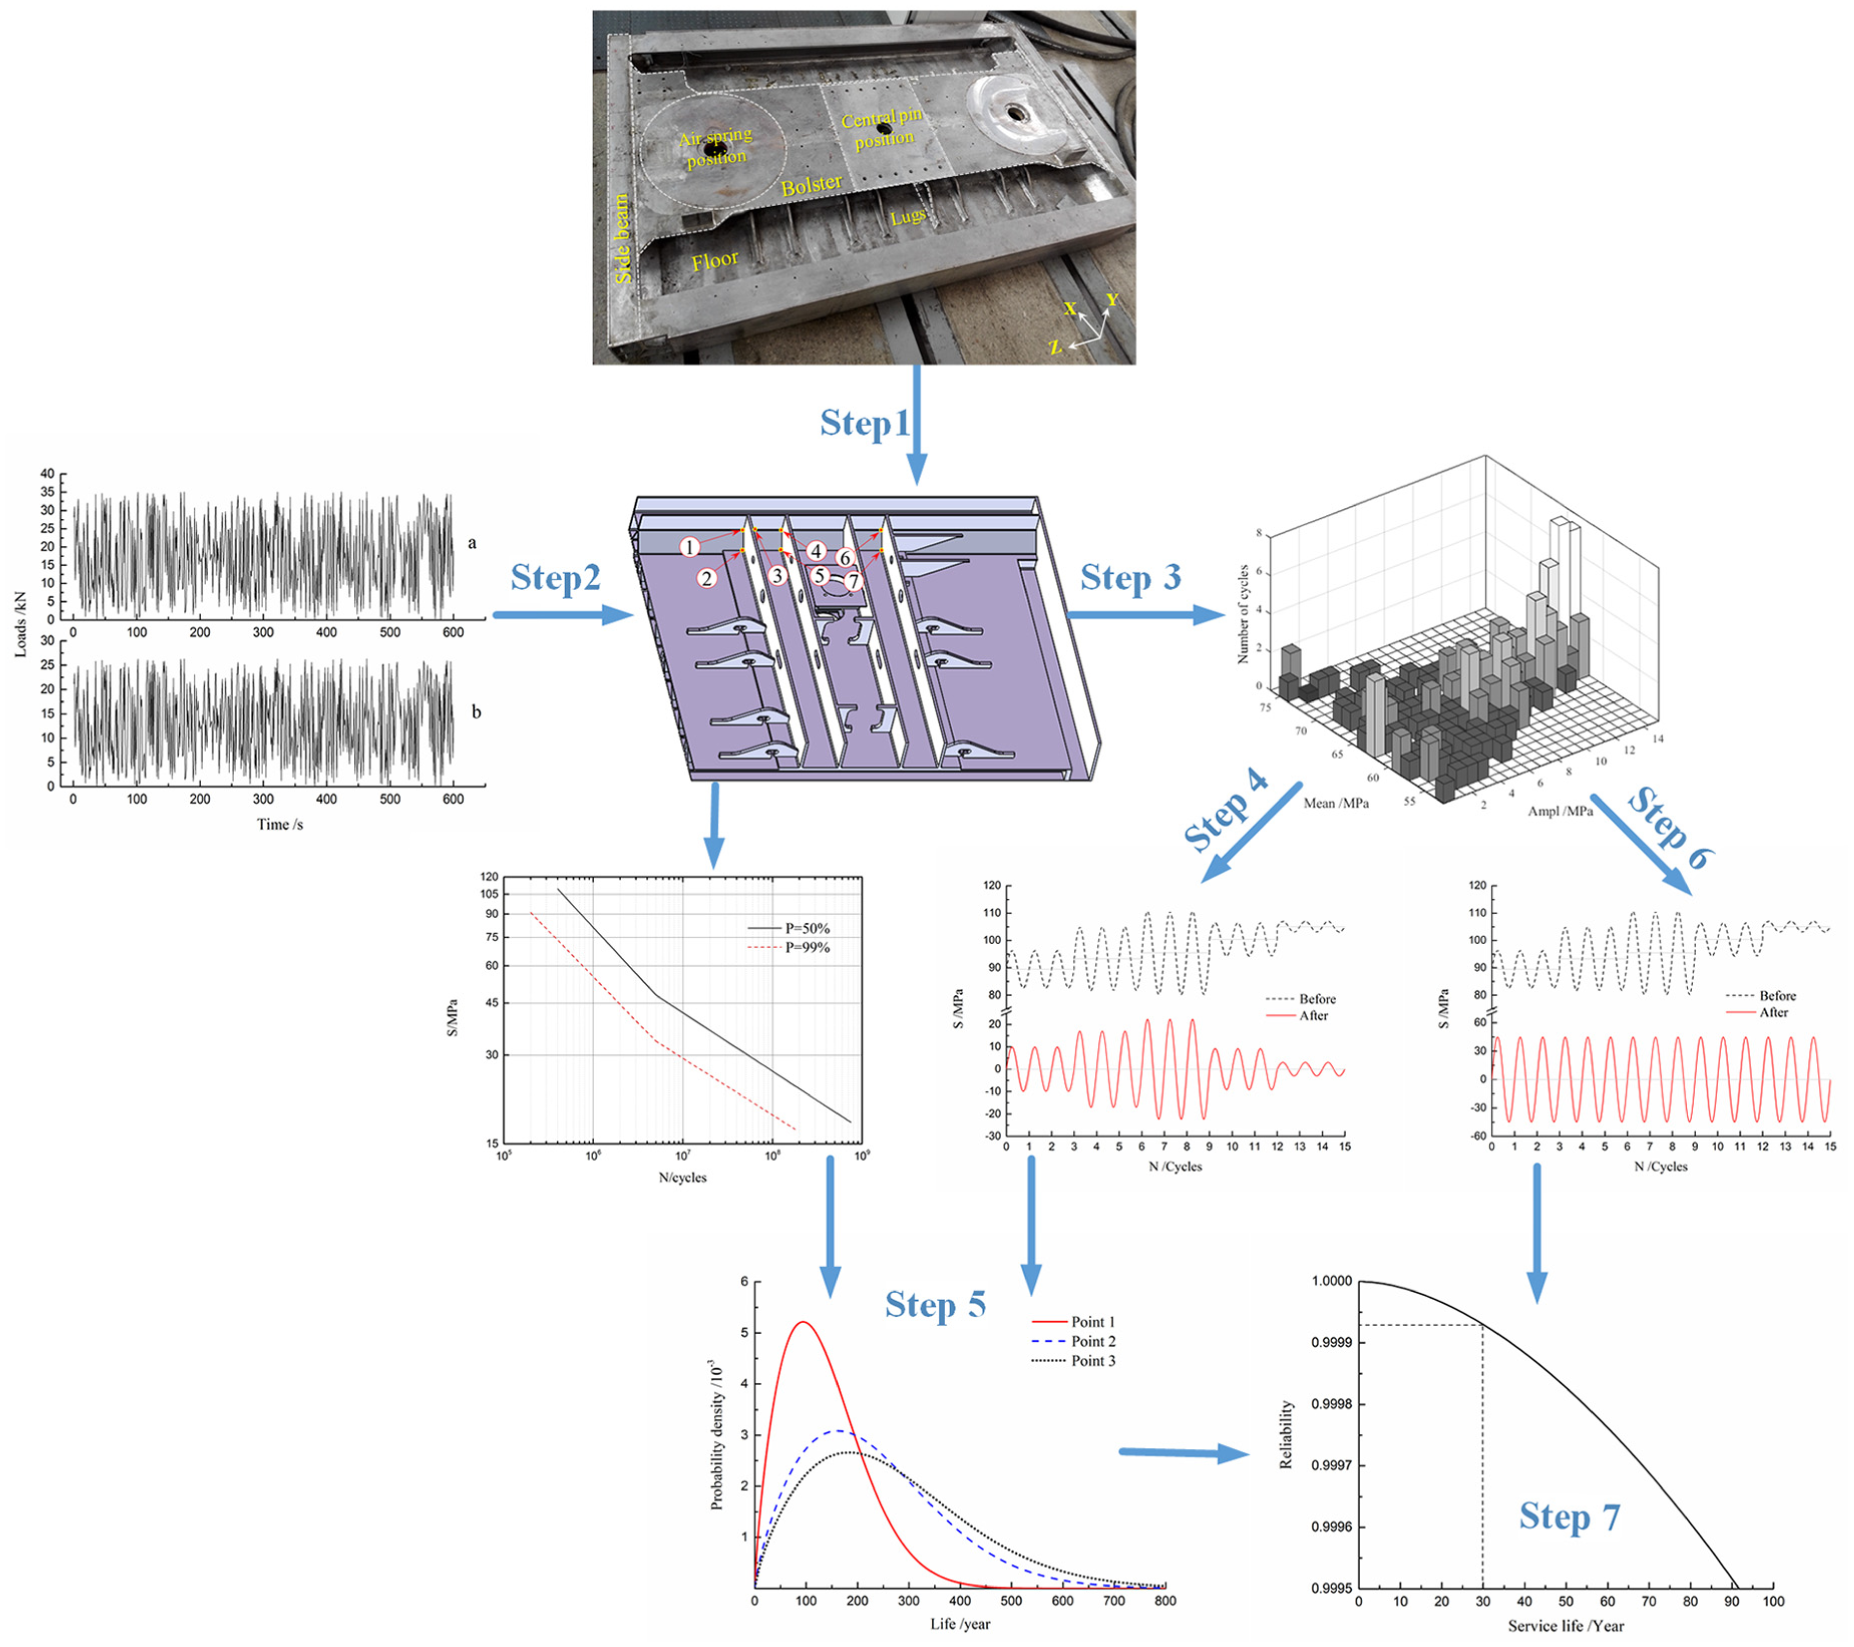
Fatigue reliability calculation procedures.
The details of the procedures are as follows:
Step 1. From structural safety assessment results in section “Structural safety assessment,” seven weak points in Figure 7, whose prediction lives are less than 1 × 10⁸ load cycles, namely above the cut-off limit, 25 are taken for this reliability assessment.
Step 2. Based on the design load spectra in section “Load spectra,” the corresponding stress histories at the weak points are calculated using the FE model validated by the static test.
Step 3. The stress histories are evaluated by the rain-flow counting method 29 to determine the mean stresses, stress ranges, and their numbers of cycles.
Step 4. Transform the asymmetrical stress cycles in Step 3 into the symmetrical stress cycles using the Gerber equation, 21 in which the strength limit of welding is 193.25 MPa. 25
Step 5. The p-S-N curves of the welding under normal atmospheric conditions are from the study of He, 25 and the life distributions of weak points are calculated using Palmgren–Miner linear cumulative damage rule 30 and the Monte Carlo method.
Step 6. Transform the variable amplitude stress processes at the weak point into the equivalent constant amplitude stress cycles causing the same fatigue damage effects. The equivalent stress amplitude value is the identification stress, and then the identification stress distribution will be determined.
Step 7. According to the fatigue reliability formula (see equation (5)), the fatigue reliability of the bolster is calculated using the life distributions and identification stress distributions.
Life distributions of weak points
The life distributions of the seven weak points were determined after Step 5 in Figure 11, and their life data from the Monte Carlo simulation follow the Weibull distribution. 31 The shape parameter β is mainly dependent on the material, structure, and failure mechanism and is independent of the stress. 21 Meanwhile, the scale parameter η is the function of the stress, and their relationship can be expressed as follows

where a and b are the undetermined coefficients, and s is the identification stress representing a deterministic stress process.
Table 4 lists the fitting results of the parameters of the life distribution. The a and b in equation (6) are determined by the least square method, and the value of the shape parameter β, which is less sensitive to the stress, is simply the arithmetic mean.
Parameters of the life distribution.

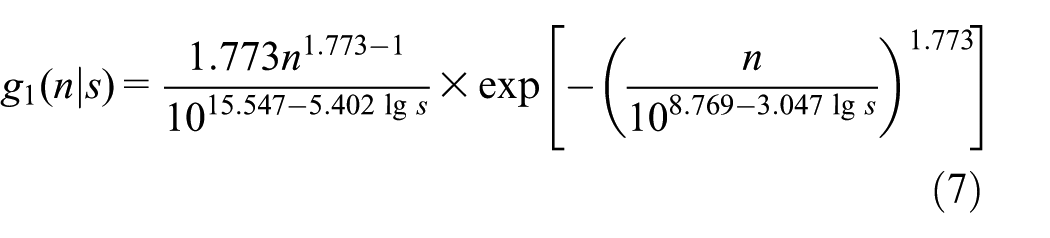
Taking the weak point 1 as an example, its fatigue life probability density function with the identification stress s can be expressed as follows
Identification stress distributions
The fatigue damage effects under the variable amplitude or equivalent constant amplitude stress cycles were calculated using the Palmgren–Miner linear cumulative damage rule, 28 and the identification stress distributions at the seven weak points under the design fatigue load conditions were determined at Step 6 in Figure 11. The results indicate that the equivalent stress amplitude values follow the normal distribution, and Table 5 lists their distribution parameters, in which μ is the mean value and σ is the standard deviation.
Parameters of the identification stress distribution.

Taking the weak point 1 as an example, its fatigue life probability density function under the design fatigue load conditions can be expressed as follows

Results and discussion
Based on equation (5), the fatigue reliability formula of the bolster with seven weak points can be described as follows

Following Step 7 in Figure 11, the fatigue reliability of this metro-train bolster under the application of the design load spectra in section “Load spectra” was assessed, and Figure 12 illustrates the relationship between reliability and service life.

Fatigue reliability curve of the metro-train bolster.
From Figure 12, the fatigue reliability of this metro-train bolster is more than 99.993% after 30-year service under normal atmospheric conditions. Since the cumulative failure probability of this metro-train bolster is less than 0.007% within the 30 years, its service life under the design fatigue load conditions can be extended, and this bolster will still satisfy the service requirement even though reducing some unnecessary production cost. However, to get more accurate results, more studies on the p–S–N curves of the material in all kinds of environments and the actual load spectra of various metro lines need to be taken.
Conclusion
In this study, the structural safety and fatigue reliability of a metro-train bolster have been assessed using an economical and efficient way, namely the numerical calculation method based on the validated FE model. At first, the static test of the bolster specimen was performed on an experimental setup under the static load condition, and the FE model was validated through comparing the stresses and deformations obtained during the test with FEM simulation results. Then, in the condition of the loading scheme derived from the international standards, the fatigue life of the bolster under normal atmospheric conditions was evaluated by the Gerber diagram, in which the weak points were determined using the validated FE model, and a full-scale fatigue test. As its prediction life is more than 1 × 10⁷ load cycles and no fatigue crack is observed after the fatigue test, this bolster satisfies the structural safety requirement.
Furthermore, a fatigue reliability model for mechanical components based on stress-life interference model was developed to assess the fatigue reliability of the metro-train bolster under the random load conditions, which were generated by Poisson stochastic processes. This metro-train bolster was modeled as a series system of seven weak points, and its cumulative failure probability is less than 0.007% within 30-year service under normal atmospheric conditions, which indicates that there is a great potential for extending the service life and reducing the production cost.
In practice, it is an expensive and time-consuming way to assess the structural safety and fatigue reliability of the large and complex mechanical component, such as this metro-train bolster, using the fatigue test data. The method applied in this article only takes a simple static test to validate the FE model, based on which the structural safety and fatigue reliability are then assessed by the numerical calculation, so it is convenient to use and helpful for other research.
Footnotes
Handling Editor: Vesna Spasojević Brkić
Declaration of conflicting interests
The author(s) declared no potential conflicts of interest with respect to the research, authorship, and/or publication of this article.
Funding
The author(s) disclosed receipt of the following financial support for the research, authorship, and/or publication of this article: This work is supported by the Natural Science Foundation of China (grant no. U1708255) and the Collaborative Innovation Center of Major Machine Manufacturing in Liaoning, China.