
Abstract
The fatigue problem of orthotropic steel bridge decks of urban rail transit steel bridges has gradually become one of the hot research topics. And it is also a key problem that restricts the further development of rail transit steel bridges. In this paper, the orthotropic steel bridge deck structure of a long-span urban rail transit cable-stayed bridge is studied. Based on the segmental finite element model and full-scale model, the fatigue details of the joint weld between an orthotropic steel bridge deck and U-rib were studied theoretically and experimentally. The theoretical model of the segment is analyzed to obtain the hot spot stress characteristics. On this basis, the full-scale model fatigue test and the fatigue performance evaluation are completed based on the S-N curve. The results show that the fatigue performance of the bridge deck and U-rib joints of the orthotropic steel bridge deck structure model meets the design requirements and has a certain safety reserve. The joint fatigue details of the bridge deck, the U-rib joint weld, and the diaphragm plate are the sensitive areas that are most likely to occur fatigue failure first and need to be paid attention to in the later bridge maintenance and inspection.
Urbanization is the mainstream development trend in the world today. Urban rail transit is undoubtedly a very competitive transportation mode. Rail transit can transport many passengers with low travel time, less energy consumption, and light environmental impacts.1,2 With the unstoppable development trend of rail transit on a global scale, reasonable route planning is bound to have an extremely far-reaching impact on the development and management of future cities. It can be seen that the performance of the rail transit steel bridge, which is the key control node of the route, is closely related to the sustainable development of urban rail transit.
Urban rail transits are the backbone of urban public transportation systems in many cities around the world. Its inherent characteristics, such as exclusive way, high capacity, automated guidance, and electric propulsion, allow it to carry a large number of commuters with speed, convenience, and safety. 3 It is not only different from highway traffic, but also railway traffic. The fatigue load models of highway and railway steel bridges have been studied extensively throughout the world and many research results have also been obtained.4–15 In terms of railway steel bridges. An innovative steel-concrete joint was applied to long-span railway hybrid box girder cable-stayed bridges to achieve favorable force transfer and deformation performance train. 16 In terms of highway steel bridges, the literature evaluated the fatigue performance of rib-to-deck welded joints in orthotropic steel decks with thickened edge U-ribs.17,18 Moreover, the fatigue performance of rib-to-floorbeam welded connection in orthotropic steel decks reinforced by using ultra-high-performance concrete (UHPC) overlay is also studied. 19
Compared with rail transportation, highway transportation has diversified vehicle types,20–27 but the load effects are relatively small. Railway transportation and urban rail transits have certain similarities, that is the load type is single with strong regularity, but the load effect is larger. At the same time, there are relatively few studies on the fatigue performance of orthotropic steel decks of bridges in urban rail transit. The full-scale fatigue test data that can be used as a reference for engineering design, are relatively limited.
The fatigue performance test of the large full-length orthotropic steel bridge deck structure model is performed, to provide the technical basis for the rational design of the orthotropic steel bridge deck of the urban rail transit bridge.
Theoretical analysis of fatigue test model
Fatigue load of urban rail transit bridge
The fatigue load model based on the highway or railway traffic can not be directly used in rail transit, so it can be considered that the amount of change is only the passenger flow and the number of train marshals, which is reflected in the size and number of axle load changes. The number of axle loads can be determined through specific traffic management planning, and the number of train formations is adopted in different periods. Therefore, the choice of the distribution and size of the axle loads of the fatigue load model is very critical.
For the determination of axle loads, if the prediction calculation of the actual traffic volume is time-consuming and has regional limitations, the direct use of the designed axle loads is not conducive to the development of material performance, resulting in a waste of resources. It is not easy to calculate the length of the influence line of the component and the probability of the most unfavorable situation when reducing according to the highway industry norms. Therefore, the fatigue load reduction factor multiplied by the designed train axle load is selected as the value of the axle loads of the fatigue load model of the urban rail transit bridge. The fatigue load reduction factor is finally determined to be 0.8,3,24,25 in accordance with the linear fatigue cumulative damage theory and the corresponding train design axle load.
Because of the characteristics of urban rail transit vehicles running on fixed guide rails, which are different from common road traffic, the calculation of the load range is also different. The loads caused by the axle loads of the train can be distributed on three adjacent rails along the rail, and the distribution width of the vertical line direction can be calculated. Therefore, the fatigue load range is distributed along the rail: L = 0.925 + 0.275 = 1.2 m, along the vertical line: B = 2.3 + 0.275 + 0.275 = 2.85 m. The specific uniaxial fatigue load range is shown in Figure 1.

The fatigue load range of the single load/mm.
Establishment of theoretical model
A long-span urban rail transit cable-stayed bridge is taken as the research object. The mid-span girder of the cable-stayed bridge adopts a streamlined flat steel box girder, and the deck structure is an orthotropic steel deck. The cross-sectional layout of the bridge, the size of the diaphragm plate structure, and the standard design diagram of an A-type rail transit car are shown in Figures 2 to 4.
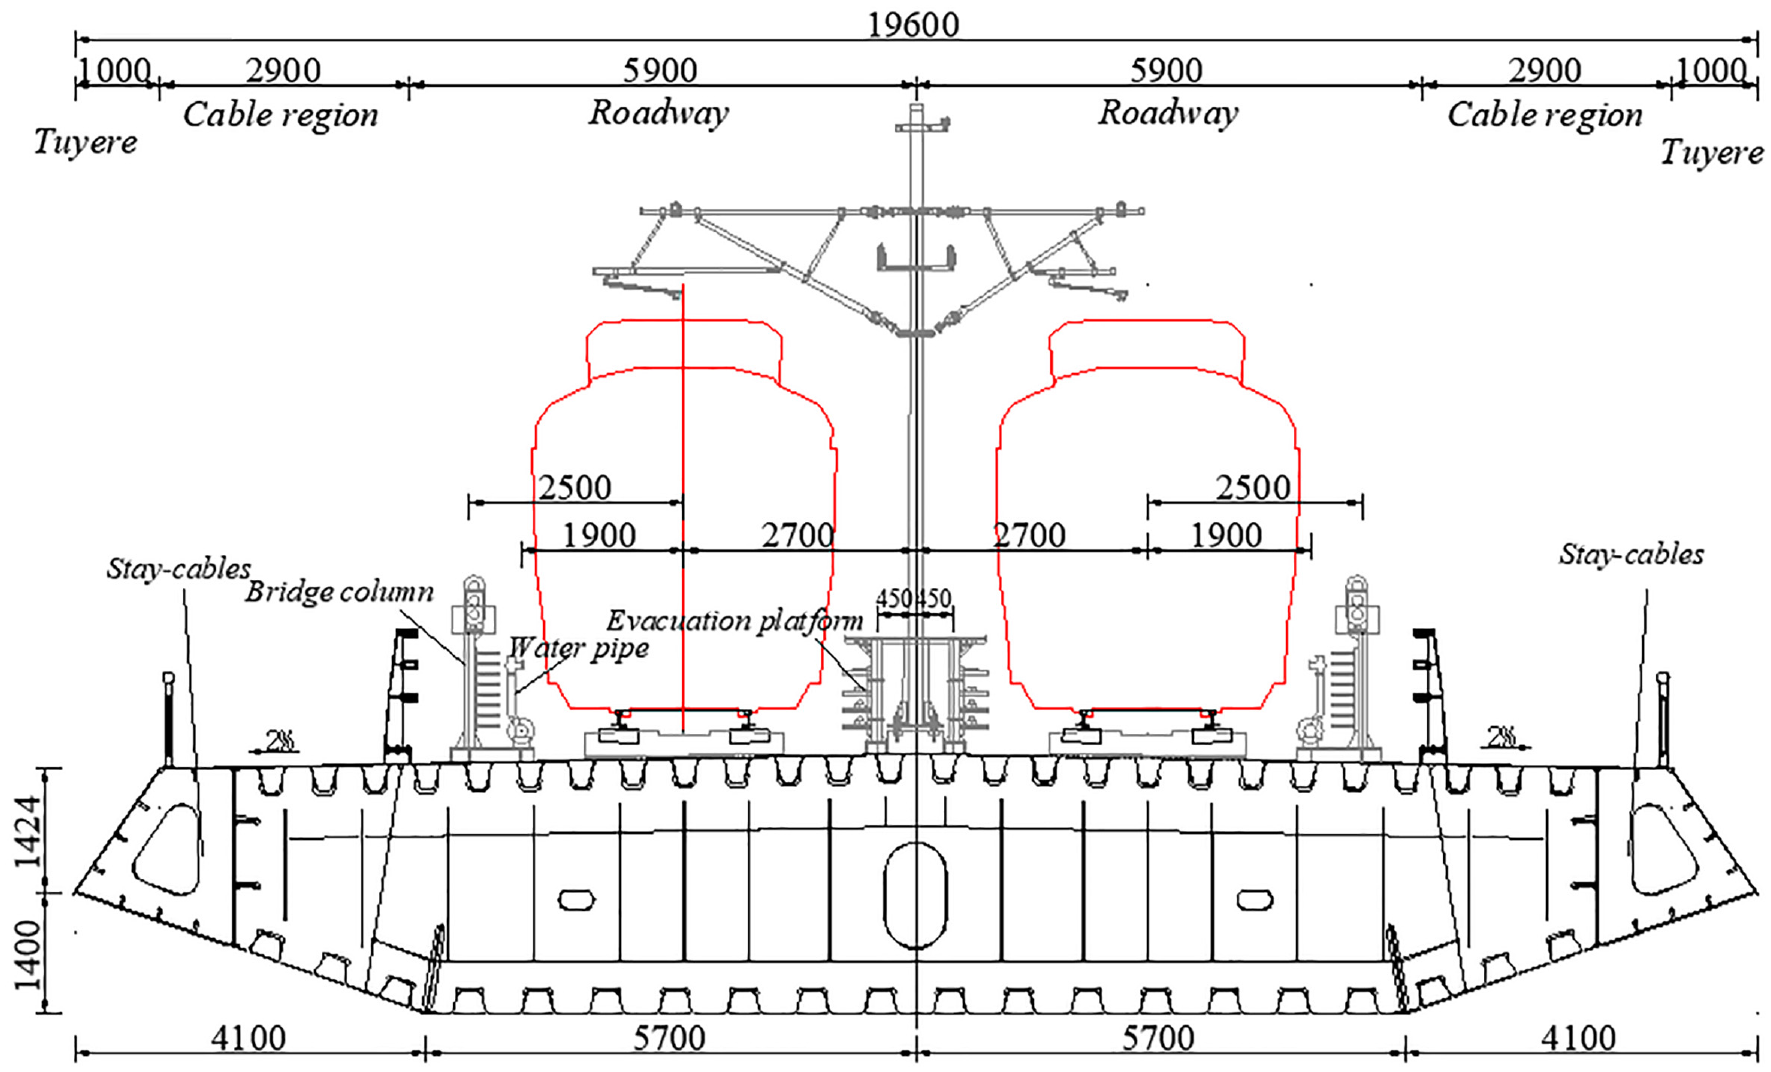
The sectional layout of a long-span urban rail transit cable-stayed bridge/mm.

Size of diaphragm plate structure (unit: mm).

The standard layout of A-type rail transit trail/m.
A finite element model of the orthotropic steel deck (OSD) of the steel box girder of the special cable-stayed bridge for urban rail transit is established. The height of the diaphragm plate of the theoretical research model is 800 mm. The middle section of the longitudinal span of the deck structure is intercepted for 14 m, including five diaphragm plates. The distance between diaphragm plates is 3 m. There are five diaphragm plates in total, with a spacing of 3 m in pairs. A total of 10 U-ribs, two adjacent U-ribs’ center line spacing is 0.6 m. Both ends of all diaphragm plates in the finite element model are all constrained, and the center line of the external load range is consistent with the center line of the roadway. Uniaxial load is applied along the center line of the roadway. The time required for each load movement of 0.25 m is taken as a one-time step. The loading process took 49-time steps. The steel elastic modulus of the model is E = 2.06 × 10¹¹ Pa, Poisson’s ratio μ = 0.3, and the density is 7.85 g/cm3. The finite element model has 509,265 elements in total, and the mesh division of the grid encryption region is analyzed by the hot spot stress method. The mesh size of the research area (The area of mesh encryption) is 0.5 t (t is the thickness of the component). The area of grid encryption is 0.6 m around the middle diaphragm, and the width is 6 m. The finite element model the segmental model is shown in Figure 5.

The finite element model of OSD of the urban rail transit bridge.
Theoretical model analysis
TDP1 (the first diaphragm plate) as the starting point and TDP5 (the fifth diaphragm plate) as the end point, the fatigue load will move along the centerline of the carriageway in the direction of the rail within this range, as shown in Figure 6.

Schematic diagram of fatigue load moving along the line.
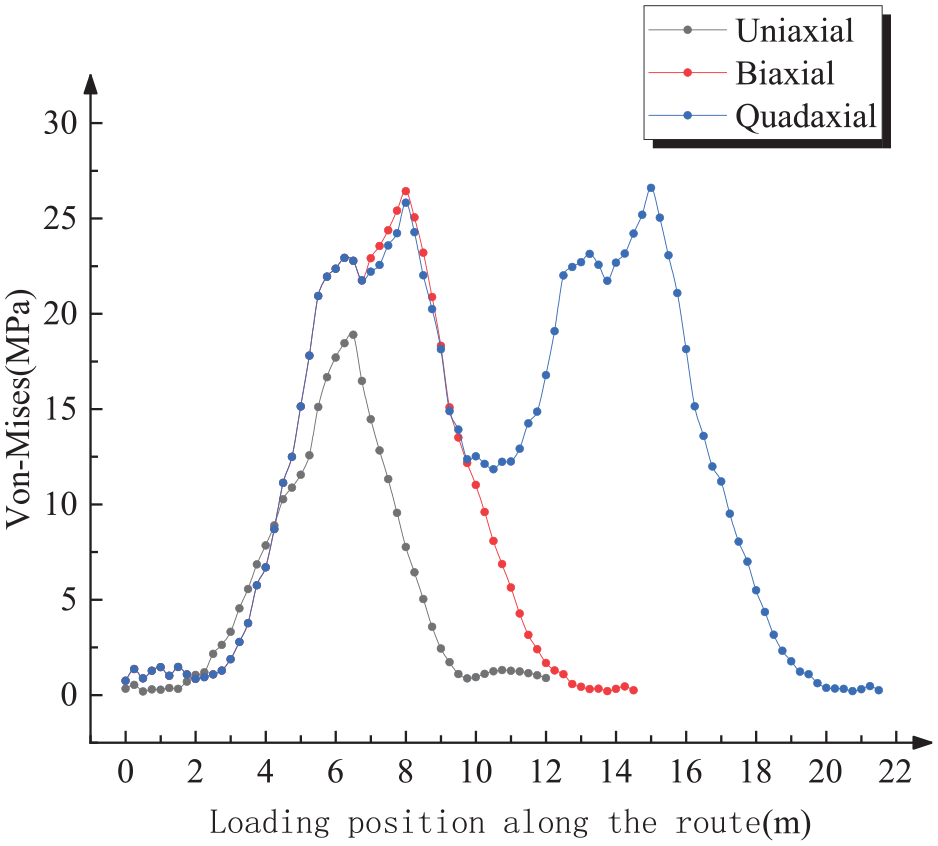
The method of moving loading and hot spot stress analysis is adopted. During the movement of single-line uniaxial, biaxial, and four-axis fatigue loads, the stress history relationship curves of each key fatigue detail of the bridge deck and the U-rib joints at the middle diaphragm plate (TDP3) of the finite element model of this section were analyzed. It can provide the theoretical basis for fatigue loading of a large section of the bridge.
From the analysis of stress history curves in the above figures (Figures 7–9), it can be concluded that:
(1) Under uniaxial, biaxial, or four-axis fatigue loads, the stress changes of each key fatigue detail of the deck and the U-rib joints weld at the middle diaphragm plate have certain symmetry in the direction along the line.
(2) The stress history curve of each fatigue detail under uniaxial fatigue load can be concluded that the contribution of the fatigue load to its stress value outside the space range of two adjacent diaphragm plates on the left and right sides is less than 5%, and the effect is very small. So the stresses of the key fatigue detail can satisfy the characteristic of “adjacent load availability.”
(3) The stress history curve of each fatigue detail under the biaxial fatigue load constituted only one stress cycle, and the maximum stress value under the biaxial fatigue load was about 1.4 times that under the uniaxial fatigue load.
(4) The stress history curve of each fatigue detail under a four-axis fatigue load can have two stress cycles in total. The difference between the maximum stress and the biaxial fatigue load is only about 1%, which can be regarded as the “Repetition” of the stress history curve under the biaxial fatigue load two times.

Stress history curves of the key fatigue details of the diaphragm plate.

Stress history curves of key fatigue details of the deck.
Stress history curves of the key fatigue details of the U-rib web.
According to the stress history curves under the four-axis fatigue load and the Miner linear fatigue cumulative damage theory, the equivalent stress amplitude of each fatigue detail can be calculated according to the formula (1).

For the fatigue details on the diaphragm plate, Δσ1 = 33.9 MPa, Δσ2 = 17.5 MPa, Δσ0 = 29.7 MPa.
For fatigue details corresponding to the bottom of the bridge deck, Δσ1 = 20.3 MPa, Δσ2 = 10.1 MPa, Δσ0 = 17.8 MPa.
For fatigue details on the outside of the U-rib web, Δσ1 = 26.4 MPa, Δσ2 = 14.2 MPa, Δσ0 = 23.1 MPa.
According to the traffic volume, the total number of the train is up to 8,723,500, and the number of axles is about 235 million. However, due to the limitations of the existing experimental equipment, it is almost impossible to carry out such an order of magnitude of cyclic loading times. According to the conversion method of linear cumulative damage theory (as shown in Figure 10), formula (2) below is obtained. The equivalent stress amplitude of each fatigue detail of the deck and U-rib joint is converted into the equivalent stress amplitude of 2 million times of constant stress cycles, and then the equivalent fatigue load amplitude is obtained.


Schematic diagram of stress amplitude calculation.
In the above formula,
Therefore, the equivalent stress amplitude and fatigue equivalent load amplitude of each fatigue detail of the bridge deck and the U-rib joints weld during the 2 million cycles of constant amplitude stress cycles are summarized in Table 1 below.
Fatigue equivalent stress amplitude and load amplitude of each fatigue detail.

Fatigue test and result analysis
Design of fatigue test
Test model
The materials of the model test pieces are all Q345qD steel, and the welding materials are selected according to the results of the welding process test evaluation. The flux, welding wire, and manual welding rod used in the model meet the requirements of the corresponding standards. The length of the test model is 3000 mm, the width is 3000 mm, and the end is sealed with a steel plate with a height of 300 mm and a thickness of 12 mm. Two steel boxes of 3000 × 150 × 280 mm3 are made to be used as the longitudinal supports of the test model. 5 U ribs are arranged horizontally, the size of which is 300 × 280 × 8 mm3, and the U-rib center distance is 600 mm. There are three diaphragm plates arranged longitudinally, and the U ribs pass through the diaphragm plate continuously and uninterruptedly. The specific dimensions of the test model are shown in Figures 11 and 12.

Front view of the test model (unit: mm).

Side view of test model (unit: mm).
Test model installation and fatigue test plan
In the test model, the bottom bearing of the model is directly connected with four 450×300×35 mm3 steel plates by welding, and the steel plates and the ground anchors are prefixed connected by 42 mm diameter fine rolled rebars. The full-size model is placed on the steel box girder support and welded to the top of the steel box girder support within 150 mm of the left and right sealing plates at both ends. The fatigue load of the test model is vertically acted on the top of the model by a 50 t MTS actuator, under which a load-sharing beam is installed to realize biaxial loading, and a rubber pad of 300 × 300 mm2 is placed between the load-sharing beam and the top of the test model to simulate uniform load. The specific test model installation is shown in Figure 13.

Detail drawing of test model installation: (a) elevation of test model installation (b) installation floor plan of the test model, and (c) actual installation of the test model.
The loss of load transfer process and the difference between theoretical simulation and practical test are considered in combination with the requirements of the fatigue test site. The final fatigue equivalent load amplitude is 175 kN and the loading frequency is 4 Hz.
Static load test process
The static load test is carried out in a graded manner. That is, starting from zero, increasing step by step according to a certain load increment until the fatigue loading value, until to the maximum value of 185 kN. The loading history is 0 kN→15 kN→35 kN→65 kN→95 kN→125 kN→155 kN→185 kN, and then symmetrical and gradual unloading is performed. After completing the first level of loading or unloading, it is stabilized for a few minutes, and then the reading and recording of the strains and displacements of the model are completed. After all, unloading is completed, the residual strain and displacement are read.
When the number of fatigue cycles reaches every 250,000 times, it is necessary to stop the machine for the static load test. Before the first static load test, it is necessary to complete the preloading work more than three times, and then formally start without abnormal conditions. The changes in the strain and displacement measurement points under the static load test are monitored to verify whether there is any abnormality.
Fatigue test process
In order to prevent the separation of the steel block and the full-scale model during the loading process and the stability of the model, the lower load limit of the fatigue test is 10 kN, and the upper load limit is 185 kN. After every 250,000 cycles of fatigue loading are completed in sequence, a static load test is performed to check whether the model is damaged or has other abnormal conditions.
After the 2 million fatigue cycle loading times are completed, if there are no fatigue cracks in the model, the load loading amplitude is increased, as shown in Table 2. After the 3 million fatigue cycle loading times are completed, the test is stopped, if the model still has no fatigue cracks.
Specific test load amplitude.

Arrangement of measuring points
The purpose of the reasonable arrangement of the measuring points of the test model is to fully and comprehensively reflect the structural stress characteristics of the orthotropic steel deck. The strain measuring points are mainly arranged in the key parts of each fatigue detail to obtain the distribution law of strains. In order to observe the effect of asymmetric loading, strain gauges were pasted at symmetric and fatigue details of the same type on the full-scale model. At the same time, the paste position is about 10 mm away from the weld toe. The vertical displacement measuring point is installed at the position of the middle diaphragm plate (TDP2), and there are three vertical displacement measuring points horizontally. On the one hand, it can inspect the actual stiffness of the fatigue test model, on the other hand, it can ensure the accuracy and safety of the fatigue test loading process. Due to the paper’s limitations, only the typical strain measuring points and displacement measuring points of the bridge deck (TBD) and U-rib connecting weld position are listed here. The corresponding measuring point positions and numbers are shown in Figure 14.

Detailed layout of measuring points: (a) arrangement of strain measuring points and (b) horizontal arrangement of displacement measuring points.
Result analysis
In the entire model test process, after every 250,000 cycles of loading, the machine stops for a static load test to obtain the strain or vertical displacement data of each point after different cycles of loading. Due to the paper’s limitation, the von-Mises stress and displacement results of some key measurement points at the weld joint position between the bridge deck and U-rib of the test model under different cycles of loading were plotted in Figures 15 and 16 below. Comparison between theoretical analysis results and actual full-scale test results at each measurement point are shown in Table 3.

Stress-load history curves of some key measuring points: (a) TBD-measuring point 2, (b) TDP2-Measuring point 8, (c) TBD-Measuring point 3, (d) TBD-Measuring point 12, (e) U-rib-Measuring point 4, (f) U-rib-Measuring point 13, (g) U-rib-Measuring point 5, (h) TDP2-Measuring point 18, (i)TDP2-Measuring point 9, and (j) TDP2-Measuring point 17.

Displacement-load variation curves of some key displacement measuring points: (a) measuring point F1, (b) measuring point F2, and (c) measuring point F3.
Table of comparison between model test results and theoretical calculation results.

By analyzing the above figures and tables, it can be concluded that:
(1) The theoretical calculation results of each measurement point are roughly consistent with the test results, indicating that the full-scale model can well simulate the fatigue characteristics of the actual bridge structure’s vulnerable parts.
(2) The stress values of the measuring points of different components in the same fatigue-vulnerable parts are often different to some extent. The results show that the load transfer process of fatigue vulnerable parts is different due to the different constraint settings, which affects the actual fatigue performance and fatigue life.
(3) The stress-load or displacement-load curves of key measurement point do not appear obvious mutation, all numerical size only in the acceptable range fluctuations, and is basically linear with the test load, with symmetry and good recoverability showing that fatigue damageable parts in the linear elastic state, and no fatigue failure occurs.
(4) In the process of 200 million times fatigue loading tests, no abnormal conditions and no fatigue crack initiation were observed in the model, indicating that the fatigue performance of the vulnerable parts of the model meets the design requirements.
More than 2 million fatigue test results
Based on the completed 2 million fatigue cycle loading tests, the load amplitude continues to increase and more than 2 million fatigue tests were carried out in accordance with the test plan described above. The Von-Mises stress results of some measuring points under the fatigue cycle loading test of more than 2 million times are summarized in Figure 17.
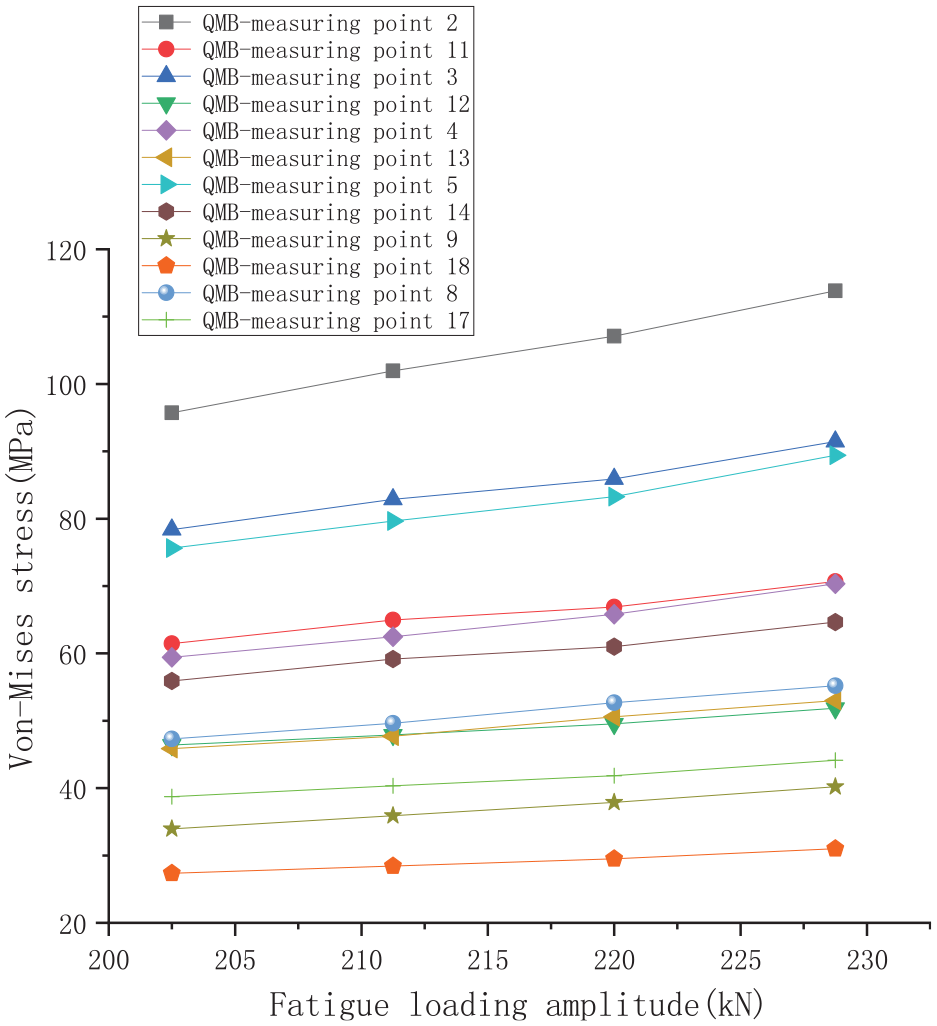
Stress results of test points after fatigue loading over 2 million times.
The analysis of the data listed in Figure 17 shows that: in the whole process of over 2 million fatigue tests, the stress value of each measuring point changes linearly with the linear increase of the fatigue loading amplitude, and no obvious stress mutation occurs, and no fatigue crack is found. That is to say, under the conditions of high stress amplitude and long service life, the fatigue details at the weld joint of bridge deck and U-rib in the structure have good fatigue performance and relatively high safety reserve.
At the same time, based on the linear fatigue cumulative damage criterion, that is, formula (3) is used to estimate the fatigue life of the test model for the number of cyclic loading and the corresponding load amplitude during the entire fatigue test process.
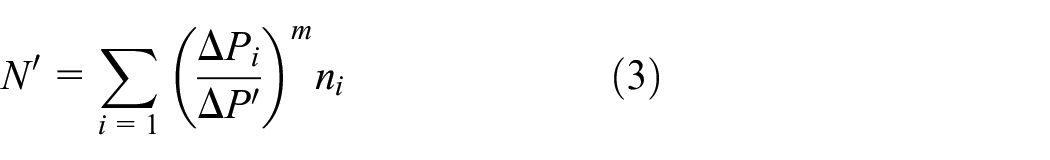
Among them,

Fatigue performance evaluation based on S-N curves
Fatigue performance evaluation of steel bridge deck in the design stage
Determine the total number of fatigue actions N within the design life of 100 years
Depending on the number of line traffic management planning, in the early 10 years, the total number of daily train groups is 200, and each group adopts the form of six trains; in the middle 20 years, the total number of daily train groups is 220, and each group adopts the form of six trains; in the future 70 years, the total number of trains running daily is 250 groups, and each group adopts the form of seven trains. That is, the total number of train sets in 100 years was 58,723,500, and the total number of corresponding axles was about 235 million. In the case of the adjacent four-axis loads described in section 1.3, the N value of fatigue details is 58,728,500.
Determine the allowable fatigue stress amplitude of the structural detail category
As for the fatigue details of the bridge deck and U-rib joints, the structural details can be classified into C structural categories to complete the evaluation. The allowable stress amplitudes of type C structural details under two different fatigue design states are listed respectively.
Fatigue design state I – infinite life design:

Fatigue design status II – 100 years finite life design:

Determine the actual design fatigue stress amplitude of each fatigue detail for verification
The following formulas are obtained to calculate the actual design fatigue stress amplitude of the bridge deck and the U-rib connection weld for the fatigue details for verification.
Considering the fatigue design state I, we can get:
Considering the fatigue design state II, we can get:
Fatigue results verification
Check calculations in accordance with the requirements of the specification, and the summary results are shown in Table 4 below.
Summary of fatigue performance evaluation in the design stage.

According to the analysis results in Table 4, the design stress amplitudes of fatigue details meet the requirements of infinite life design, except that the design stress amplitudes of fatigue details corresponding to the bridge deck and U-rib joint position on the diaphragm plate are 11.6% larger than the allowable stress amplitudes. The design stress amplitudes of all concerned fatigue details meet the requirements of 100 years of finite life design.
Fatigue life prediction of uncracked steel bridge deck in service
Determine the fatigue-checking details
The corresponding fatigue life prediction is still carried out around the fatigue details of the bridge deck and the U-rib joint weld.
Determine the actual stress amplitude
The actual variable amplitude track train load during the service period is equivalent to the constant amplitude fatigue load by using the discharge counting method. The stress amplitude of fatigue details is obtained by analyzing and calculating the constant amplitude of the fatigue load.
Determine the number of fatigue loads N′ and service life Y
Based on the S-N curve and equation (5), the fatigue details are obtained to predict the fatigue load action times and the corresponding service life.


Determine cumulative damage degree D
Based on the miner criterion, the cumulative fatigue damage degree D of the bridge structure in service can be calculated by analyzing the different stress amplitudes and the matching total number of cycles

Determine the remaining fatigue life Nuse and the remaining service life Yuse of the in-service bridge structure

Based on the above steps, the total predicted service life and predicted total damage of the fatigue details of the bridge deck and the U-rib joint weld can be calculated in turn. The results are now summarized in Table 5.
Summary of uncracked fatigue performance evaluation in service.

According to the data in Table 5, the predicted total fatigue life of all listed fatigue details in fatigue design state II is greater than 100 years (the normal service life of the bridge), and the predicted total damage degree is far less than 1, which is consistent with the calculation results in the design stage of subsection 3.2. Meanwhile, by comparing the total fatigue life of each fatigue detail, it can be found that: If the factors such as initial defects, train overload and overclocking times, and material performance differences are considered, the most likely place for fatigue failure in the future is the corresponding fatigue detail of the bridge deck and U-rib connection weld on the diaphragm plate (the total fatigue life is 145.53 years). The stress amplitudes of other fatigue details are relatively low, and the total fatigue life is much longer than the design service life. In addition, it also provides some references for sensitive areas that need to be focused on by bridge management and detection in the later stage.
Conclusion
(1) Through the finite element simulation analysis, the hot spot stress history curves of each fatigue detail under the single line adjacent four-axis fatigue load are symmetric and the adjacent load is effective. The stress history curves produce two stress cycles in total, which can be regarded as the “repetition” of the time history curve under the action of two single-line and biaxial loads. In addition, the maximum stress value of the fatiguing detail of the bridge deck and U-rib joint weld is about 1.4 times that of that under the action of single-line and biaxial loads.
(2) Within 2 million cycles of fatigue loading, the stress or displacement-load curves of the key measuring points of the model show a linear relationship with good symmetry and recoverability, there is no obvious strain mutation, and the stress or displacement value only fluctuates within an acceptable small range. In the 1 million times of fatigue cyclic loading with the increase of load amplitude, the measured point still did not show stress or displacement mutation and no fatigue crack was found. The fatigue detail of the model has good fatigue performance and high safety reserve under the condition of high-stress amplitude and long service life.
(3) For the fatigue performance evaluation in the design stage, the fatigue details all meet the requirements of the infinite life design, except that the design stress amplitude of the corresponding fatigue detail on the diaphragm plate of the bridge deck and the U-rib joint is 11.6% larger than the allowable infinite life stress amplitude. For the fatigue life prediction of the in-service uncracked stage, the total fatigue life of the fatigue details of the bridge deck and the U-rib joint weld is greater than 100 years, and the predicted total damage is far less than 1.
(4) If considering the actual possible initial defects, train overload or over-frequency, material performance differences, and other factors, the most likely part of fatigue failure is the fatigue details of the deck and the U-rib joint weld on the diaphragm plate.
Footnotes
Handling Editor: Chenhui Liang
Declaration of conflicting interests
The author(s) declared no potential conflicts of interest with respect to the research, authorship, and/or publication of this article.
Funding
The author(s) received no financial support for the research, authorship, and/or publication of this article.