
Abstract
With the development of rolling linear guide manufacturing, improvements of performance and reliability of rolling linear guide products have become the critical technical challenge. One of the key-points lies in the analysis of wear process, in which the crucial step depends on the computation of the wear coefficient. However, little attention has been devoted to the wear coefficient of rolling linear guide. Therefore, in this article, to reflect the actual working condition of rolling linear guide, a novel calculation model for the wear coefficient of rolling linear guide is established first through theoretical analysis. And then, based on a novel loading bench and a friction measuring device, the wear process and wear coefficients of a rolling linear guide (DA45CL) were obtained and analyzed. Further analysis shows that the wear coefficients obtained in this article, which are several orders of magnitude less than the previous empirical values, are more reasonable for the wear analysis of rolling linear guide. The current work provides a new theoretical and experimental method to investigate the wear coefficient for rolling linear guide, which is meaningful for the study of the wear process of rolling linear guide and other rolling components of computer numerical control (CNC) machine tools.
Introduction
With the development of the mechanical transmission technologies, the precision and performance of the products have been greatly improved.1,2 As one of the most important mechanical transmission devices, the linear guide is widely used as the key functional part for advanced computer numerical control (CNC) machines.3,4 In recent years, the rapid development of CNC machine has propelled the high performance and high reliability to become the cruxes of linear guide products.
For linear guide, current studies mainly focused on stiffness analysis, friction, and dynamic behaviors. Shaw and Su 5 proposed a theoretical approach to study the stiffness of non-clearance linear guideways without preload. Hu et al. 6 established the solution formula of contact stiffness for rolling linear guide. Sun et al. 7 analyzed the effects of load and preload on statics characteristics of linear guide. Miura et al. 8 analyzed the friction fluctuations in linear guides. Cheng et.al. 9 measured the friction of roller linear guide under various external loads, preloads, velocities, and lubricants. Wang et al. 10 presented a method to estimate the reliability and sensitivity of linear guides with random geometric parameters. Ohta et.al.11,12 studied the effects of grease types on vibrations and acoustic emissions of rolling linear guide. However, seldom studies focused on the wear analysis of rolling linear guide, which directly influences the performance and service life of linear guide.
Many studies have been conducted to the wear analysis. The researchers paid much attention to the effects of material compositions on abrasive wear.13–15 In order to obtain optimal wear properties without compromising the beneficial properties of the matrix material, several mathematical models have been constructed to select the proper testing conditions.16,17 Due to the advances in modeling the wear in mechanical contacts, Archard wear model is widely used to estimate the wear volume on the sliding surfaces in spur gears, silicon microbearings, rolls, and so on.18,19 Taking spherical plain bearing as an example, Shen et al. 20 proposed a numerical simulation forecasting method to solve sliding wear problems and simulated the nonlinear wear process with a series of discrete quasi static models. Ligterink and De Gee 21 calculated the specific wear rate of radial journal bearings using Archard wear law. With the modified Archard theory, Zhou et al. 22 investigated the precision loss of screw raceway under different axial loads, rotational speeds, and structure parameters.
As for linear guide, Tao et al. 23 employed the Archard wear theory to estimate the precision loss of roller linear guides and established a wear prediction model. Wang et al. 24 studied the wear process of slide guides and predicted the wear rate using Archard wear model. The wear coefficients in the above two studies mainly refer to the experimental results of Rabinowicz, 25 which are determined by lubrication conditions and contact materials. However, both the material composition and working condition used in Rabinowicz’s study are different from that in the linear guide components, which may lead to errors on the wear volume calculation and unreliable performance predictions of the linear guide. Therefore, in order to study the wear conditions more accurately, it is quite meaningful to investigate through experiments whether these wear coefficients are appropriate for the calculation of wear rate for linear guides.
Theory analysis
Wear volume of the carriage raceway
Based on the Archard wear theory, the amount of wear volume of the carriage raceway

where
While the working load

in which i is the number of rows of balls applicable in the calculation of load, Z is the number of load-carrying balls in one row, and
The sliding distance of a ball relative to the carriage raceway is given as

where t is the carriage running time and
The ball slipping velocity relative to the carriage raceway


where
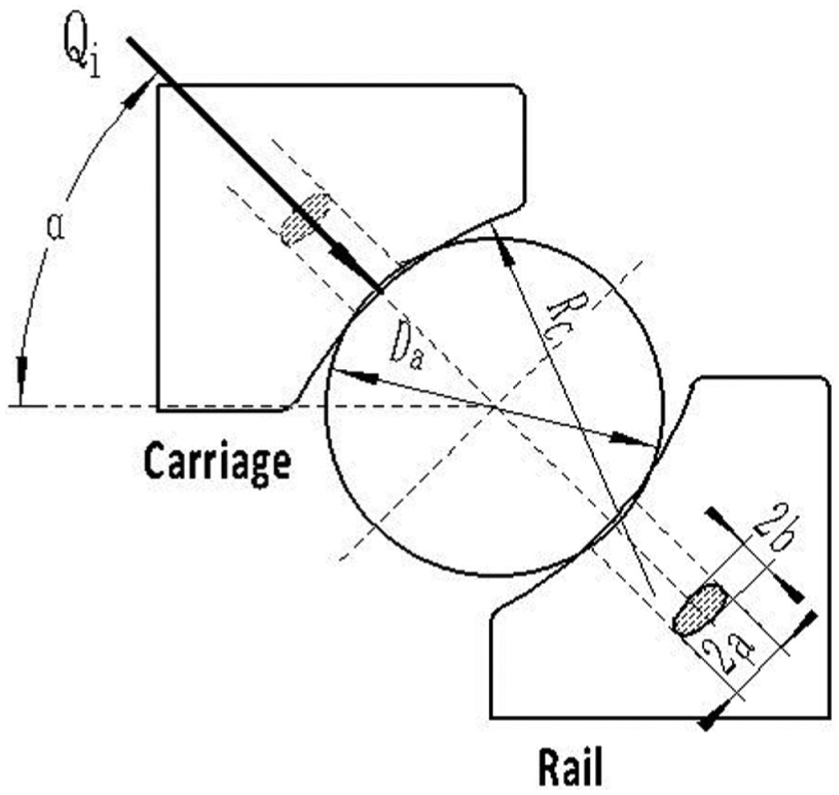
Contact model of rolling linear guide.
Substituting equations (2) and (3) into equation (1), the amount of wear volume of the carriage raceway

Contact area between the ball and the carriage raceway
According to the Hertz contact theory,
27
the contact surface between the ball and the carriage raceway is ellipse, as shown in Figure 1.
Based on the elliptical load distribution, the semi-major axis a and the semi-minor axis b of the contact ellipse can be calculated as 28


where
Using equations (7) and (8), the contact area between a ball and carriage raceway
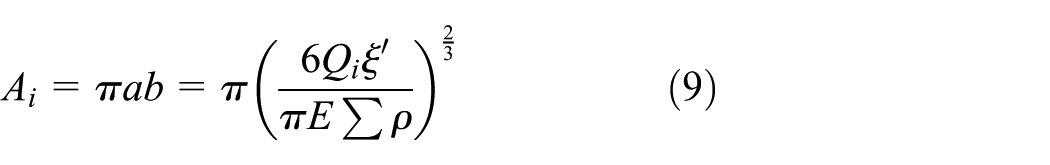
where
New model
Combining equations (6) and (9), the wear depth of the contact surface between a ball and the carriage raceway,

In Archard wear theory, the sliding surfaces always contact with each other. However, the abrasion is only generated from the part of the carriage raceway because of the interval contact between the carriage raceway and the balls. Figure 2 depicts the contact mechanism between the balls and the carriage raceway. During the running state of the rolling linear guide, balls are in contact with the abraded area. The shaded ellipse parts in the abraded area are the major wear regions which are corresponding to the Hertz contact elliptic area. Therefore, the overlay area between the contact ellipse and the abraded area can be approximately treated as a rectangle with the width of
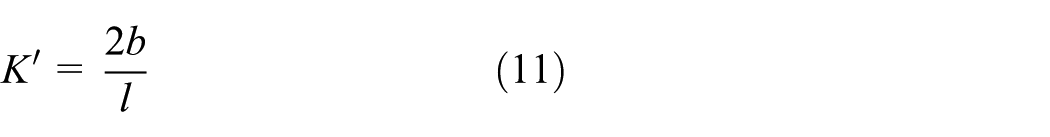
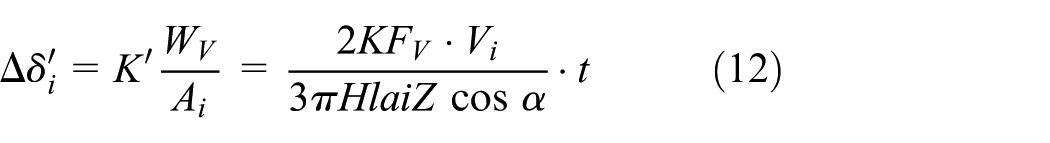
where l is the length of the carriage. Combining equations (10) and (11), the wear depth in the contact surface between a ball and the carriage raceway

Contact mechanism between the balls and the carriage raceway.
The total wear depth of a carriage raceway
Experiment research
Test linear guide
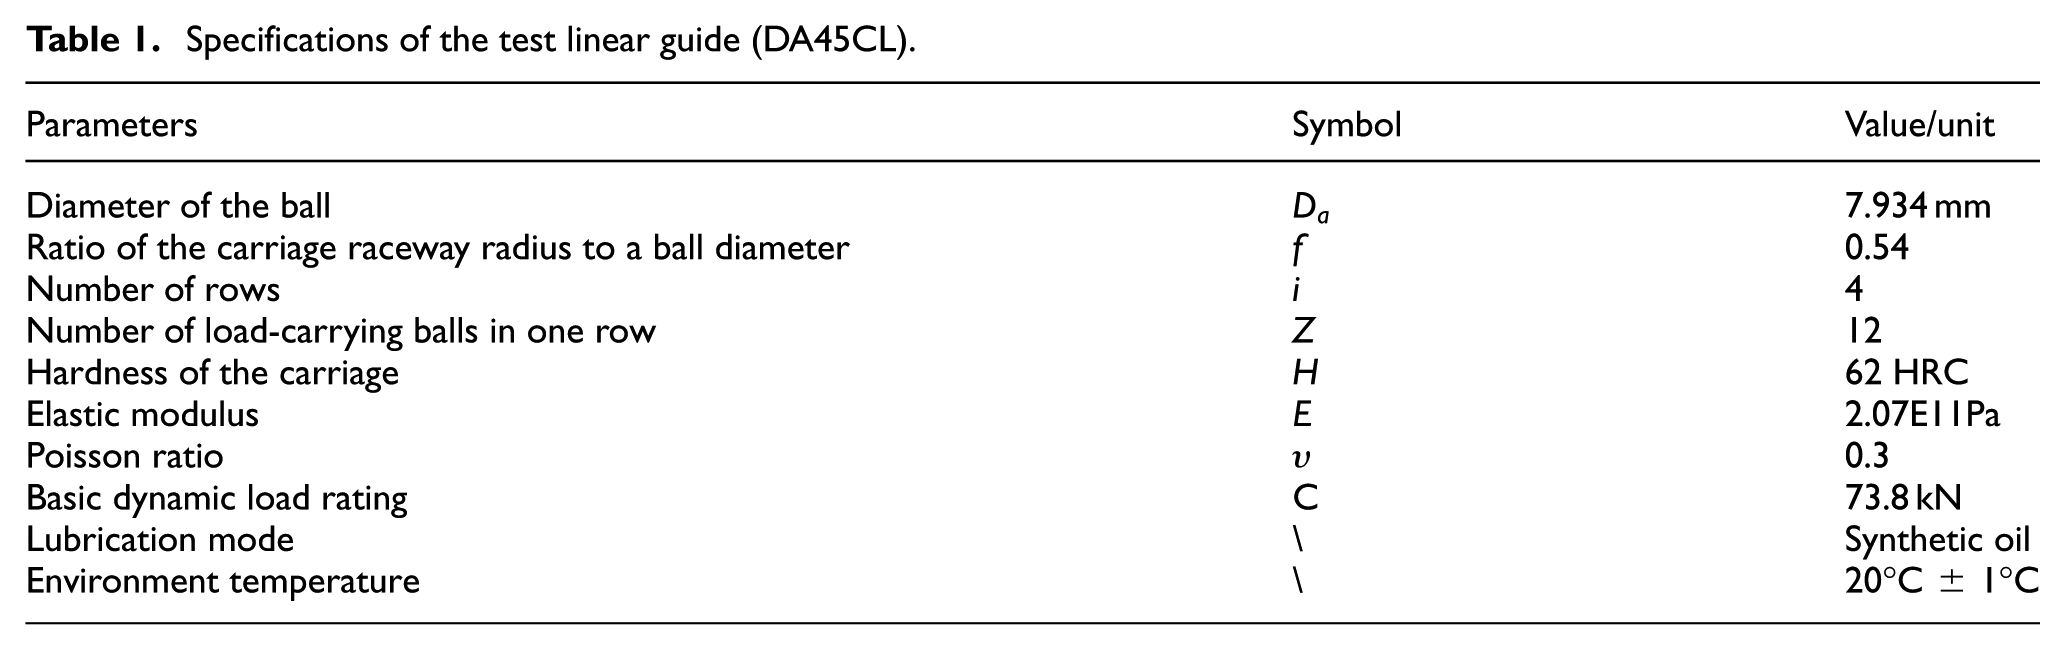
The test linear guide used in the experiment is the rolling recirculating type linear guide (DA45CL), which consists of a rail, a carriage, and balls. The specifications of the test linear guide (DA45CL) are shown in Table 1.
Specifications of the test linear guide (DA45CL).
Running test and friction measurement
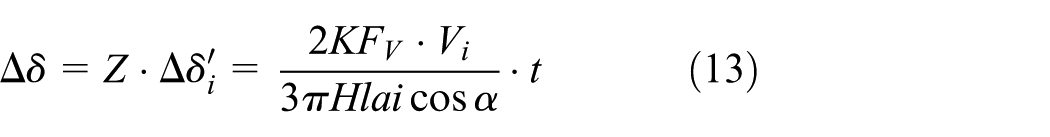
The experiments include two parts: running test and friction measurement. Due to the fact that, the normal force on the ball-raceway contact is an internal force and cannot be measured directly. Therefore, the friction force of the linear guide was measured after each specific running distance to obtain the normal force and local deformation on the ball-raceway contact. According to equation (13), the wear coefficient K can be obtained through the variation of the local deformation (which is the wear depth
The schematic diagram and photo of the running test bench for linear guide are shown in Figure 3 and 4, respectively, which mainly consists of supporting mechanism, driving mechanism, loading mechanism, and measurement system. Supporting mechanism includes gantry (1), lathe bed (2), and guide rails (3). Driving mechanism includes AC servo motor (4), pin gear (5), and rack (6). Loading mechanism includes servo motor (7), gears (8), and trapezoidal guide screws (9). Measurement system includes pressure sensor (10) and grating scale (11). There are two methods of loading the measured linear guide, which are manual loading (using handwheel (13)) and automatic loading. In order to improve the efficiency of test, the automatic loading was been chosen. Once the servo motor (7) rotates to drive the gears (8), the load is applied on the trapezoidal guide screws (9), and then the test linear guide (12) is loaded by nut. The applied load can be measured through the pressure sensor (10). After loading the test linear guide, the AC servo motor (4) drives the pin gear (5) along the rack (6), and then the gantry (1) is driven along the guide rails (3). The location of the test carriage can be determined by the grating scale (11). The maximum applied load is 147 kN; the maximum running distance and velocity of the gantry are 3.4 m and 1.4 m/s, respectively.

Schematic diagram of the running test bench.

Running test bench of linear guide.
In the actual working condition of DA45CL, the running speed is usually between 20m/min and 40m/min. And the load is usually set as 30% of the basic dynamic load rating (C=73.8KN). Therefore, the velocity of the measured linear guide was set as 30 m/min and the external load was set as 22.14 kN (30%C).
The friction was tested during each specific distance (the interval of measurement for friction is shown in Table 2) and each test repeated for three times. Before the friction test, the measured linear guide should be placed in the thermostatic chamber for 12 h to avoid the effect of temperature. The test rig and measurement apparatus are shown in Figure 5. When the linear motors drive the aerostatic moving platform (1) with holder (3) along aerostatic slideways (2), the measured carriage (7) was driven at a constant speed of 0.6 m/min by the holder (3) through the connecting block (6). At the same time, the friction of the test linear guide was measured by the pull pressure sensor. The experiment was ended when the friction decreased below 1 N, which indicates the preload was lost.
The interval of measurement for friction.


Friction test bench of linear guide.
The normal force between the rolling ball and the groove,

where
According to the contact mechanics, 27 the relationship between the normal force (FN) and the local deformation (δ i ) of the contact surface can be written as

where
Discussion and analysis
It needs to be mentioned that the running-in process (from 0 to 1 km) is ignored in the study for the analysis of wear coefficient. The measured friction and calculated preload (by equation (14)) are listed in Figure 6. Based on the values of preload, the deformation at each specific distance is calculated by equation (15), which is shown in Figure 7. The black rectangle points indicate the experimental values and the red solid line indicates the linear fitting result. It can be seen that the deformation decreases with increasing running distance, which has two different descent stages. And there is a linear relationship between the deformation and running distance at each stage. The downtrend of the first stage (0–60 km, which is called the initial wear stage) is relatively obvious than the downtrend of the second stage (60–1000 km, which is called the steady wear stage). This means the wear loss of the first stage is much higher than that of the second stage. The slope of the fitting curve for the first stage is

The measured results.
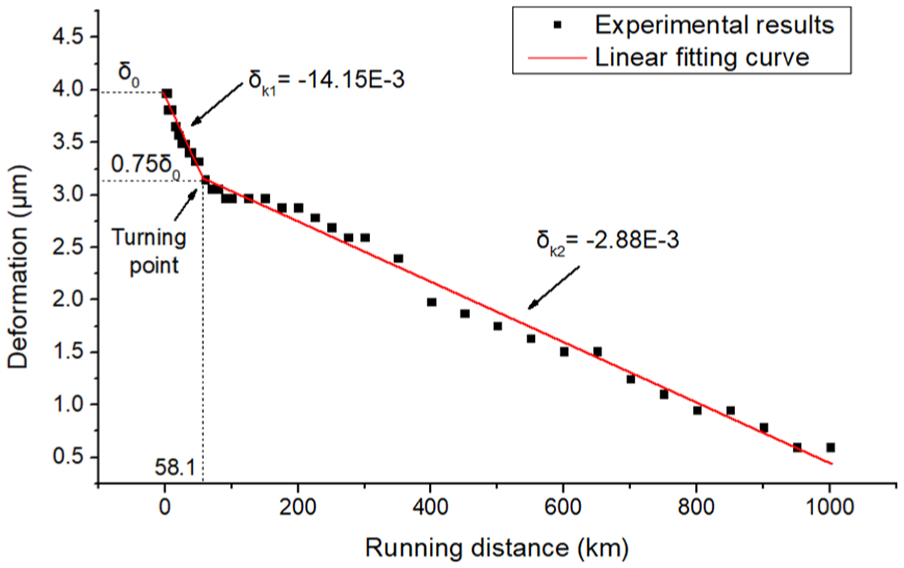
The deformation under different running distances.
Due to the geometrical error of the raceway of the carriage and rail, the effective ball number is usually less than the theoretical value, which causes a great increase of the normal force on the ball-raceway contact. Therefore, the wear is relatively severe in the initial wear stage. With the increase of wear on the ball-raceway contact, the geometrical error of raceway is gradually decreased. This means the effective ball number increases and the normal force on the ball-raceway contact decreases. Therefore, the wear trend is gradually stabilized.
According to the theoretical analysis in sections “Theory analysis” and “Experiment research,” the wear coefficient for rolling linear guide, K, can be written as

where
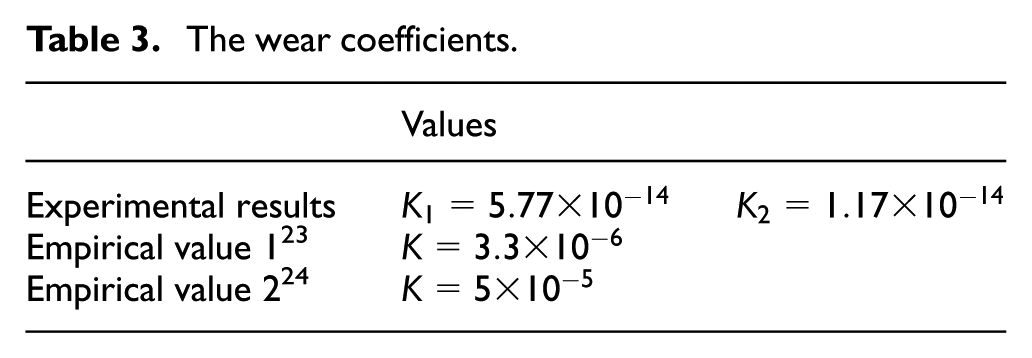
By substituting the slopes of two fitting curves
The wear coefficients.
Conclusion
In this article, the modified Archard theory with a new coefficient was applied to reflect the actual working condition of rolling linear guide, and a new calculation model was established to calculate the wear coefficient. The main conclusions are drawn from the experimental and calculated results as follows:
The new coefficient,
According to the experimental results, the wear process of rolling linear guide mainly consists of two stages: the rapid wear stage and the steady wear stage. Due to the geometrical error of the rolling linear guide, the wear coefficient of the first stage is about five times higher than that of the second stage.
For the rolling linear guide (DA45CL) used in this article, the deformation with two wear stages had a turning point at 58.1 km, which was 75% of the initial deformation. And the wear coefficients in two different stages were
Due to the similarity in the kinematics and dynamics of rolling linear guide, ball screw, and rolling bearing, the theoretical and experimental methods in the current work can be applied to the wear analysis of ball screw and rolling bearing.
It has to be mentioned that due to the limitation of time and test sample, only one rolling linear guide (DA45CL) was tested in the current work. However, to obtain a more reliable turning point and wear coefficients of rolling linear guides, more samples need to be tested in our future research.
Footnotes
Acknowledgements
Acknowledgements are made to the Key Laboratory of Performance Test and Reliability Technology for CNC Machine Tool Components of China Machinery Industry for providing the test benches and device.
Handling Editor: Noel Brunetiere
Declaration of conflicting interests
The author(s) declared no potential conflicts of interest with respect to the research, authorship, and/or publication of this article.
Funding
The author(s) disclosed receipt of the following financial support for the research, authorship, and/or publication of this article: This work was supported by the National Science and Technology Major Projects of China (2016ZX04004008-01).