
Abstract
The contact stiffness and damping play an important role in determining the dynamic characteristics at various mechanical joint surfaces in an assembly body. In this article, a bi-fractal model is proposed to overcome the drawbacks of the G-W and M-B models, which only considered the contacts that have the same fractal parameters for the joint surfaces. A surface impact coefficient is also introduced to calculate the real contact area from the microscopic and macroscopic perspectives, which can be used to obtain the contact stiffness and damping of rough surfaces by applying the contact formula between rough planes. In addition, the contact body is approximated to a number of asperities stacked on a base, similar to a series structure of two springs. The series structure can reasonably account for the limitations of the contact stiffness and damping at joint surfaces. With these improvements, this study establishes a more precise joint surface model determining the stiffness–load and damping–load relationships. An experiment is performed to compare the contact stiffness and damping determined from this theory with the experiment results. The theoretical values correspond well with the experimental values. The contact stiffness increases non-linearly with the load; the increase is initially quick and then slows down and stabilises. A value of D = 1.42 is obtained as an estimated critical value which determined the contact damping increase or decrease with load. The model can predict the trend in the contact stiffness and damping based on the loading to better prepare for a dynamic assembly analysis.
Introduction
The contact interfaces between parts, components, and assemblies are called mechanical joint surfaces (joint surfaces hereafter). These interfaces belong to the flexible bodies and withstand contact pressures. Furthermore, geometry errors, microscopic roughness, and a variety of oil mediums may exist between these interfaces. Any dynamic load will induce a slight relative linear displacement between the joint surfaces, storing and consuming energy both elastically and plastically via the contact stiffness and damping.
1
The contact stiffness and damping of a joint surface is often a significant contributor to the overall stiffness and damping of an assembly, and dynamic studies have demonstrated that approximately 60%–80% of the flexibility and more than 90% of the damping in an assembled body were caused by the joint surfaces.2,3 Researches on the contact stiffness and damping at a joint surface are crucial for prediction dynamics, guidance alignment, and optimisation decisions for the assembly. The parts are assembled according to the process sequence. The different contact states of each joint surface are determined by different assembly processes, which form the isomorphic and heterogeneous contact stiffness and damping matrices (
Most of the existing researches on the contact characteristics of joint surfaces includes the Hertz contact model,5–7 G-W contact model, 8 and M-B contact model. 9
Hertz theory is the first to solve the contact problem of frictionless elastic homogeneous with small deformation due to normal loading, which was mainly used to deal with the contact surface shape, contact area, and contact stress between smooth surfaces in the macroscopic domain without the consideration of microscopic characteristics, such as roughness, processing methods, and surface morphology. It presented a index relationship of load–area
In the following, Hertz theory was extended by Greenwood and Williamson (G-W model), who approximated the surface topography by asperities possessing spherical summits with uniform radius of curvature and Gaussian height distribution, and assumed purely elastic deformation of the interacting asperities which are sufficiently apart from each other in order for mechanical interaction to be secondary. The G-W model examined the contact attributes of the joint surfaces statistically by relating two material properties (the elastic modulus
A more sophisticated approach to handling the contact between rough surfaces was offered by Majumdar and Bhushan (M-B model), who developed a fractal geometry (the fractal dimension D and fractal roughness G was introduced) model with intrinsic advantages of scale independent and self-affinity. One criticism of the M-B fractal model is that it predicted that the lighter the load is, the greater will be the percentage of contacts that are plastically deformed. This counterintuitive result arises from the fact that, for a given surface, the radius of curvature of an asperity is determined solely by the contact diameter. The M-B fractal model viewed the joint surfaces as a number of spherical contact asperities and defined distribution function of asperities17,18 as
But the M-B model should be actually called the single-fractal contact model between rough plane which required contacting bodies to be with same fractal parameters and be rough planes. This article develops specific calculations and comprehensive discussions for the contact stiffness and damping of joint surfaces based on the M-B model. The bi-fractal model is introduced to overcome the limitation of requiring same fractal parameters, and the surface impact coefficient is proposed to deal with surface contact by applying the formula of planar contact. Besides, the series structure of asperities stacking on the base is put forward which can reasonably account for the finiteness of contact stiffness and damping at joint surfaces. The results obtained from the proposed model correspond well with the experimental values. The involved parameters and meaning are presented in Appendix 1.
Methods
Algorithm improvements
Bi-fractal contact model
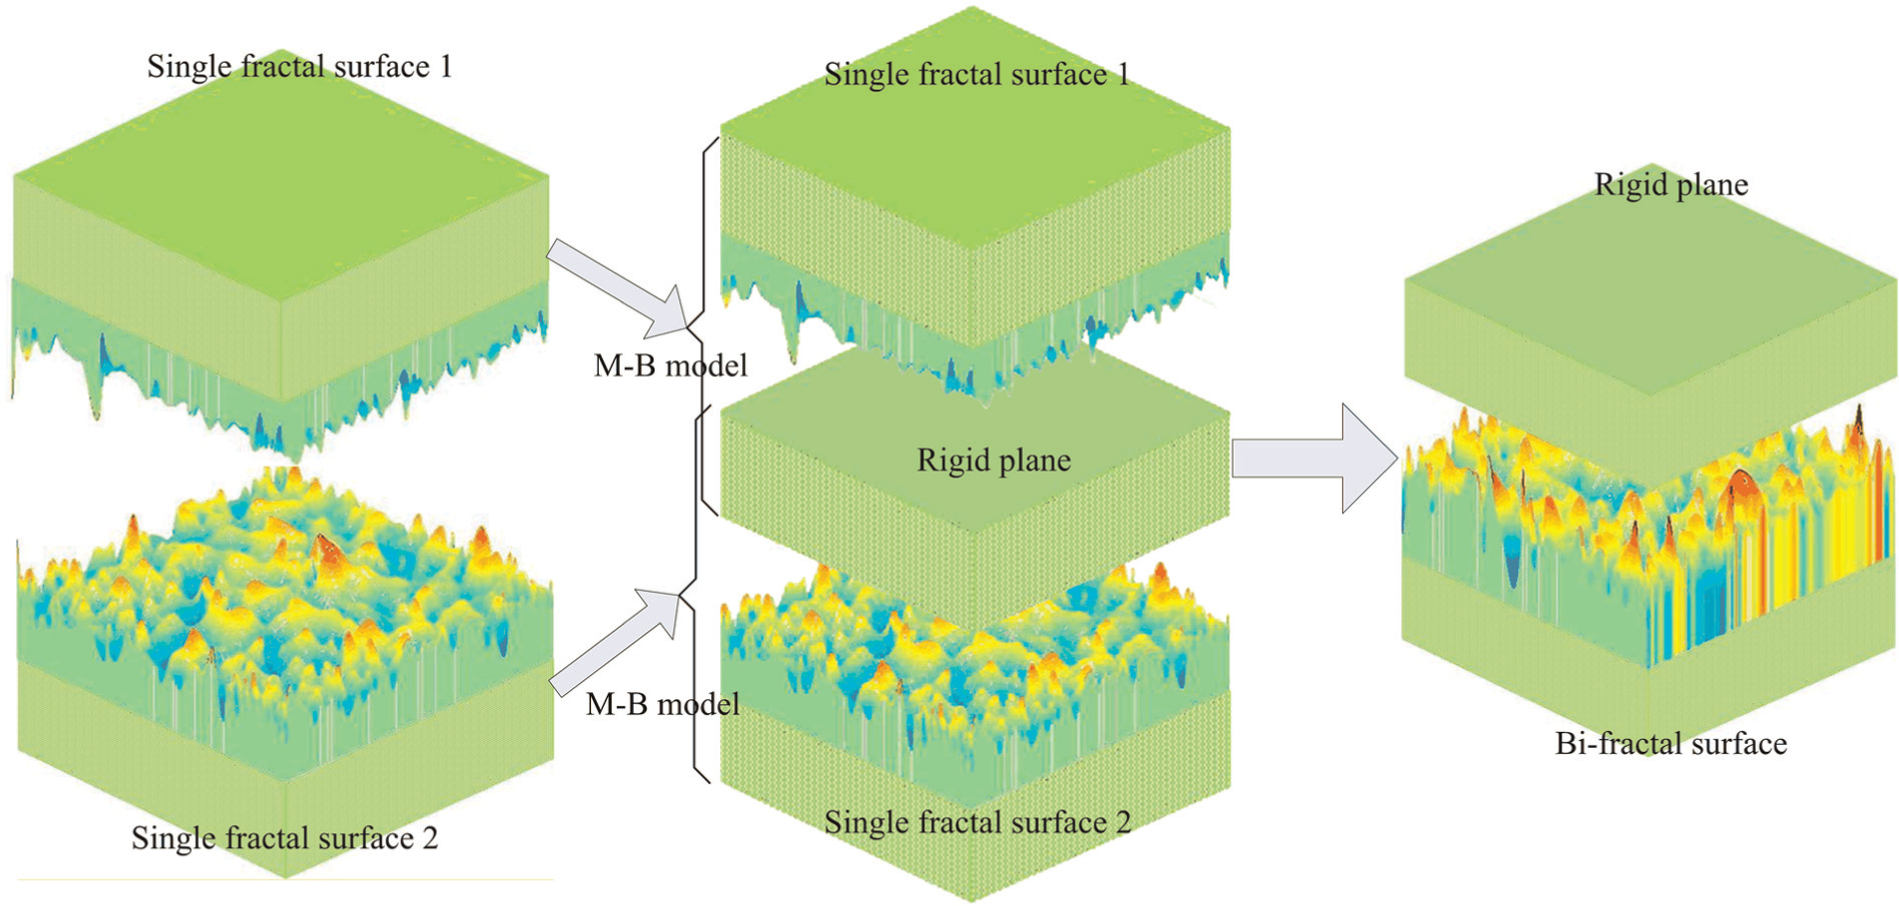
The M-B model established a mechanical model of the joint surface via fractal geometry, which could avoid data instabilities. In the M-B model, the fractal parameters of the two rough surfaces were assumed to be equal (D = D1 = D2 and G = G1 = G2). The fractal parameters could also be equivalent to an elastic rough surface (D and G) and rigid plane in contact, so that the M-B fractal model is also called a single-fractal model. In fact, the fractal parameters of the two rough surfaces are often different (D1≠D2 and G1≠G2). In this case, the two single-fractal surfaces that are in contact are equivalent to a bi-fractal rough surface and rigid plane in contact, and the bi-fractal rough surface has an equivalent elastic modulus E and equivalent fractal parameters (D and G) (see Figure 1).
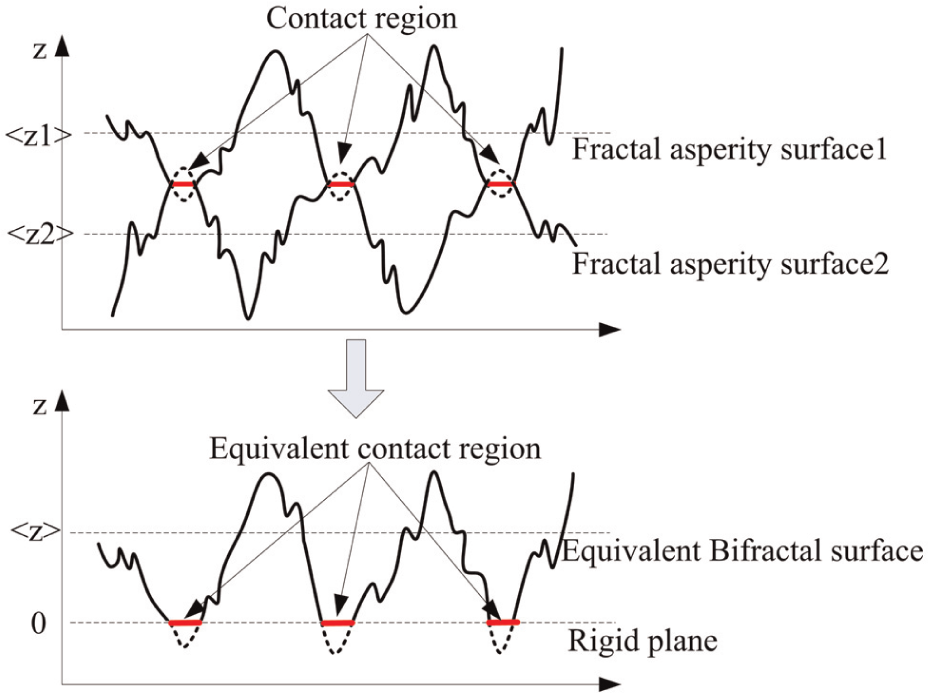
Two single-fractal surfaces are simplified into a bi-fractal surface and rigid plane.
The equivalent structure function of the two single-fractal surfaces (D1, G1, D2, and G2) in contact31–33 is
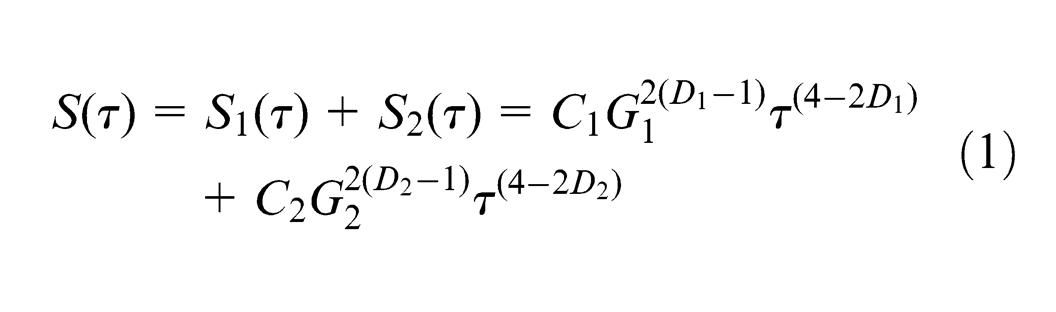
where
When
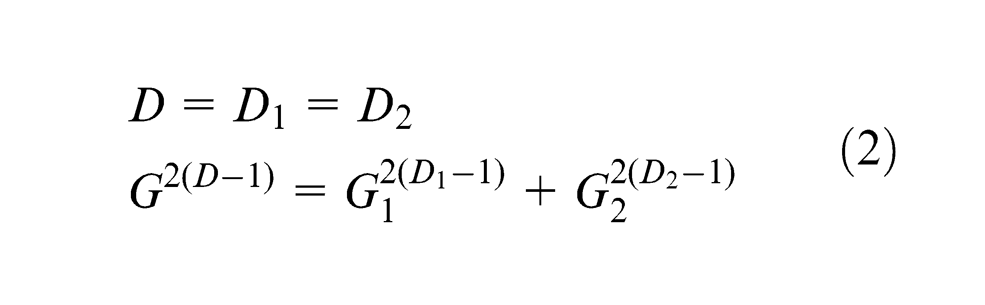
When
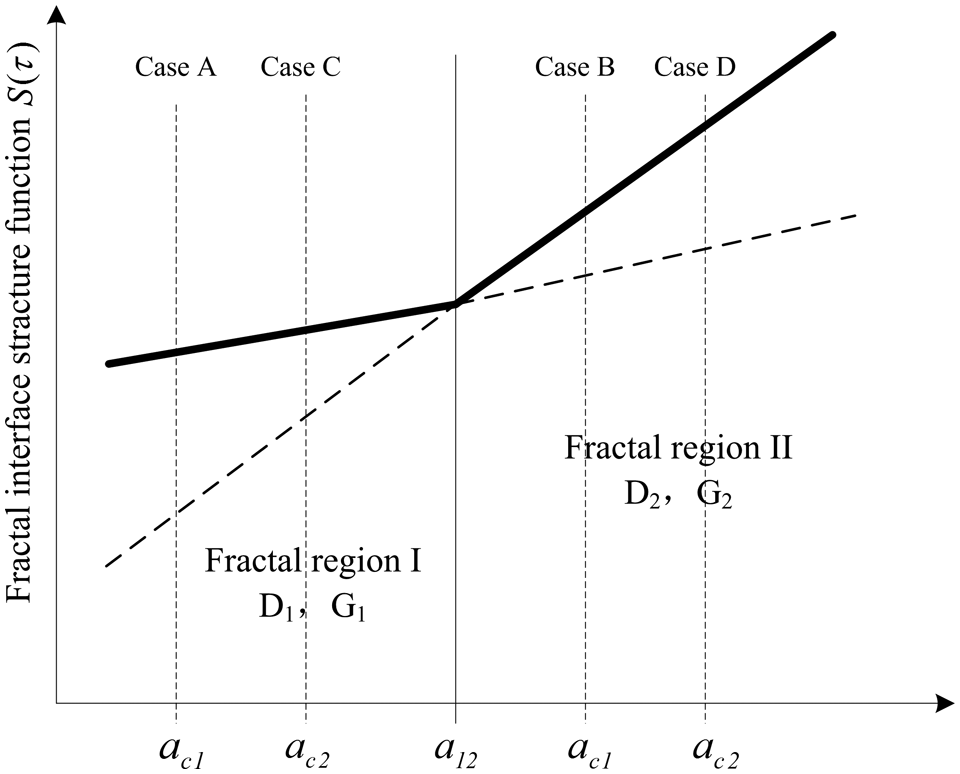
Logarithmic curve of the structure function of a bi-fractal surface.
Where
Case A (
Case B (
Case C (
Case D (
The normal characteristics of a single asperity are as follows:
The plastic load is defined as
The elastic load is defined as
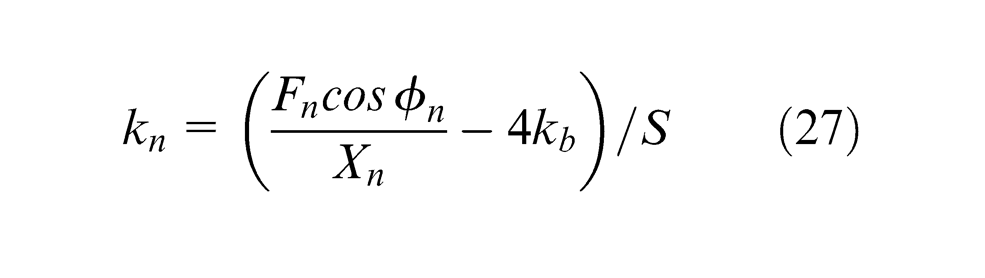
The normal contact stiffness is defined as
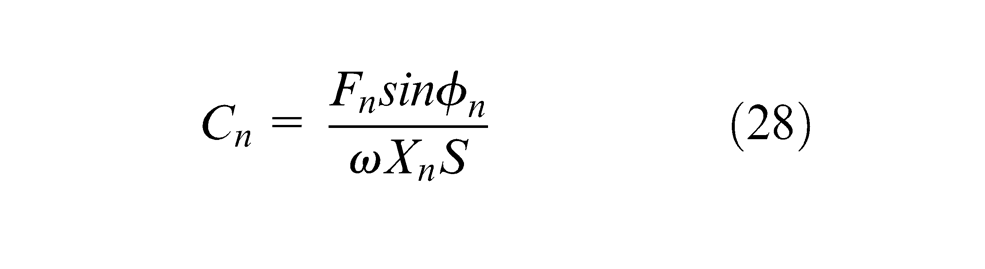
The normal contact damping is defined as
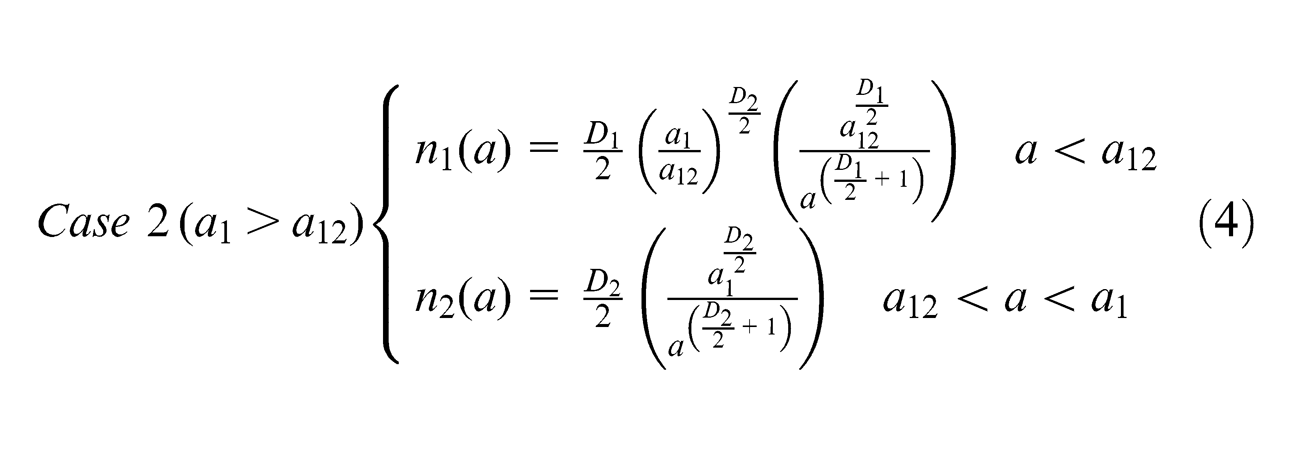
The distribution function for the contact area is divided into the following two cases
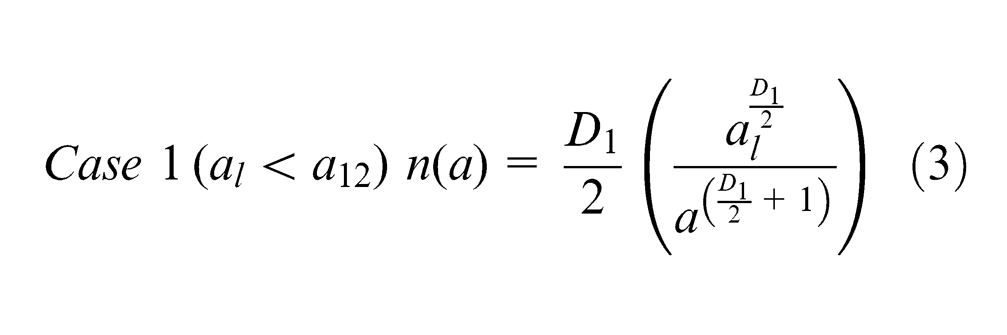
In Case 1, the asperity deformation does not enter fractal region II, so the stiffness and damping is determined in accordance with the traditional M-B single-fractal model using the equivalent fractal dimension D and fractal roughness G.
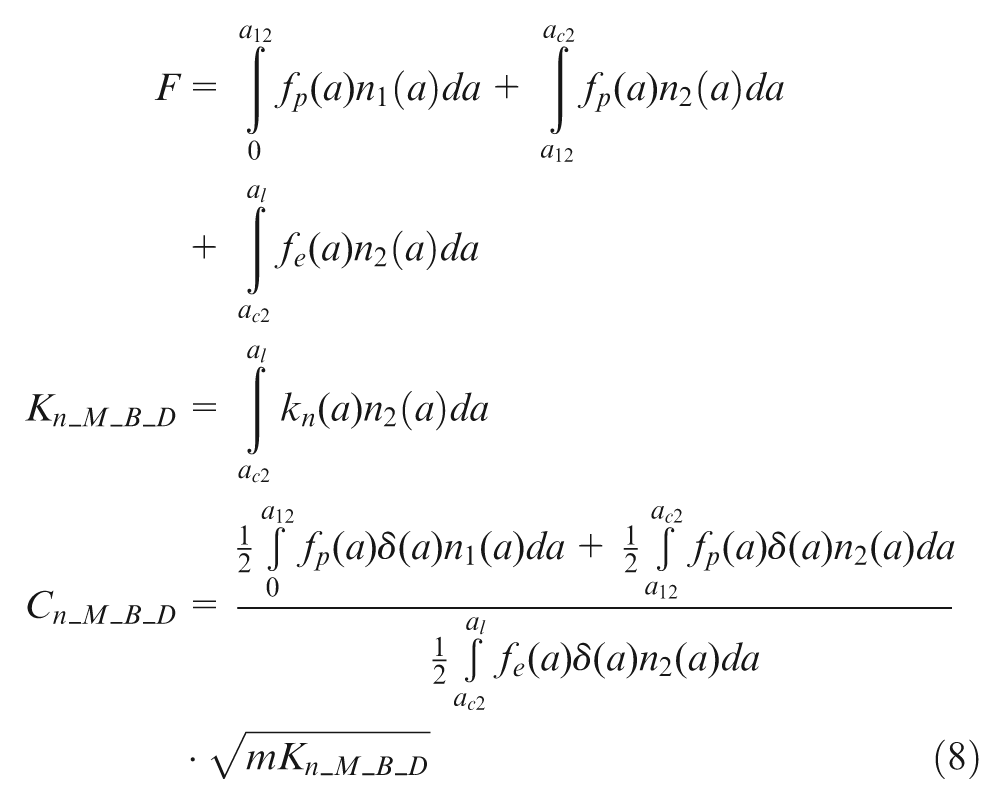
In Case 2, the asperity deformation has entered fractal region II and can be divided into the following four situations to determine the loading, contact stiffness, and contact damping (subscript
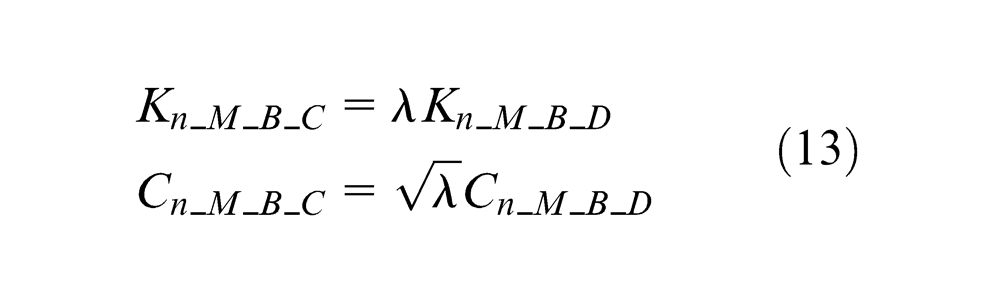
Cases A and C:
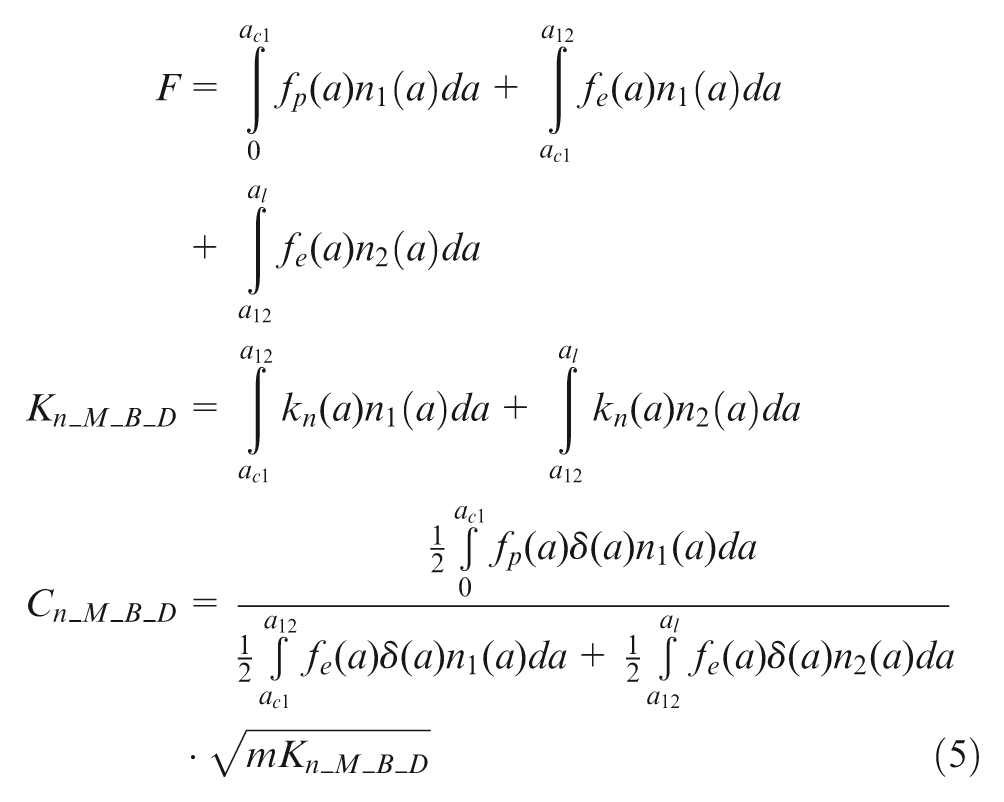
Cases A and D:
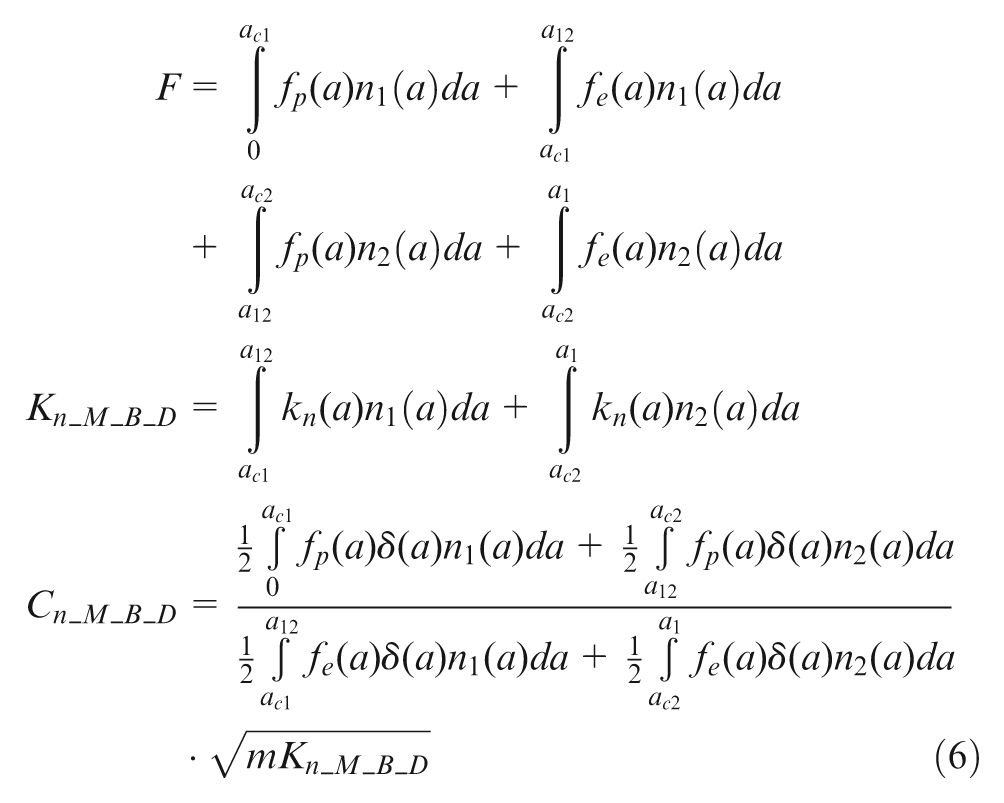
Cases B and C:
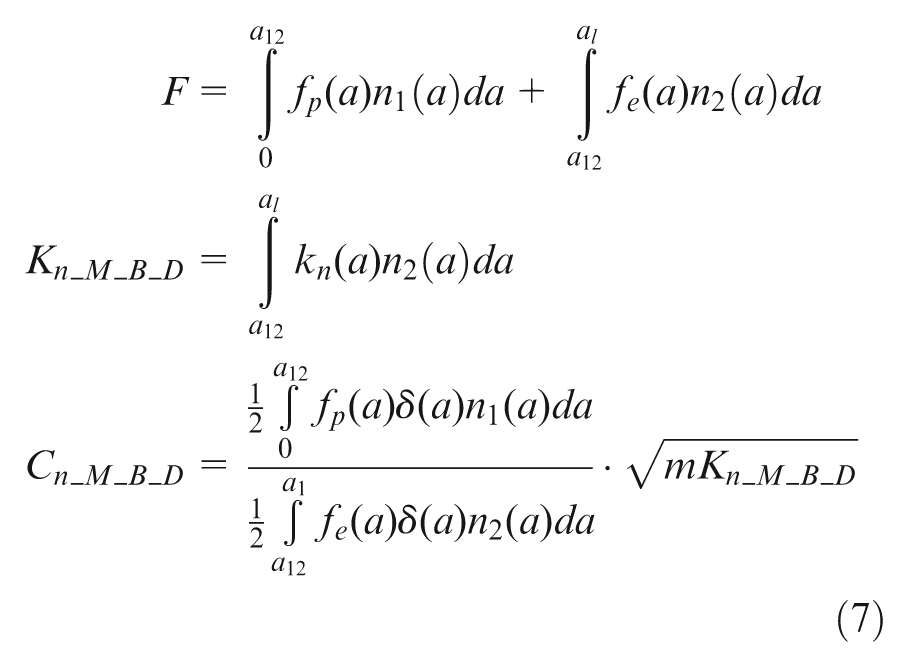
Cases B and D:
Surface fractal contact model
The G-W model and M-B fractal contact model were concerned only with the rough planes contact without involving rough surfaces. Specifically, these models only considered the impact of the contact surface microscopic morphology on the contact stiffness and damping without considering the impact of the macroscopic surface shape on the contact stiffness and damping.
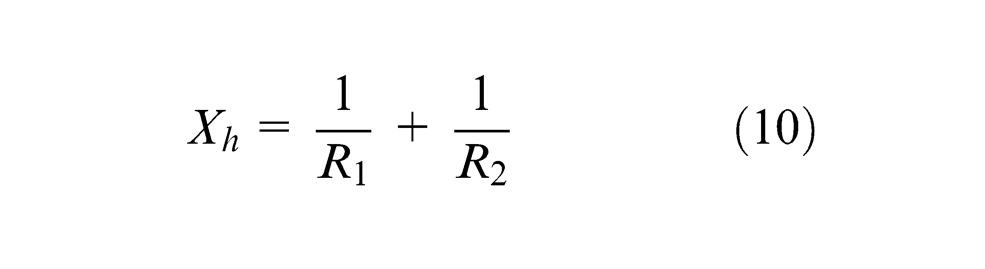
When two rough surfaces come into contact, the actual contact area is less than the one of the same size rough plane due to the impact of the surface shapes. The surface impact coefficient was introduced to account for this phenomenon (see Figure 3) 34
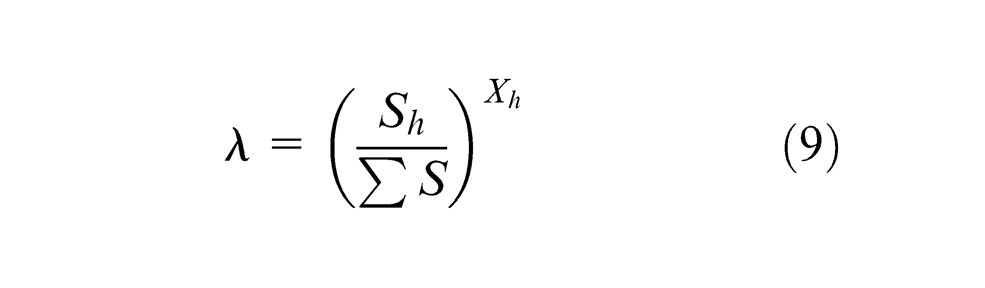
where
where
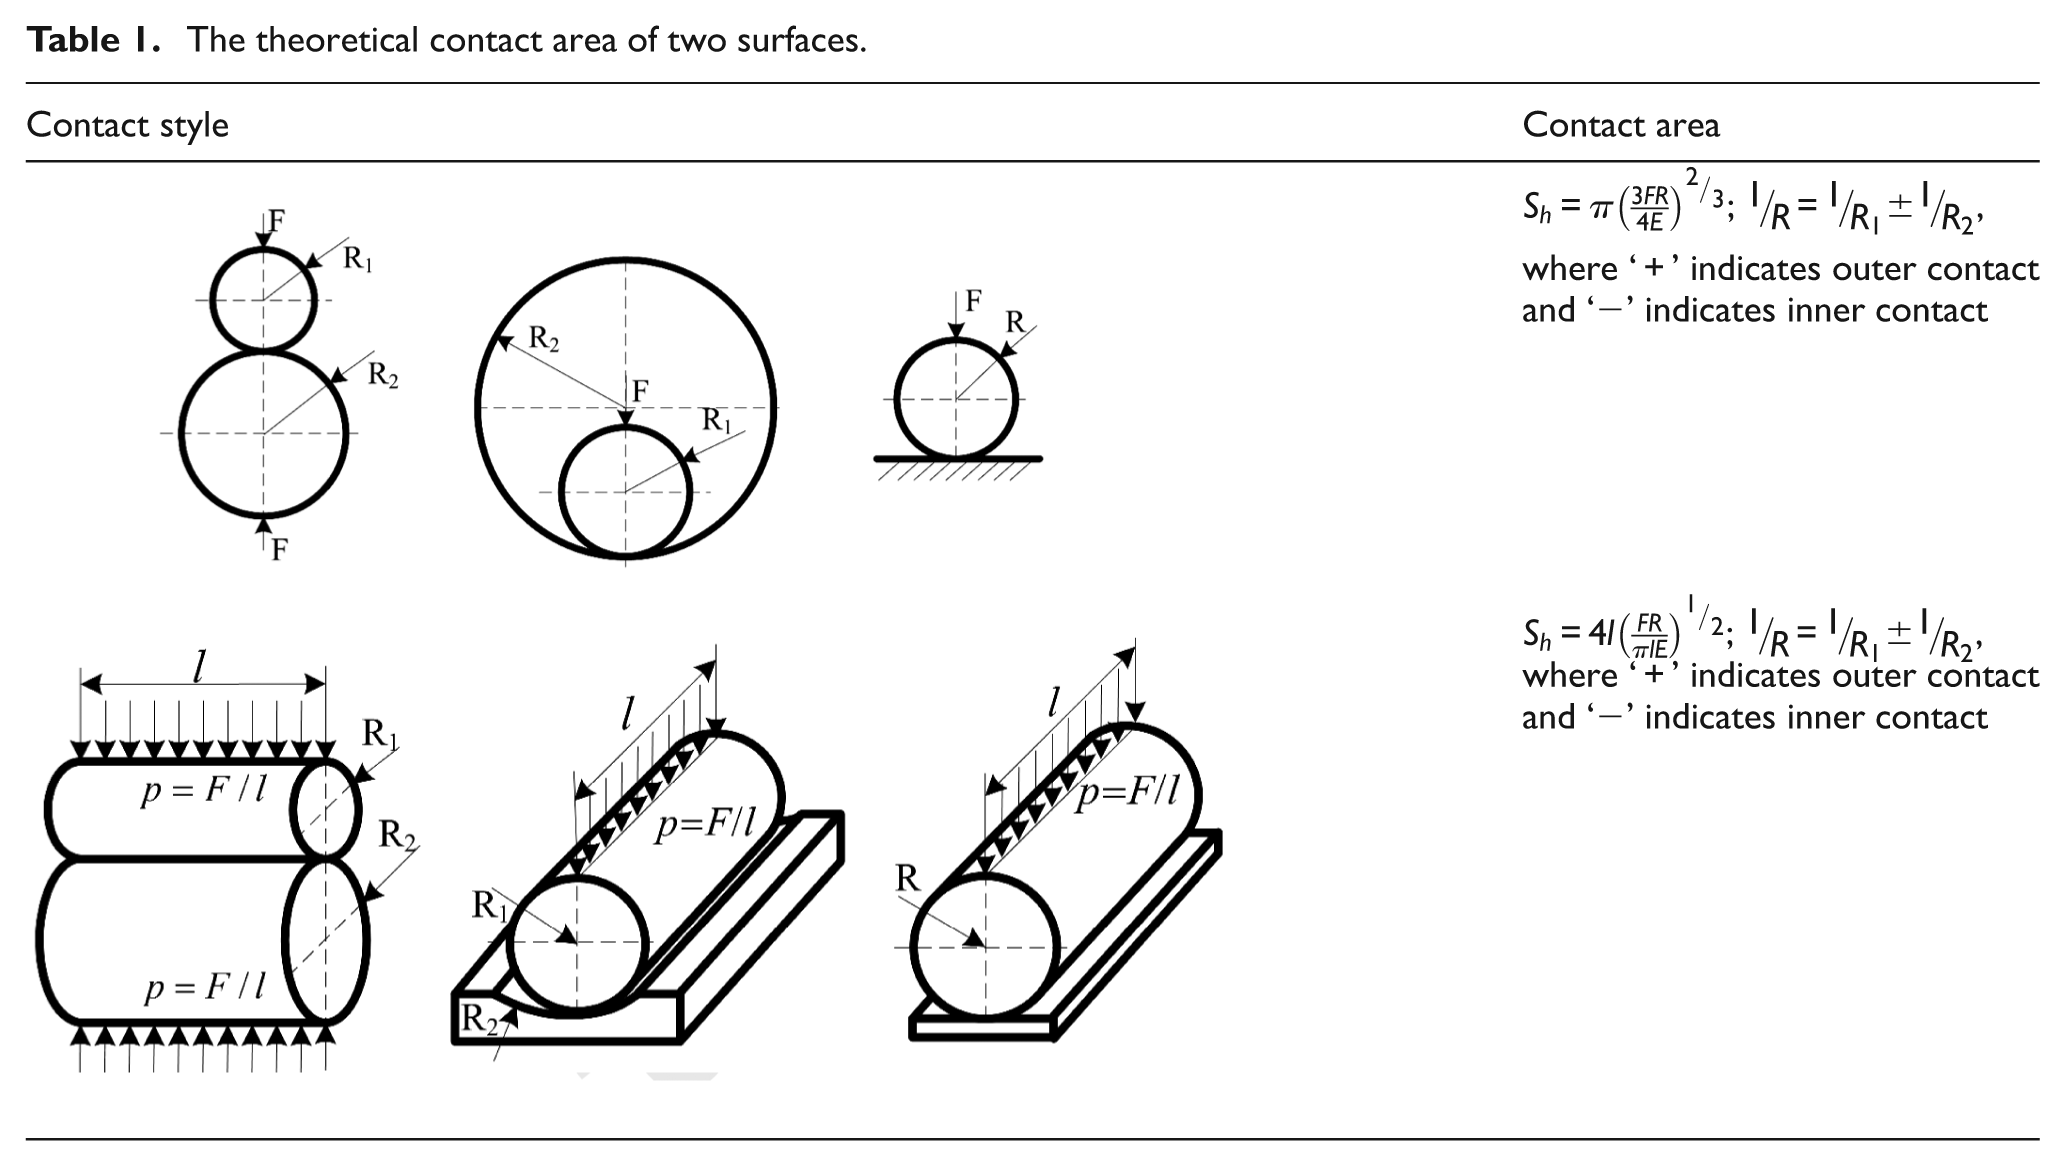
The theoretical contact area of two surfaces.
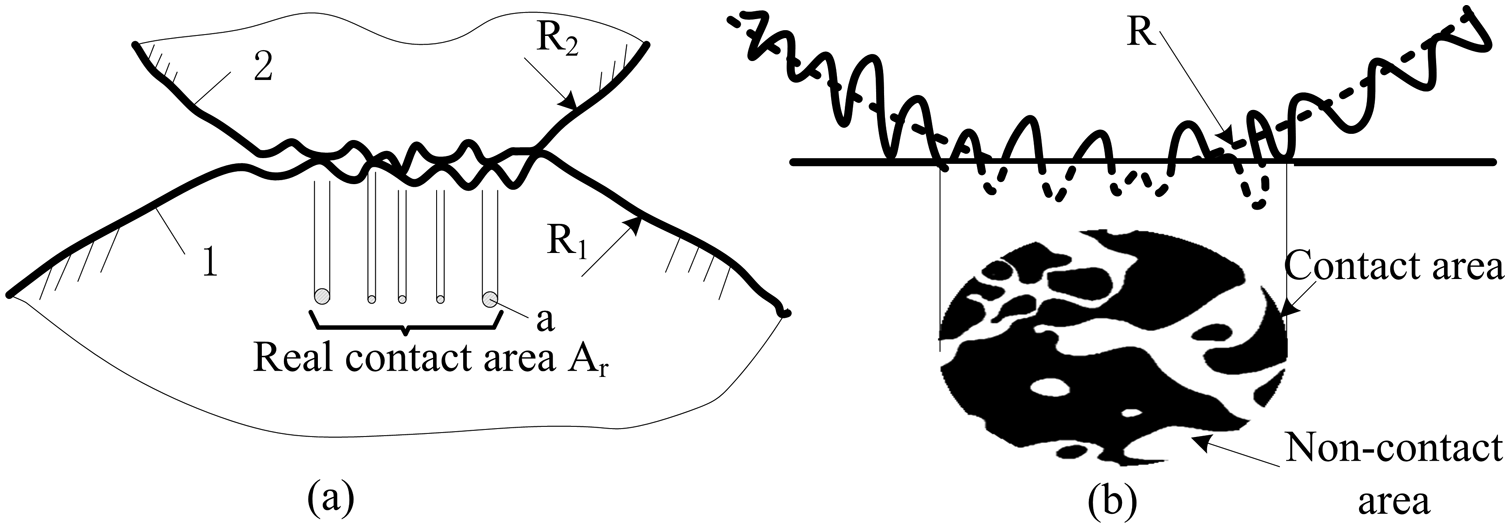
Micro-model of the surface contact.
The variable
where
The new contact area distribution function is defined as
The real contact area is defined as
Series fractal contact model
The G-W model and M-B fractal contact model only considered the contact stiffness and damping changes with the actual contact area. In fact, the contact body could be simplified to a smooth base with a rough surface connected in series (see Figure 4). During loading, the smooth base also incurs a slight deformation. The contact stiffness and damping of the smooth base are constant, whereas the contact stiffness and damping of a surface asperity changes non-linearly with any increase in the load.
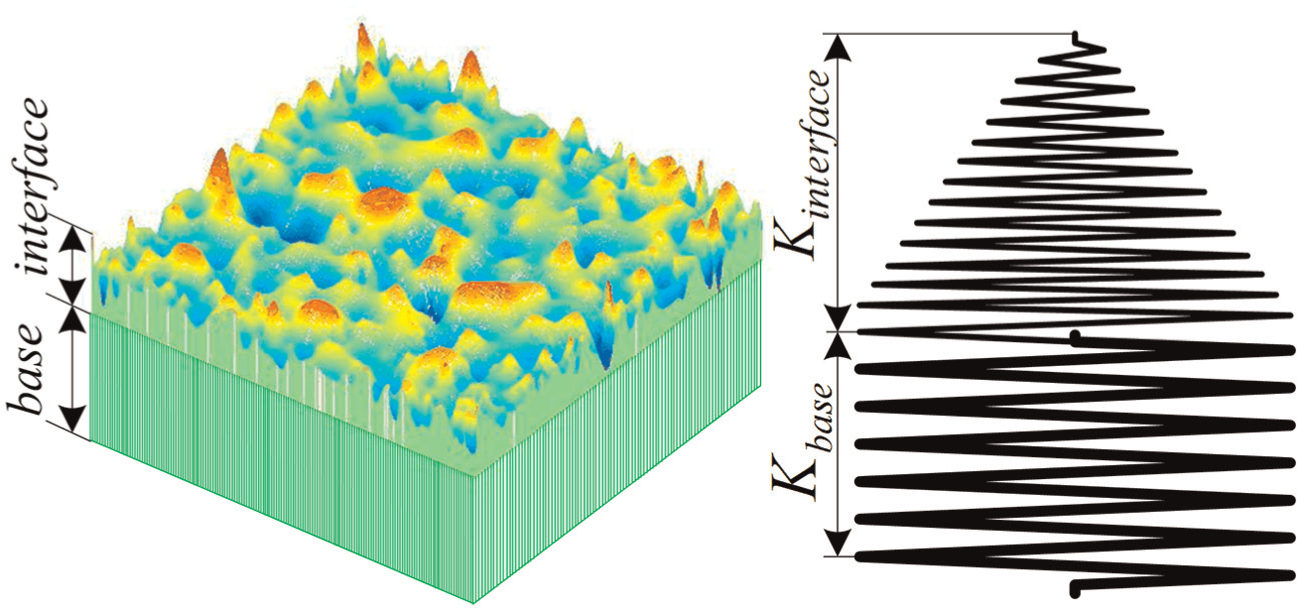
Simplified model of the contact surface in series.
The base stiffness is defined as
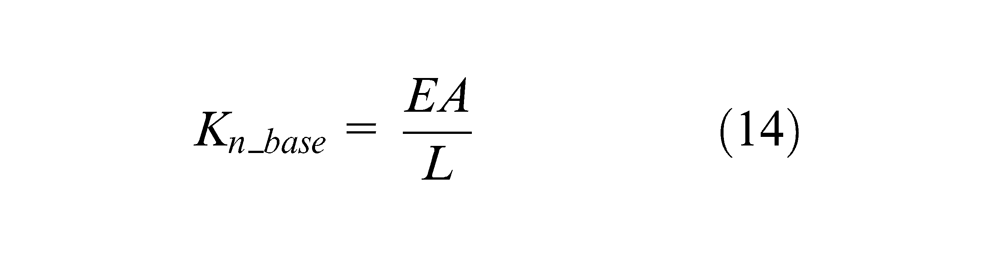
where A is the cross-sectional area of contact body, and L is the thickness of contact body.
The asperity stiffness for a planar contact is defined as
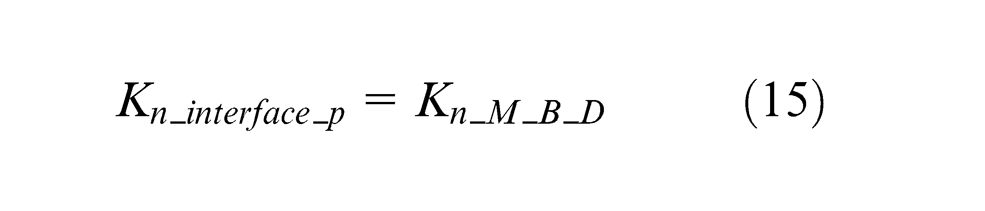
The asperity stiffness for a surface contact is defined as
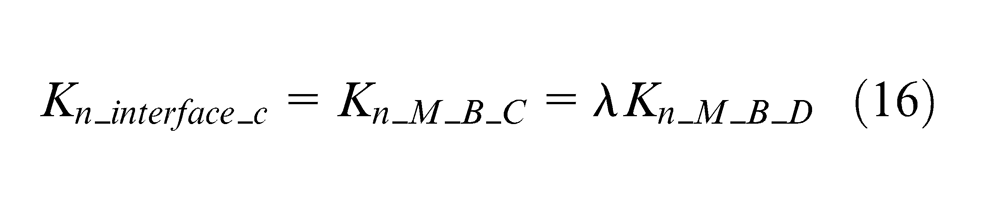
The contact stiffness can be related in parallel according to spring formula as follows
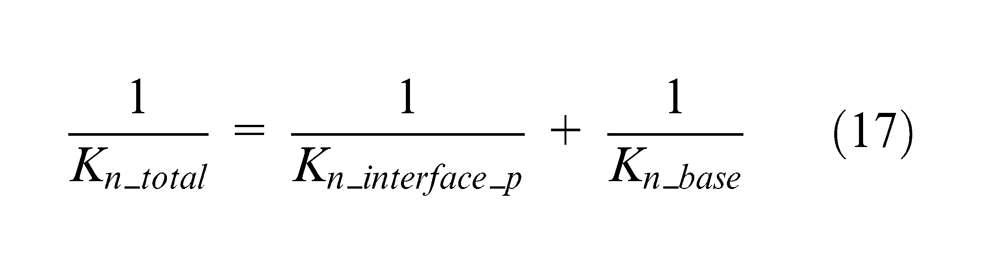
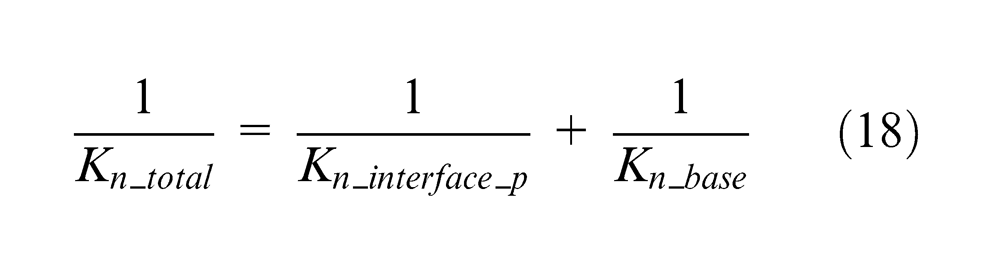
The total stiffness for a planar contact is defined as
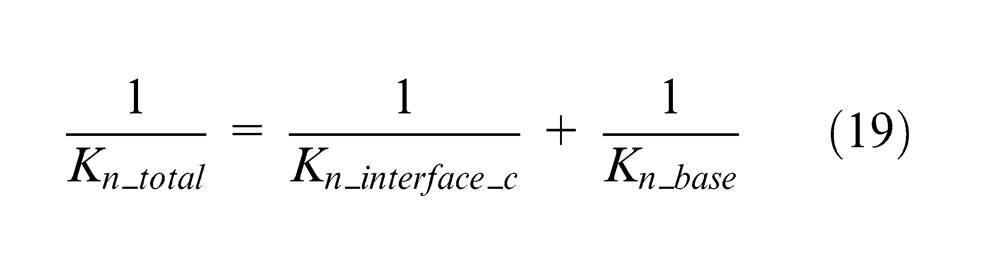
The total stiffness for a surface contact is defined as
Design of experiments
The principles of the experimental design in this study are
To guarantee that pressure is evenly distributed on the joint surfaces;
To minimise the measurement of physical quantities and facilitate more direct measurements;
To ensure high sensor resolution and high measurement accuracy and reliability;
To ensure that the dynamic characteristics of the joint surface can be extrapolated from the experimental system.
According to these principles, the investigated interface is formed by the square contact surfaces of
The variable
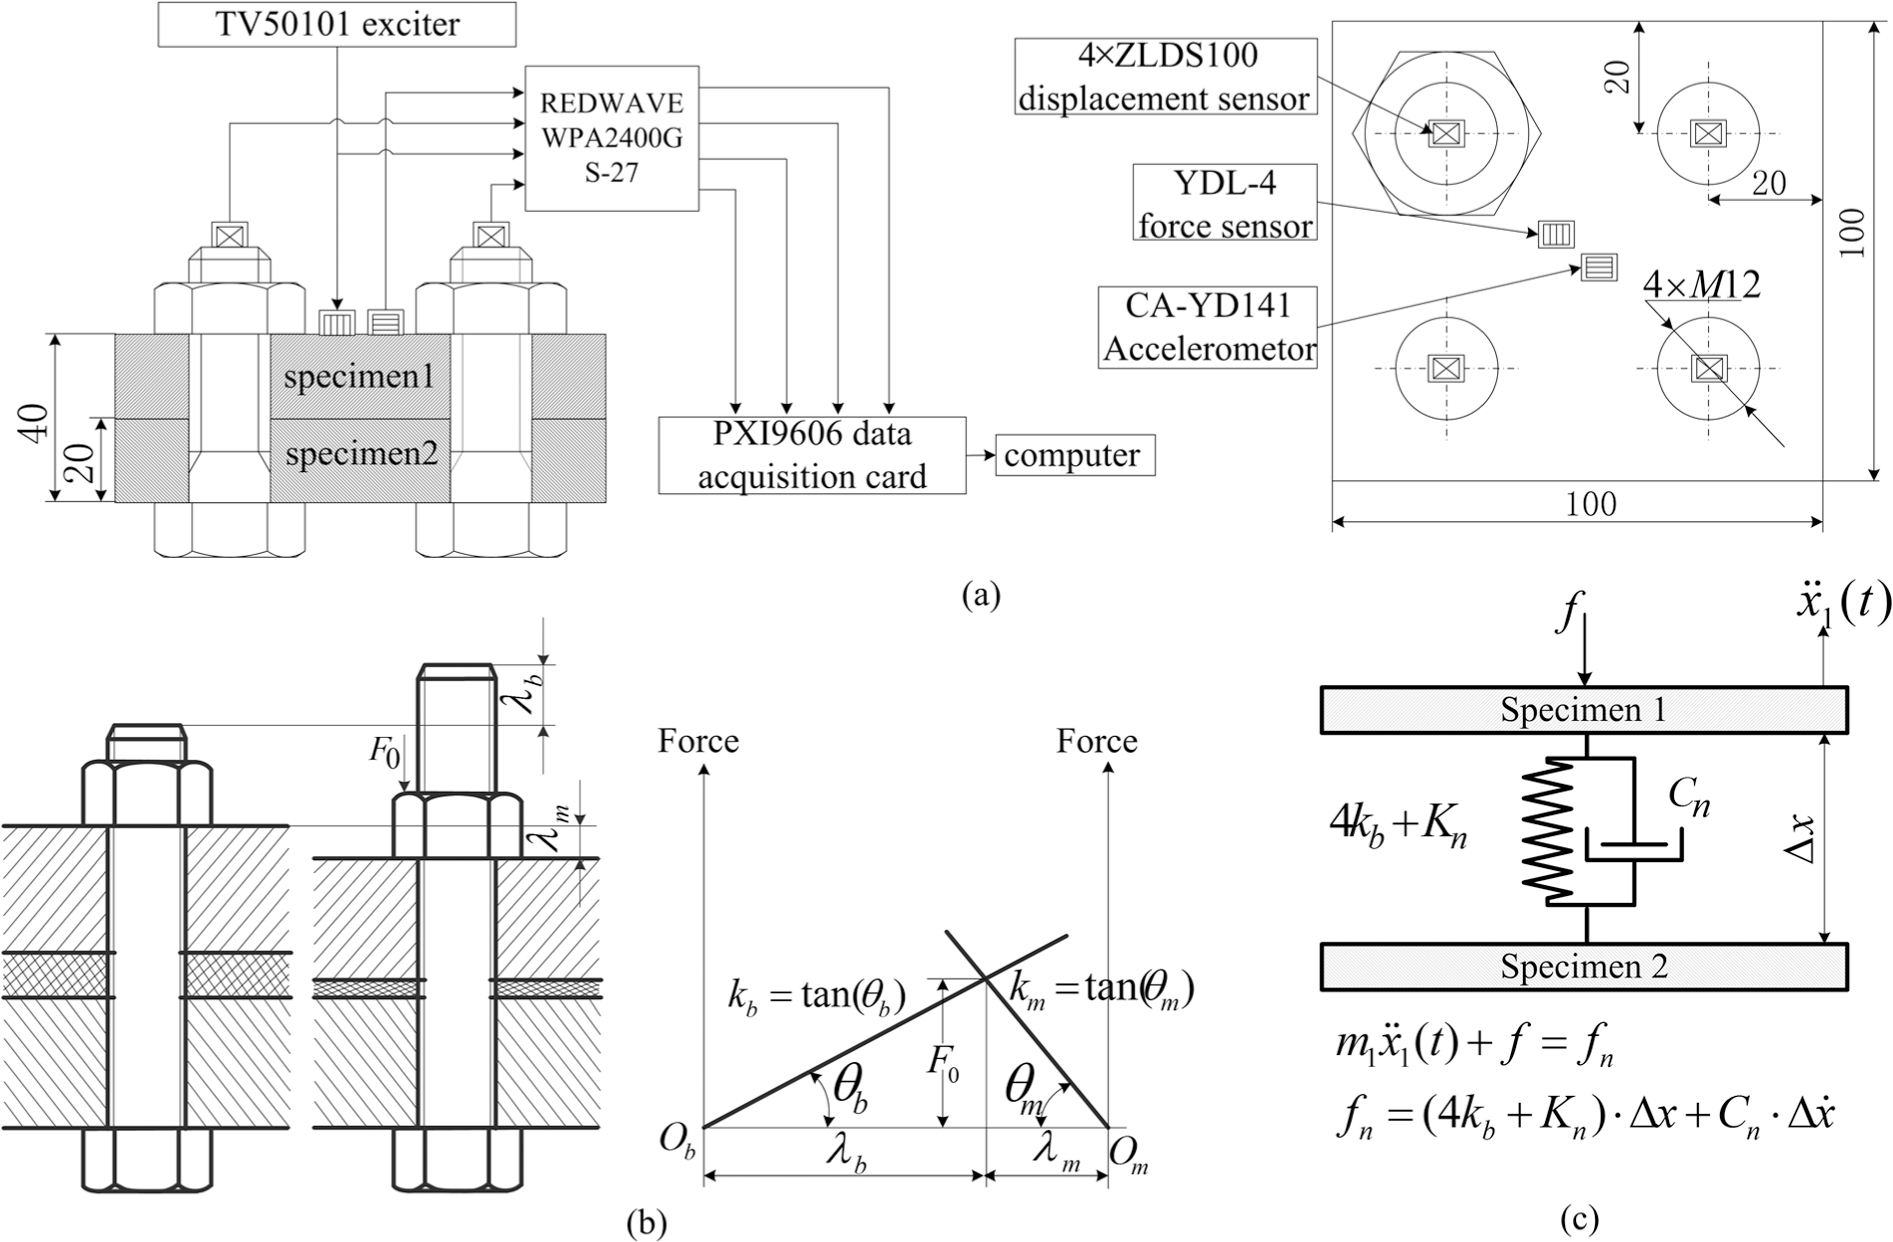
Experimental program: (a) the experiment of normal stiffness and damping, (b) the stiffness of bolt and (c) the model of stiffness and damping of joint surface.
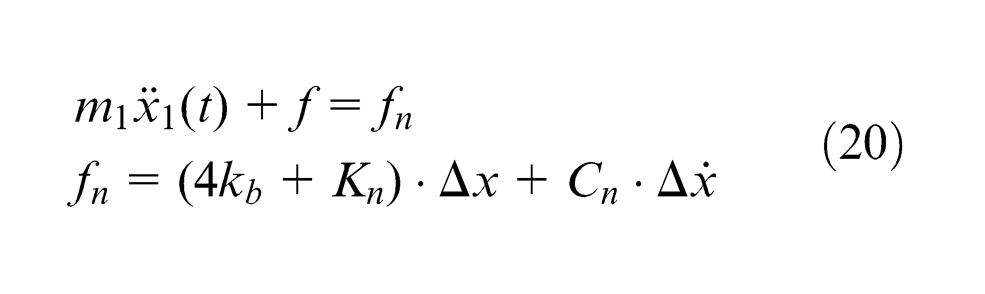
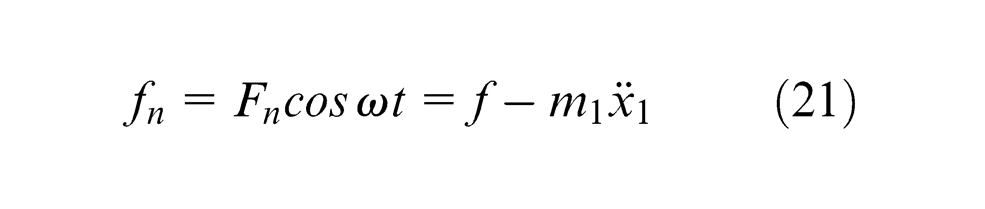
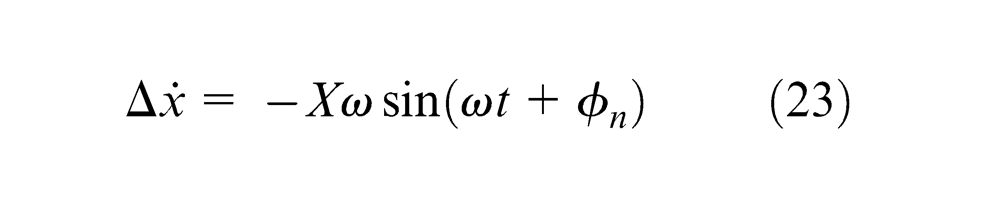
In the experiment, the specimens are excited by a harmonic signal. The dynamic load on the joint surface can be obtained by measuring the acceleration signal from specimen 1
The average linear displacement of the bolts (the average relative linear displacement of the joint surface) is defined as
The average linear velocity of the bolts (the average relative linear velocity of the joint surface) is defined as
According to the principles established for this experiment
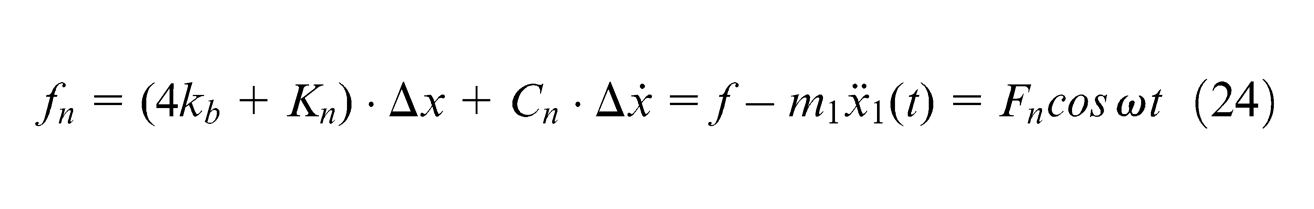
and
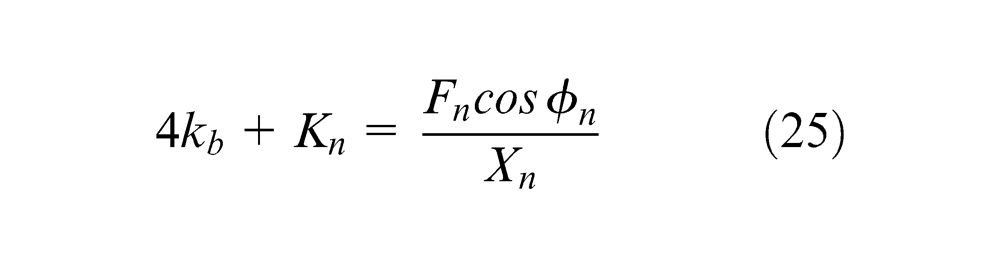
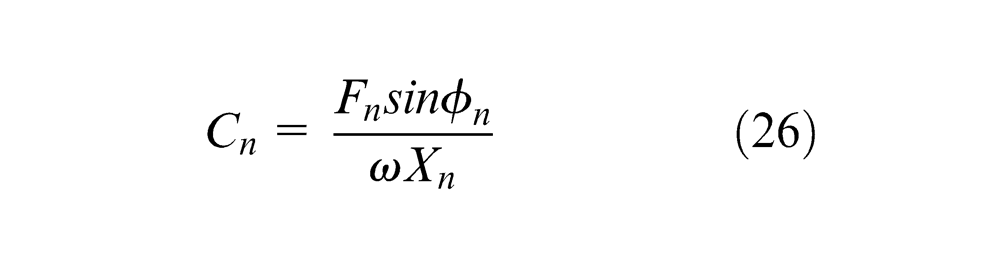
Therefore, the contact stiffness and damping per unit area are
Preparations for experiment
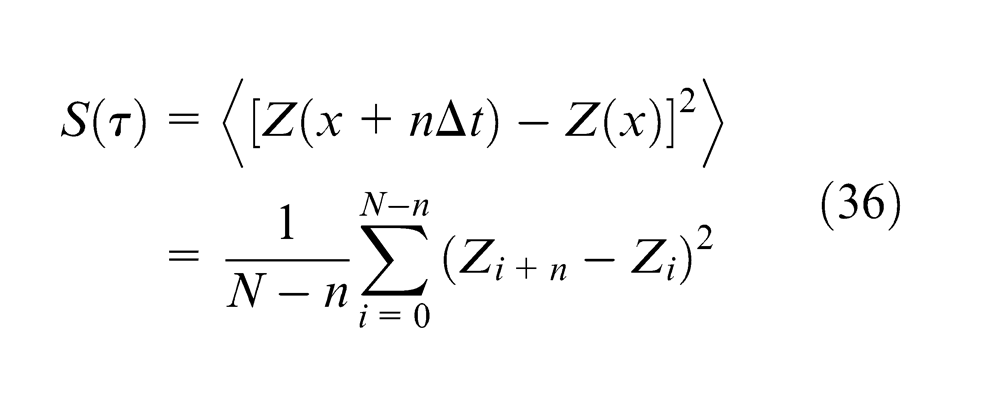
Before performing experiments, the specimens of different roughnesses should be milled and measured. Then, we should calculate the fractal parameters of specimen interfaces and choose the specified specimens as experimental objects. We applied the structure function method to calculate the fractal dimension D and fractal roughness G of surface profiles. The W-M function 36 is continuous and non-differentiable everywhere and takes on a statistical self-affinity, which can be used to simulate the rough surface morphology as follows37,38
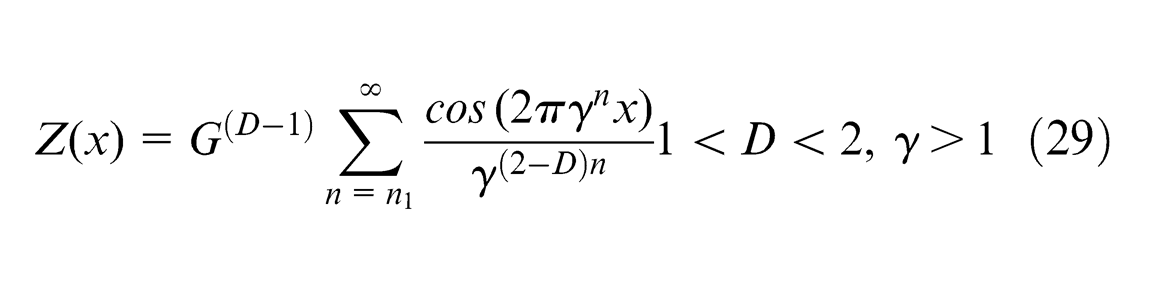
where
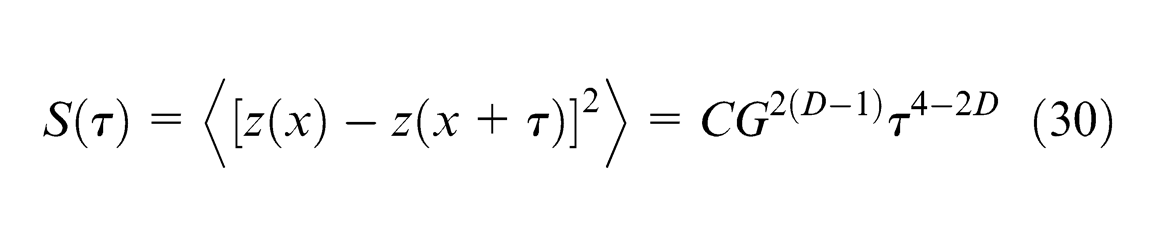
where
The plot of
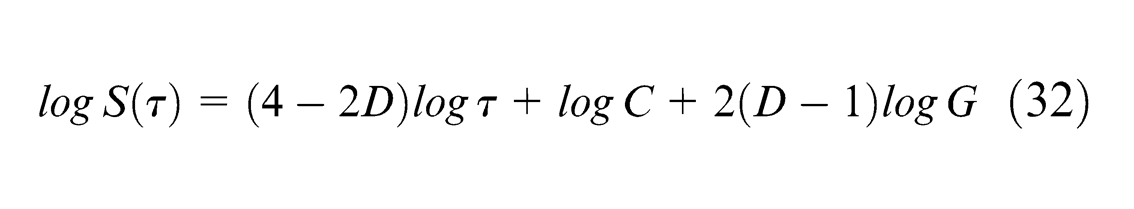
Therefore, the fractal parameters D and G can be obtained from the structure function graph of the surfaces. It is seen from equation (32) that the fractal dimension D can reflect the slope of the straight line and fractal roughness G can determine the intercept of the straight line 39
The analogue signals of specimen contour
Set
Plot the double logarithmic graphs of structure function of specimen interface and measure the slope and intercept of the straight line, then we can obtain the fractal dimension D and fractal roughness G of contact surfaces.
Results
Theoretical calculations
Series fractal contact model calculations
The contact stiffness of the M-B fractal model with D and G change is as shown in Figure 6. When a single-fractal surface considering the series structure of asperities with base and a rigid smooth plane are in contact (see section ‘Series fractal contact model’), the contact stiffness and damping curves determined from D and G change, are shown in Figures 7 and 8. The parameters of the contact bodies are listed in Table 2.
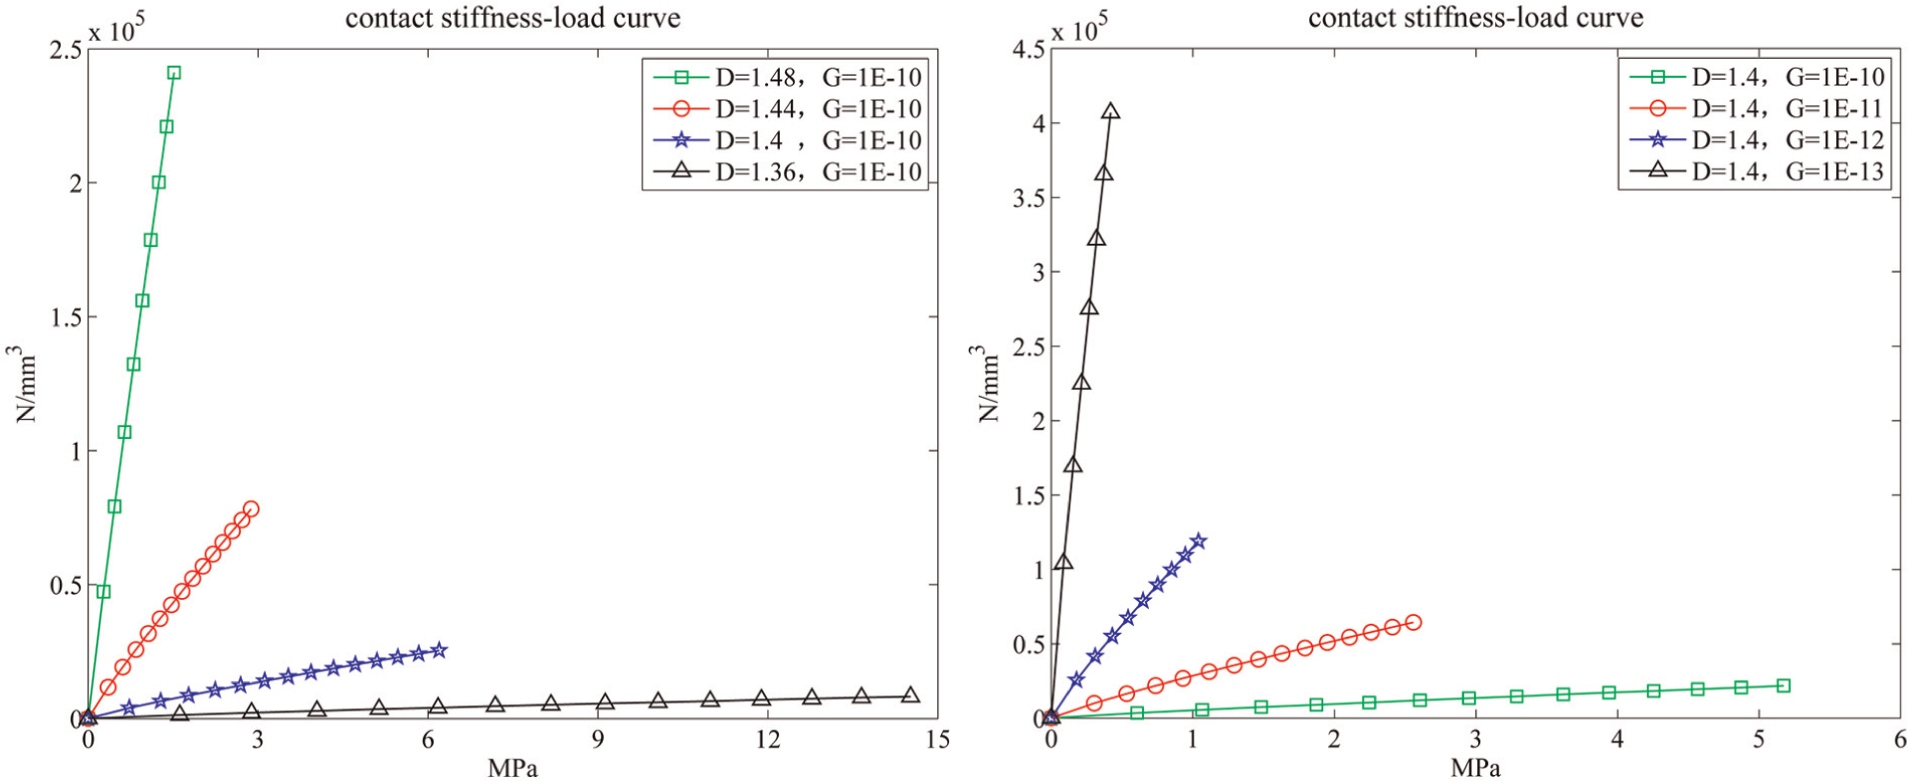
Change of contact stiffness of the fractal model with D and G.
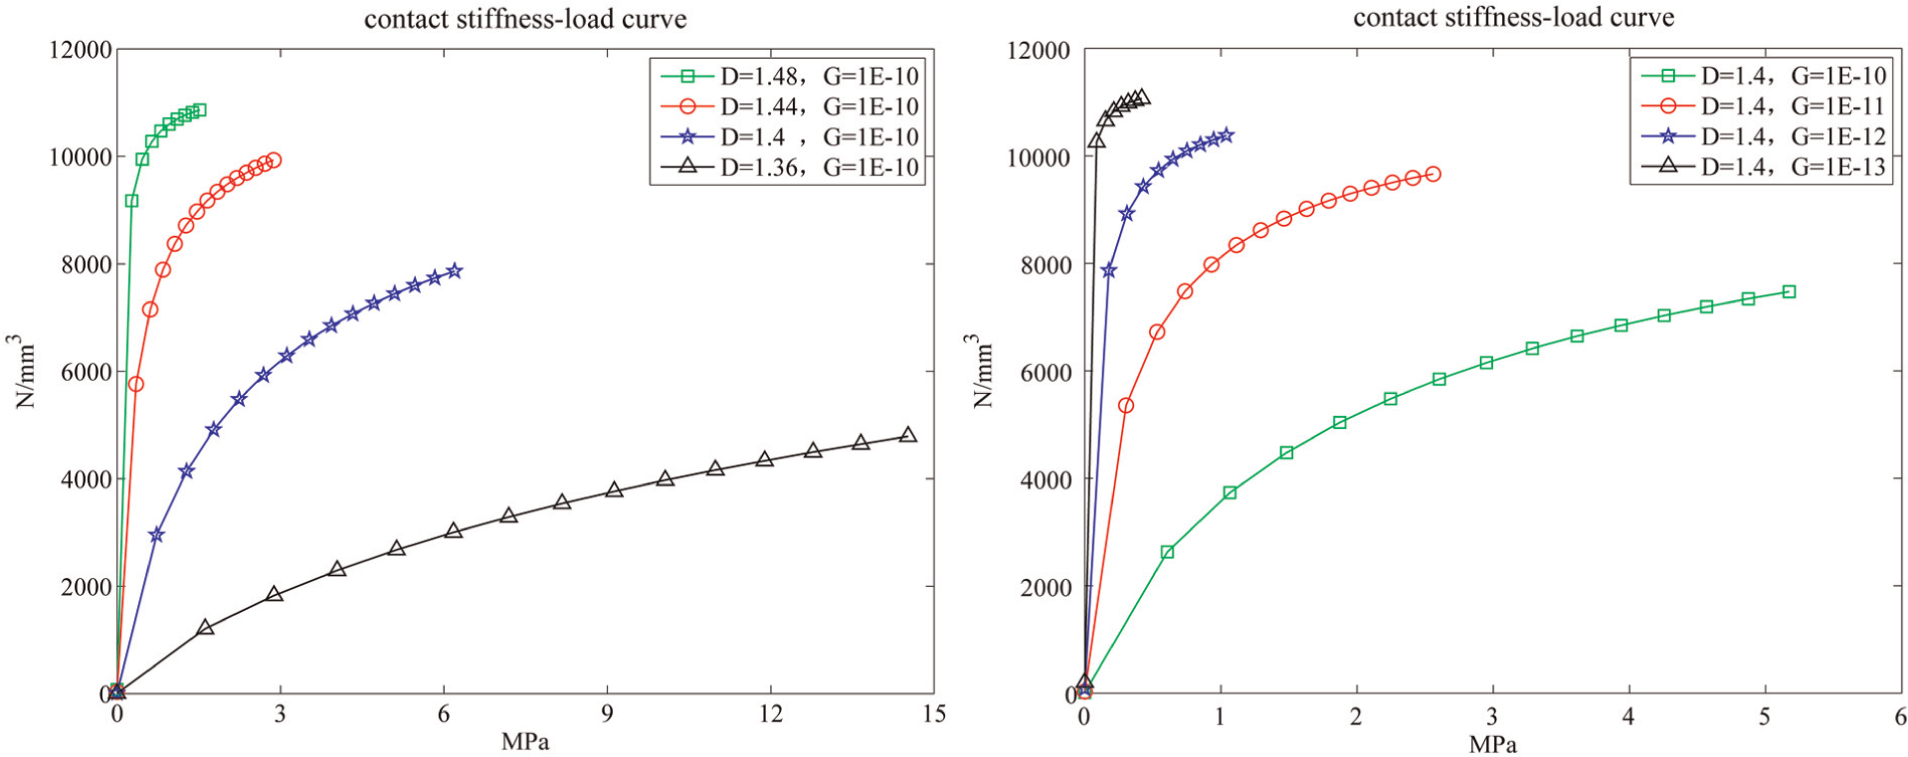
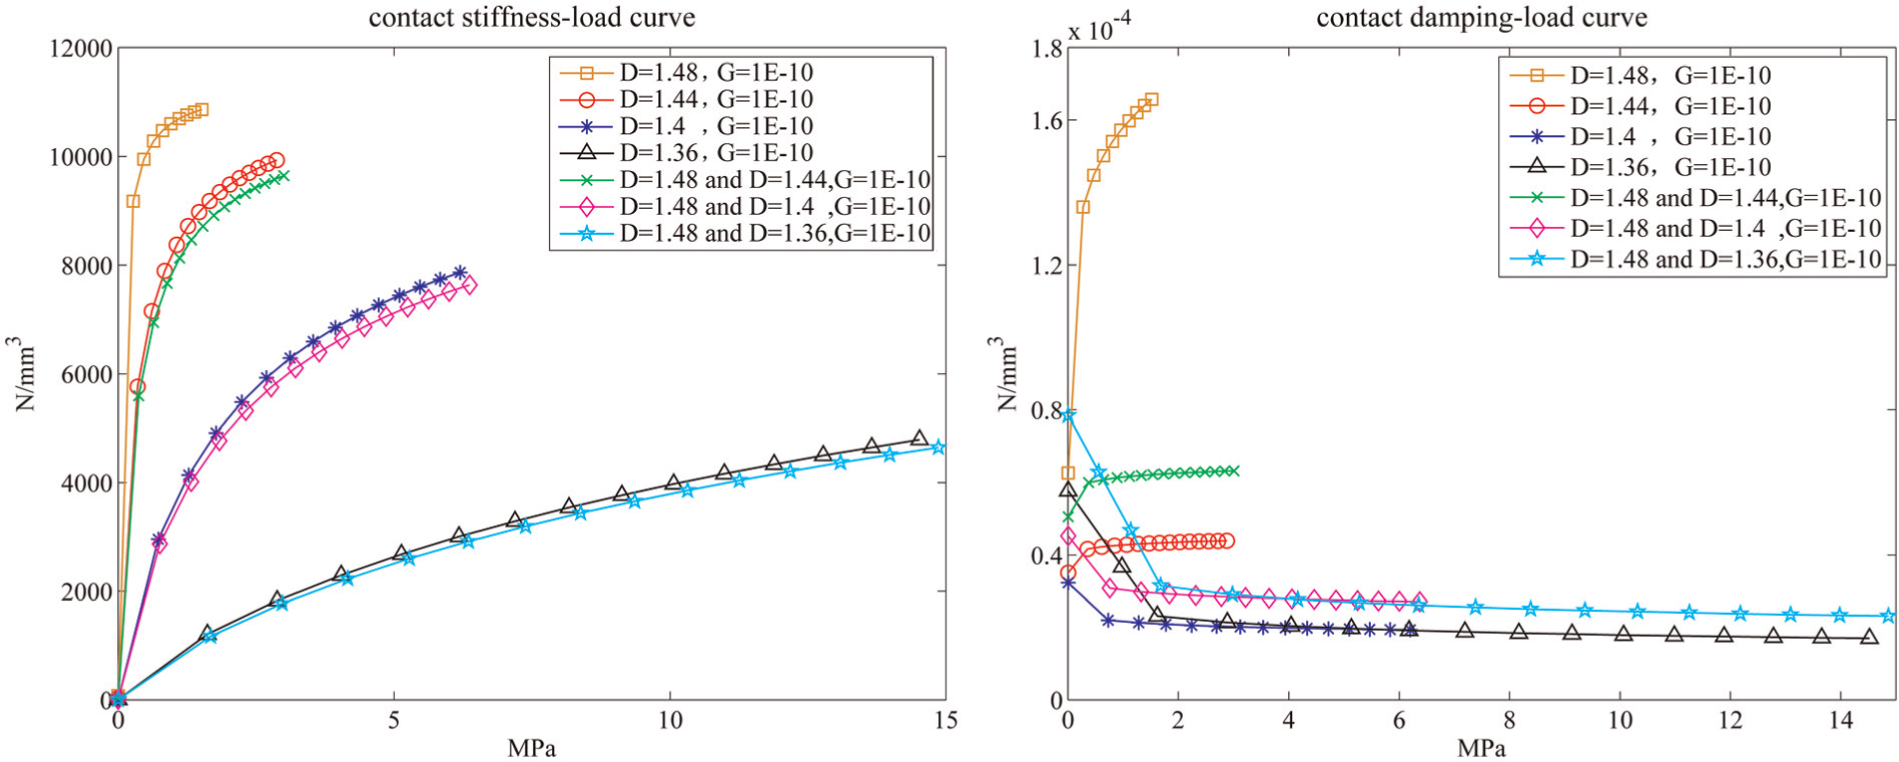
Change of contact stiffness of the series fractal model with D and G.
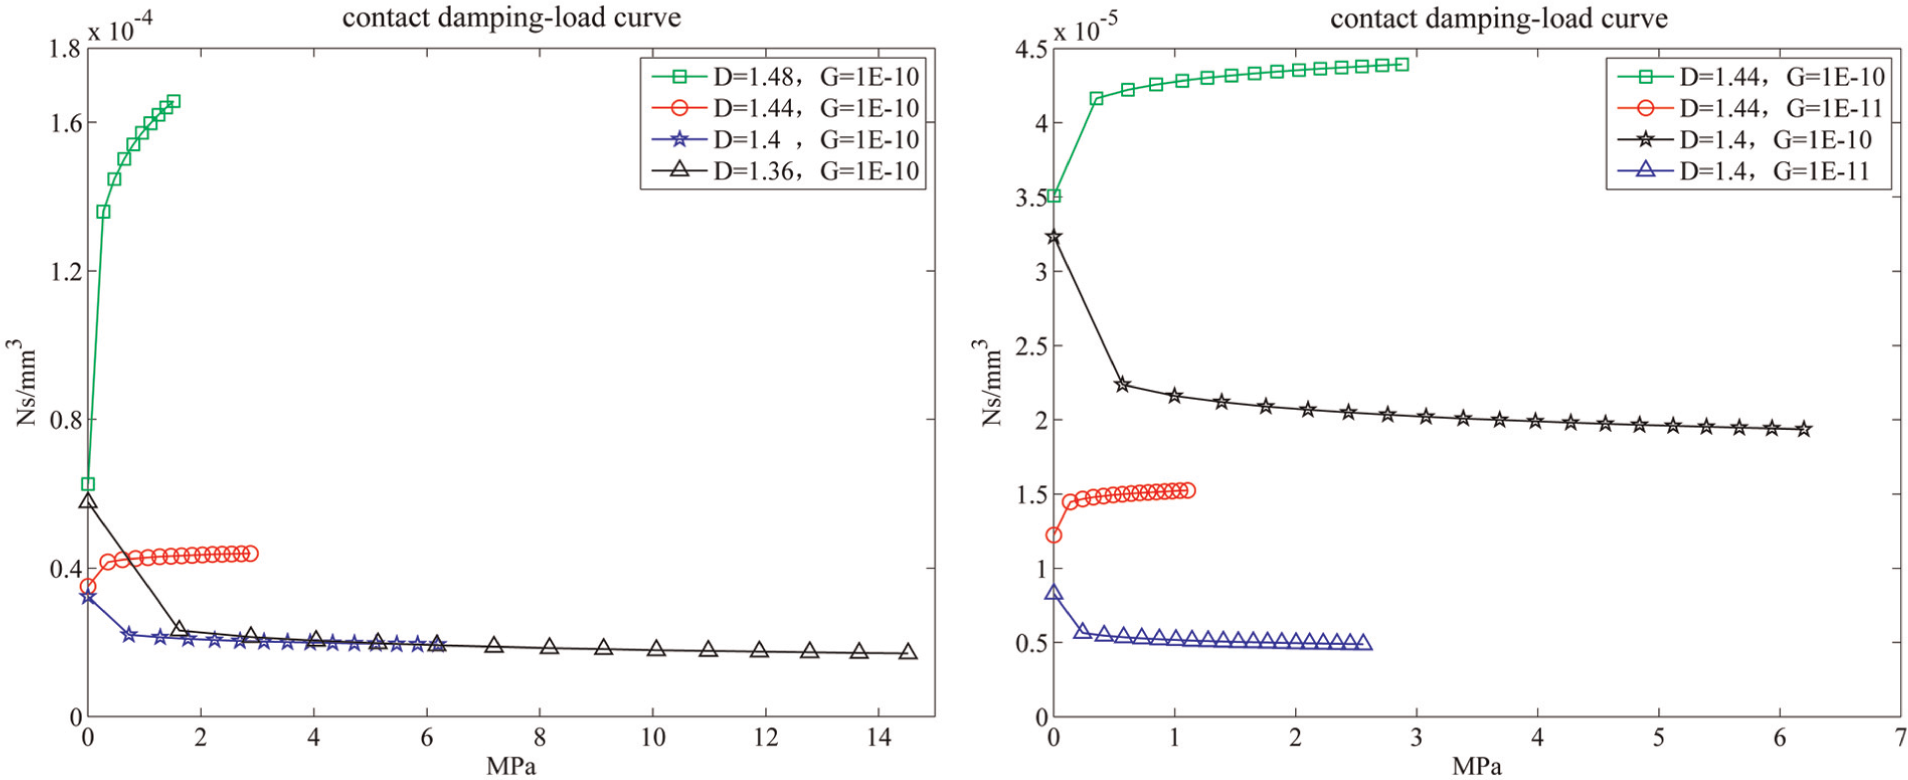
Change of contact damping of the series fractal model with D and G.
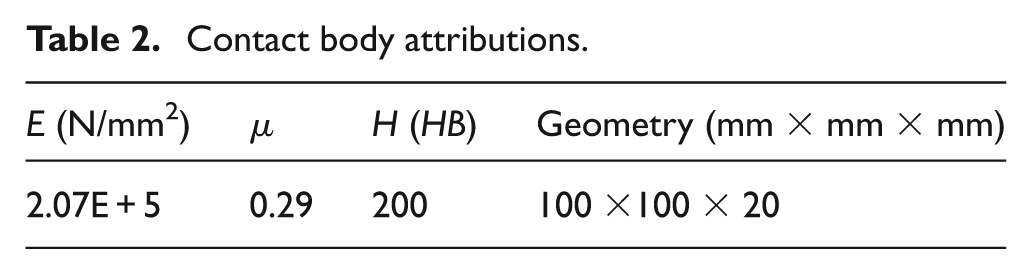
Contact body attributions.
For Figure 6, the contact stiffness is linearly increased as the load increases all along, and the greater the value of D is and the smaller the value of G is, the larger the contact stiffness is. For Figures 7 and 8, the contact stiffness increases non-linearly as the load increases and the increase is initially quick and then slows down and stabilises. The load becomes smaller and the contact stiffness stabilises quicker for larger values of D and lower values of G. The contact damping changes non-linearly with increasing load. The fractal dimension value D = 1.42 is a critical value. When D > 1.42, the contact damping increases with the load, and the contact damping increases more significantly for greater values of D. When D < 1.42, the contact damping decreases as the load increases, and the contact damping decreases more slowly for smaller values of D. As the value of G decreases, the contact damping value decreases.
Bi-fractal contact model calculations
The curves for the normal contact stiffness and damping for a bi-fractal rough plane contact as a function of D and G are shown in Figure 9 (see section ‘Bi-fractal contact model’). The parameters of the contact bodies are listed in Table 2. Two single-fractal rough plane contacts can be simplified to a contact between bi-fractal rough surface and a rigid plane, which can be calculated using the M-B single-fractal model when the value of D is the same. When the values of D for two single-fractal surfaces are different, four cases arise according to the bi-fractal theory.
Normal contact stiffness and damping of the bi-fractal model.
For Cases B and D:
Bi-fractal model simplification.
Surface fractal contact calculations
The variation curve of the normal contact stiffness and damping of rough cylinders in contact with the change in the curvature radius is shown in Figure 12 (see section ‘Surface fractal contact model’). The parameters of the contact bodies are listed in Table 2. The stiffness–load curve of the rough plane contact, rough cylindrical outer contact, and rough cylindrical inner contact is shown and compared.
Experimental test
Four bolts (M12) increase the pressure at 0.5-MPa intervals through different preloads, and every time, the bolts’ preloaded length has to be the same by controlling the torque. The contact stiffness and damping of the joint surface were measured at different pressures, and the theoretical and experimental values are compared in Table 3 and Figures 12 and 13.
Comparison of the experimental and theoretical results.
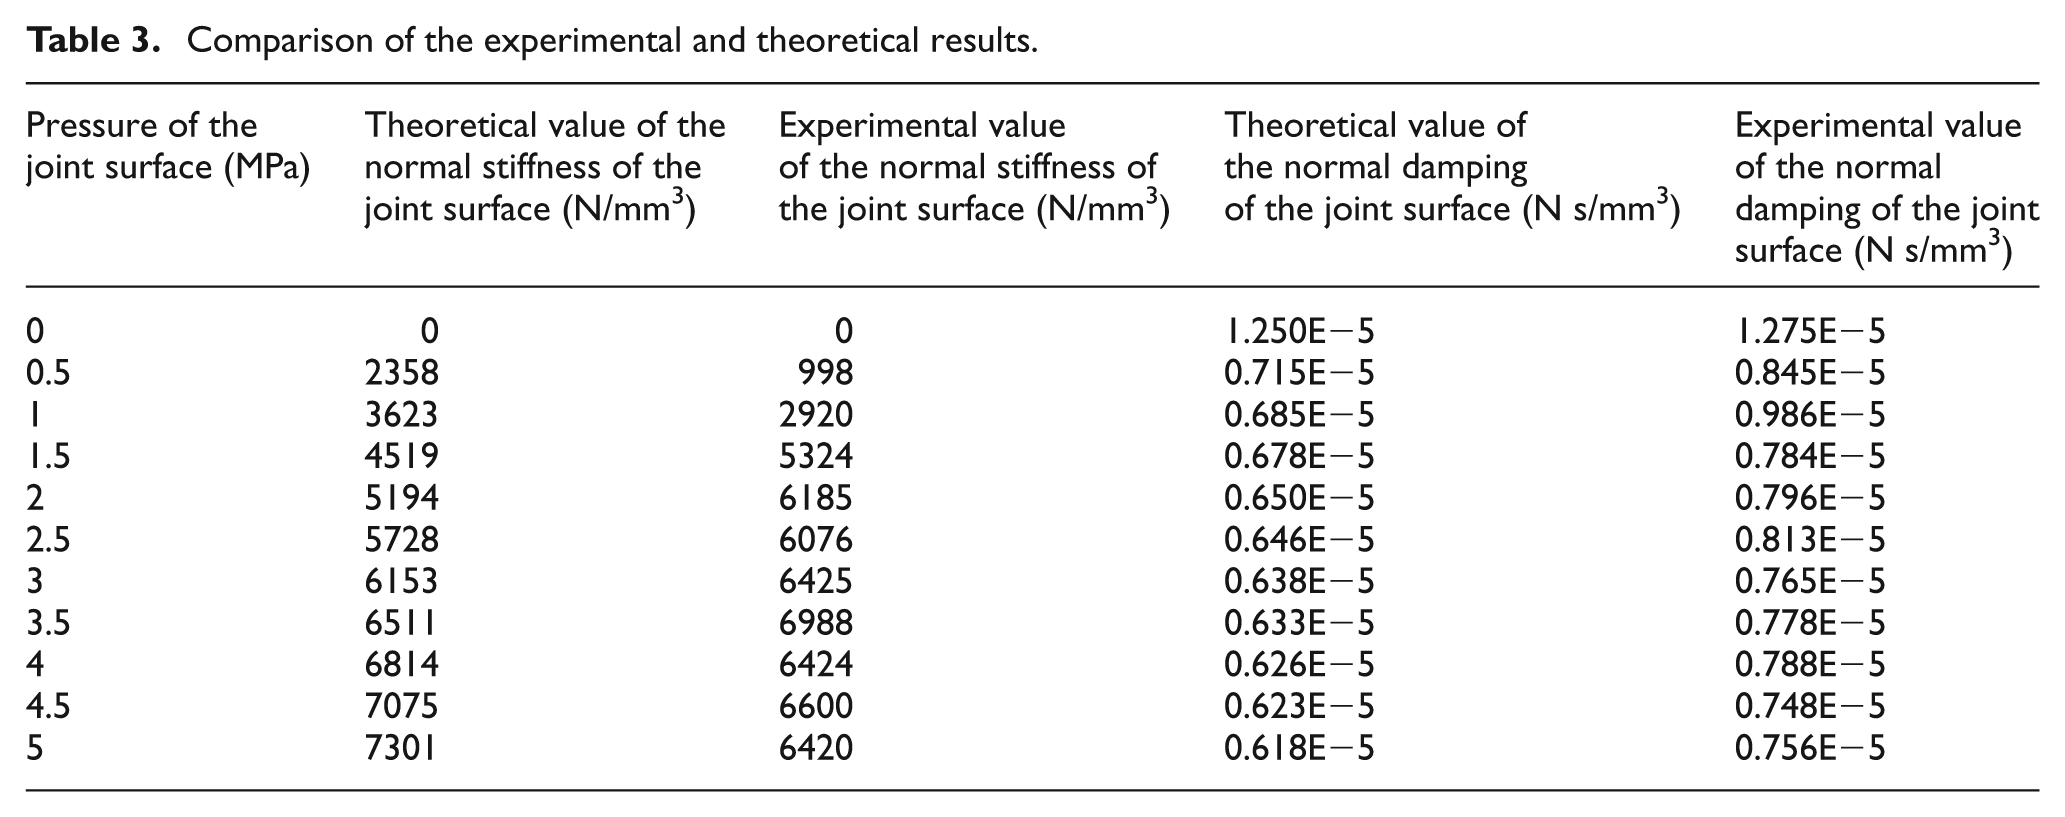
The theoretical and experimental values obtained for the stiffness and damping between the two rough and milled planes are compared in Figure 12. The parameters of the contact bodies are listed in Table 2. The experimental contact stiffness increases with the load increase and remains unchanged after a certain load is reached, which is all along fluctuated around the theoretical values. The experimental results for the contact damping decrease as the load increases; the increase is initially quick and then slows down and stabilises. The experimental results are always greater than the theoretical results.
The variations and the comparison curve of the contact stiffness and damping are shown in Figure 13 by measuring a milled rough plane (D = 1.58) and comparing these values with three other milled, contacting, rough planes (D = 1.35, 1.41, and 1.44). The parameters of the contact bodies are listed in Table 2. The contact stiffness increases with the load. The contact stiffness will be lower with rougher surfaces, and the load will change slightly as the contact damping increases or decreases. The experimental and theoretical trends are the same, but there are numerical differences, which can be used to predict the trend in machine dynamics.
Discussion
Effects of D and G on the stiffness and damping of series fractal model
For Figure 6, the contact stiffness of the M-B fractal model is non-linearly increased all along as the load increases, and the greater the value of D is and the smaller the value of G is, the larger the contact stiffness is. The contact stiffness and the real contact area are subjected to the index relationship
For Figures 7 and 8, the contact stiffness of series fractal model increases non-linearly as the load increases; the increase is initially quick and then slows down and stabilises. The joint surface is formed by stacking the asperities on the base. As the load increases, both the number of asperities in contact and the area of the asperities increase simultaneously. If every asperity is considered to be a spring, the joint surface can be considered a parallel structure of springs. As the number of springs in the parallel and single spring stiffness increases, the contact stiffness at the joint surface increases non-linearly with increasing load. At first, the number and area of the asperities involved at the joint contact increase rapidly. As the load continues to increase, the rate of the increase in the number of asperities and the total asperity area slows down such that the contact stiffness becomes more rigid and then slows down. When the load continues to increase, the number of asperities in contact begins to decrease, whereas the asperity contact area continues to increase. When equilibrium is established, the contact stiffness stabilises and the actual contact area is nearly equal to the nominal contact area. The joint surface is pressed flat, and the contact stiffness is approximately equivalent to the tensile stiffness of the base.
A greater value of D and a smaller value of G lead to a smaller load and smaller contact stiffness stabilisation time. A greater value of D and a smaller value of G lead to better consistency in the height and area of the asperities. As the load increases, the number of asperities in contact at the same time causes rapid deformation due to the height consistency, which results in an actual contact area reaches the nominal contact area soon after and the joint surface is pressed flat. In this case, the contact stiffness stabilises very quickly and the large number of small asperities can withstand only a small load before deforming.
When D > 1.42, the contact damping increases with the load, and the contact damping increases more quickly for greater values of D. When D < 1.42, the contact damping decreases with the load, and the contact damping decreases more slowly for lower values of D. The contact damping
Comparison of single-fractal model and bi-fractal model
For Figures 9 and 10, the contact stiffness–load curve of bi-fractal model is smaller than any one of the two single-fractal models and is closer to the contact stiffness–load curve of single-fractal model with a smaller value of D. The two single-fractal surface contacts are regarded as two springs in series, and the composite stiffness of the two springs in series is smaller than any one of the two spring stiffnesses. Two rough surface contacts can be simplified as a rough surface contacting with a rigid plane, similar to the G-W and M-B fractal models. The joint surface of the smoother contact (the larger D) is seen as a rigid smooth plane, and the joint surface of the rougher contact (the smaller D) is regarded as an equivalent rough surface; thus, the curve behaves similarly to a joint contact with a smaller D value.
The contact damping–load curve of bi-fractal model is located in the middle of the curves for the two single-fractal models and is closer to the contact damping–load curve with a smaller D value. The damping is a parameter that measures energy consumption. When two single-fractal surfaces come into contact, the energy consumption should be a weighted average so that the damping curve is located between the two single-fractal surface curves. The damping curve is similar to that of a smaller value of D because two single-fractal surface contacts are seen as a rough surface (the smaller D) and a rigid plane (the larger D) in contact.
Effects of curvature radius on the stiffness of surface fractal model
For Figure 11, the curvature radius and contact style play an important role on the contact stiffness values of joint surfaces but have no influence on the change trend of them. We can explain as follows: According to the contact stiffness formula for Hertz theory,
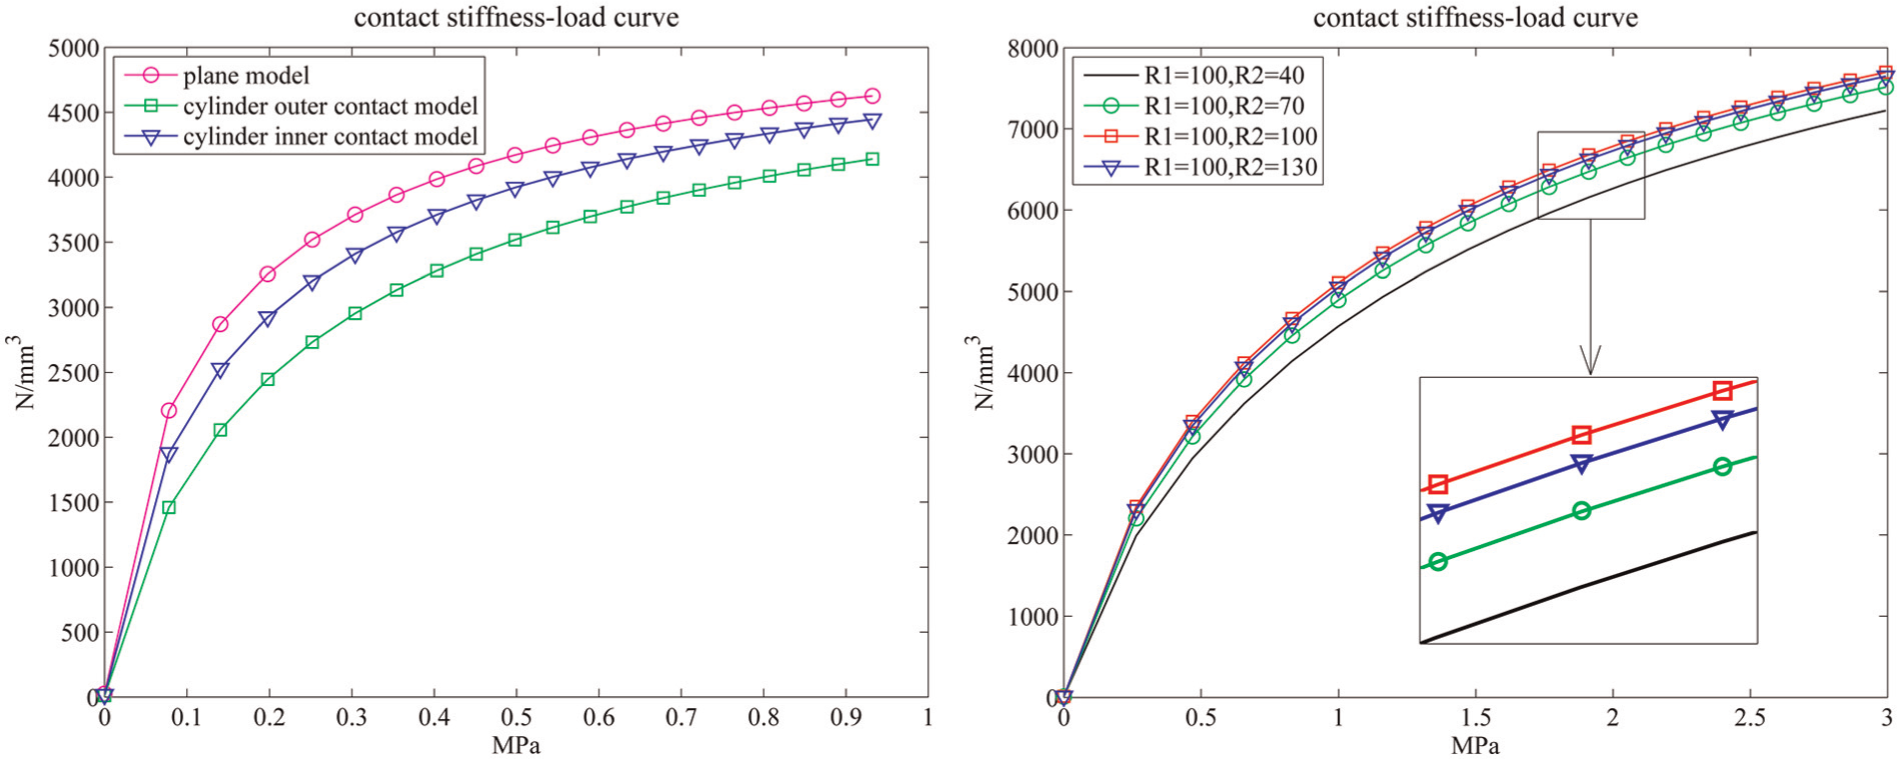
Contact stiffness of the surface fractal model.
If
Comparison of theoretical calculation and experimental test
For Figure 12(a), the main differences between the experiment curve and theoretical curve of stiffness–load are the slope of them. The slope of theoretical curve has been reduced until zero, while one of the experimental curves first increases and then decreases to zero finally. The experimental curve has experienced a process of less than, greater than, and less than the theoretical curve. The height of asperities at interface is commonly subject to the Gauss distribution. In the beginning, the number of asperities in contact and the single asperity area are relatively small, and most of asperities are deformed plastically, so the actual contact stiffness is less than the theoretical values. With increasing load, the number of asperities in contact and asperity area rapidly increase simultaneously, which results in the actual contact stiffness and rate of stiffness change exceed the theoretical values. When a certain load is reached, the number of asperities in contact begins to reduce, while the asperity area still continues to increase. When equilibrium is established, the contact stiffness keeps stable. In addition, due to the stress hardening of asperities, the actual contact stiffness is less than the theoretical contact stiffness.
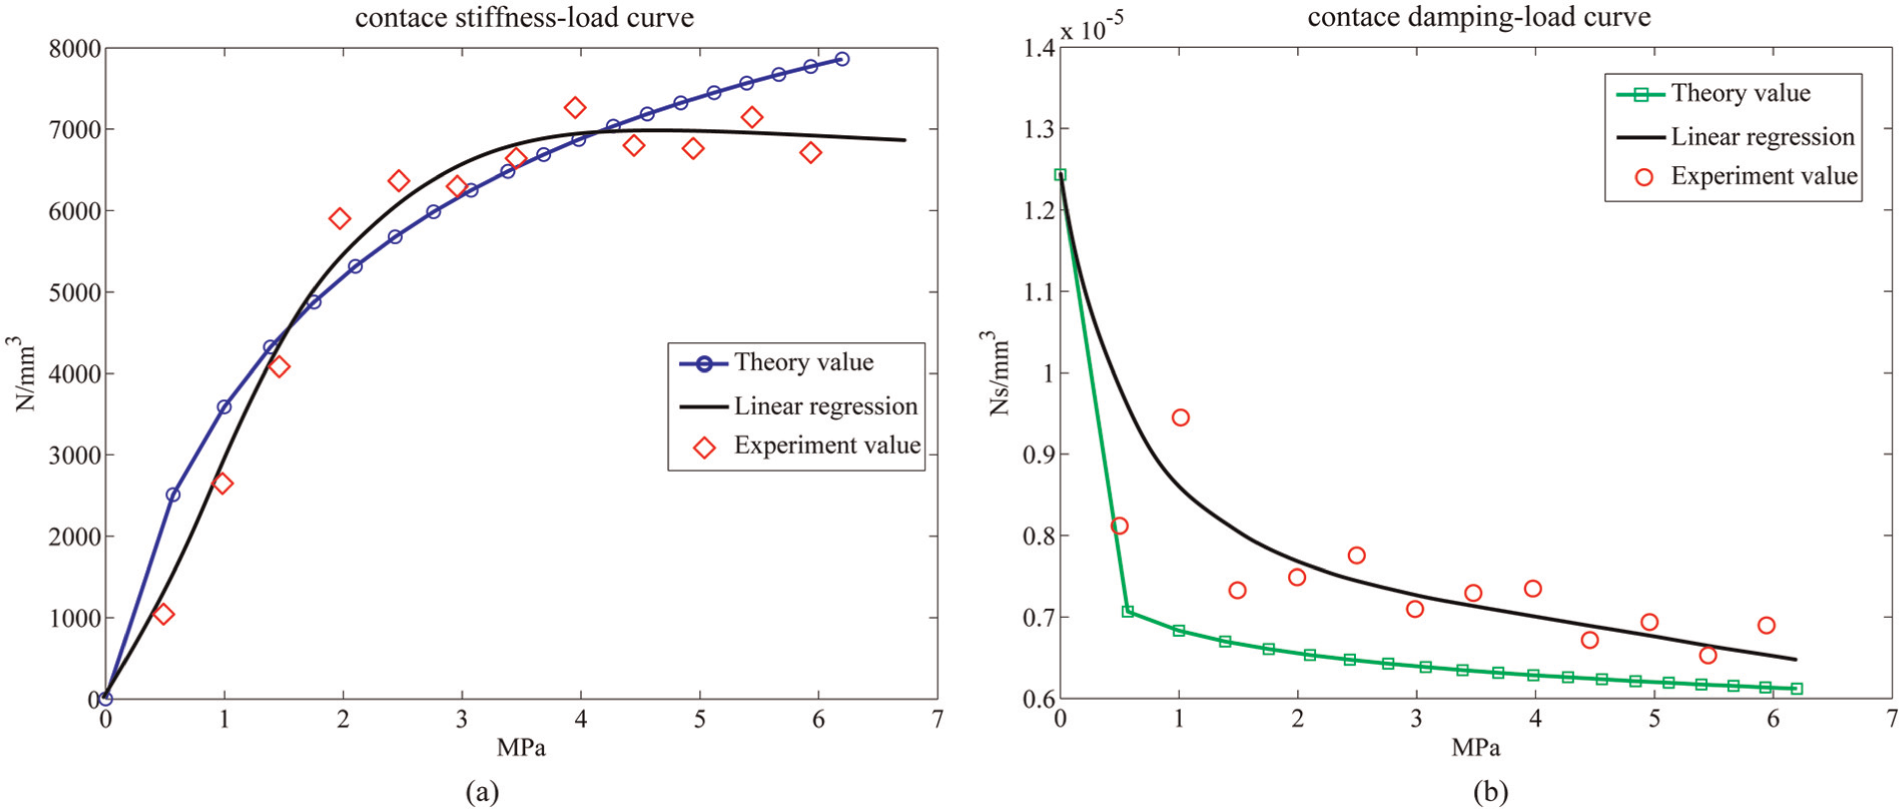
For Figure 12(b), the shape and trend of the theoretical curve and the experimental curve about damping–load is basically accordant, and the experimental curve is overall greater than the theoretical curve. The main reason is that the energy loss of plastic deformation in theoretical calculation is only considered without involving the else energy loss due to contact creep and friction.
For Figure 13, the experimental curve of stiffness–load is similar to the theoretical curve, while the damping–load trend is not clear when the load is small. Mainly because the number of asperities in contact is small at present and not only exist plastic deformation and elastic deformation, but also a variety of forms of energy loss, it is unable to determine the dominant form of the damping.
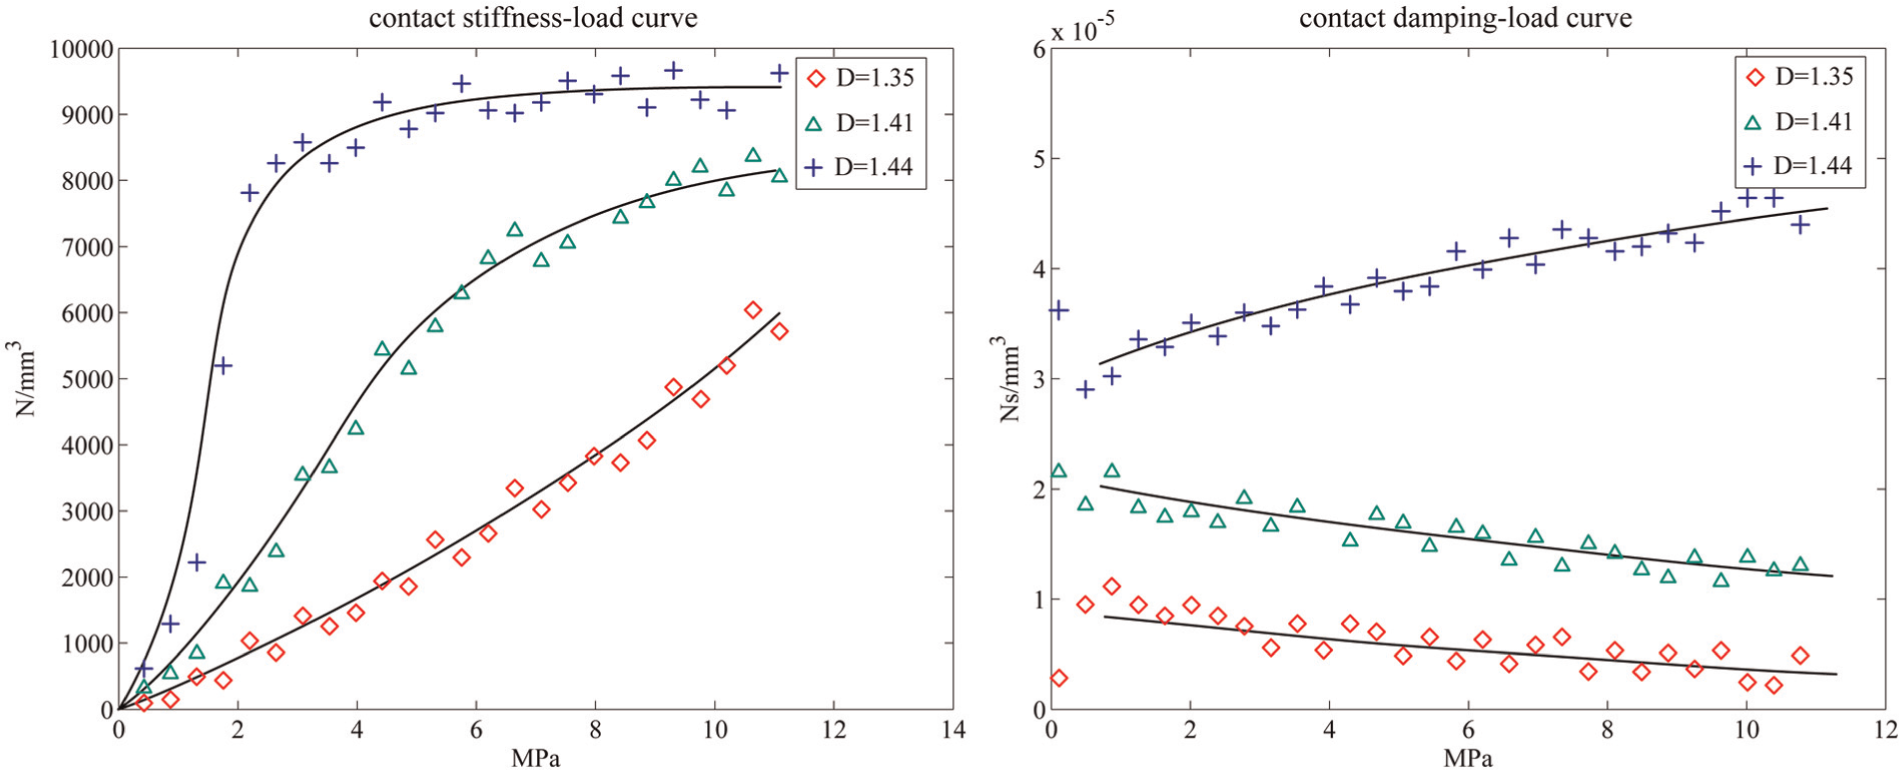
The measured results of stiffness and damping with different Ds.
Limitations
The limitations of the presented model need to also be mentioned: (1) The non-normalised formulas will only guarantee the consistency with the trends without stable results. (2) The mechanism for the increase or decrease of damping with load has not been clear. The critical value of D determined the increase or decrease has not been given strictly. (3) The accurate relationship between roughness and fractal parameters has not been presented rigorously. (4) The interfaces in contact joint by bolt have been viewed as experimental object to verify the presented model without involving other typical joint structure, such as gear transmission and bearing support.
Conclusion
This article summarises the characteristics and limitations of the Hertz, G-W, and M-B contact models and proposes the three improvements based on the M-B model. The conclusions can be summed up as follows:
The contact stiffness of the M-B fractal model increases non-linearly all along without stable value, while the contact stiffness of series fractal model increases non-linearly with the load, and the increase is initially quick and then slows down and stabilises. D = 1.42 is as an estimated critical value which determined the contact damping increase or decrease with load.
The contact stiffness–load curve of bi-fractal model is smaller than any one of the two single-fractal models and is closer to the contact stiffness–load curve of single-fractal model with a smaller value of D. The contact damping–load curve of bi-fractal model is located in the middle of the curves of the two single-fractal models and is closer to the contact damping–load curve with a smaller D value.
The curvature radius and contact style play an important role on the contact stiffness values of joint surfaces but have no influence on the change trend of them.
The theoretical calculations have been verified by the experimental test. The improved theoretical model can match the experimental measured data well.
Footnotes
Appendix 1
Declaration of conflicting interests
The authors declare that there is no conflict of interest.
Funding
This work was supported by Department Pre-Research Fund of China, project number 9140A18010312KG 0101.