
Abstract
To achieve a better energy-efficient and comfortable vehicle driving, electric vehicle energy predictive optimal control was discussed in this article. It used Vehicle to Infrastructure (V2I) communication of traffic light distance and time gap to make velocity decision in order to improve whole driving performance. Based on the data of standard New European Driving Cycle, this article put forward a real-time cycle including traffic light position and time information at first. Then, a preview and optimal decision controller was built. Four evaluating indexes were set for optimal decision making to decide the optimal expected speed, according to the pass time that the forward traffic lights allowed and the distance or the forward vehicle speed and distance. After that AMESim and Simulink co-simulation platform was used to build the vehicle dynamics model and to exploit the control algorithm. The simulation results indicated that vehicle with V2I can effectively improve the operating condition of the whole vehicle and reduce the frequency of vehicle starting and stopping, which makes the vehicle driving smoother and steady. Moreover, it can reduce vehicle energy consumption and improve endurance mileage. Meanwhile, the vehicle acceleration and jerk have decreased dramatically with better comfortable performance.
Keywords
Introduction
V2I is the communication between vehicle and infrastructure (such as traffic lights). V2I information used in this article is the position and time gap of traffic lights. At present, the driver can obtain road information only through visual traffic signs, which not only increases the driving burden but also causes traffic accidents as the driver needs to take action in a short time when encountering potential danger. Vehicle with V2I uses the wireless local area network communication technology, and by this method, the road speed limit and signal lights can be transmitted to the vehicle controller and traffic management center. Vehicle controller can assist the driver in carrying out auxiliary driving. It not only can improve the safety of driving but also through the path planning, it could reduce energy consumption and improve operational efficiency.1,2
With the traffic information applied to vehicle optimization system, the vehicle can plan trajectory and gear optimization through traffic information combined with vehicle dynamic and economic performance decision.3,4 Literature5–7 through road signs, signals and information of traffic flow, the vehicle trajectory were optimized under city driving cycle. The results indicated that the road and traffic information had influenced the vehicle trajectory greatly.8,9 In Boehme et al., 10 researchers have proposed that the battery power status can be predicted in the whole journey through GPS and geographic information systems (GIS) information through the pre-decision optimal strategy to realize the highest charging efficiency and the lowest noise of the whole process. Real road testing shows that fuel consumption was reduced by more than 4%. The traffic condition prediction model and the real-time simplified control method are combined in literature; 5 simulation and experimental results show that the fuel economy can be improved by 10% and the corresponding NOx and particulate emissions can be reduced. The literature 4 proposed driving optimization based on three aspects: (1) vehicle driving optimization without consideration of the road traffic information, (2) vehicle driving optimization considering the road traffic information, and (3) driving optimization based on V2V and V2I communications.
Eco-driving method of conventional vehicle was studied. 11 Literature 12 put forward traffic light information to adaptive cruise control system, so the idle time was reduced, and therefore, there is a decrease in fuel consumption. An eco-driving was studied in Sakhdari et al. 13 presents an ecological ACC system that takes advantage of a radar and traffic light-to-vehicle communications to predict the future trajectory and employs this information to drive the vehicle with an ecological driving pattern. Literature 14 develops a framework to enhance vehicle fuel consumption efficiency while approaching a signalized intersection through the provision of signal phase and timing information that may be available through vehicle-to-infrastructure communication. The green light optimal speed advisory (GLOSA) 15 can help vehicles running in a stable cruise speed to decrease additional acceleration. Literature 16 provided an eco-driving method to calculate optimal velocity in city traffic condition by using V2I information of traffic lights timings.
In the end of 2016, Audi officially announced in Las Vegas that using the vehicle infrastructure interconnection system (V2I), Audi models in Las Vegas can be interconnected with traffic facilities. In the first stage, the vehicle is only associated with the local traffic lights. V2I system through the 4G communication and traffic light information interconnection displays traffic lights and other information in the car dashboard or head up display system. After the large-scale applications of the system, vehicles can be connected with the surrounding vehicles. For example, before the vehicle rear collision, the system will inform the vehicle deceleration or stop in advance. GM is also developing similar systems.
Pure electric vehicle (PEV) is considered to be the future trend of automobile development because of its zero emission characteristics and low energy consumption rate. Many countries, and almost every automobile company, are conducting research and developments into electric power train systems. Recently, it is difficult to realize revolutionary breakthrough in battery energy density, and intelligent control of electric vehicle through the introduction of some external traffic information can reduce energy consumption and achieve safety driving. In 2009, Japan launched i-Japan 2015, 17 in which Toyota proposed intelligent highway idea of vehicle information terminal using external information to plan the best travel trajectory and realize the clean and efficient vehicle driving. The economic driving of the vehicle can be optimized by improving the vehicle trajectory and the vehicle energy management, so as to effectively reduce the energy consumption of the vehicle.
Zheng 18 presented a bus eco-driving optimal control method to calculate the optimal driving speed by considering the platform delay. The information about traffic lights timings and passengers waiting in bus stations was obtained by the V2I communication. A novel parallel hybrid electric bus velocity prediction convolutional neural networks (CNN) model using V2I information is proposed by Alrifaee et al.; 19 real-time equivalent consumption minimization strategy (ECMS) is adopted for energy optimization. By using V2V and V2I information, Zhang et al. 20 present electric vehicle control method of approaching a road segment with multiple traffic lights. An overall 29% energy consumption was reduced for an idealized case compared to “normal” human driver behavior.
There are few studies on optimal control of V2I vehicle, so electric vehicle energy predictive optimal control method was studied in this article, which uses V2I communication of traffic light distance and time gap to predict vehicle future speed, and a preview and optimal decision controller was built. Four evaluating indexes (safety index, economic index, dynamic index, and comfort index) were introduced to vehicle control unit (VCU) and then, optimal decision module calculates and decides the optimal expected velocity, according to the green duration of traffic lights and the distance to its position, or the forward vehicle speed and distance. Correction module, according to the vehicle driving and brake system characteristics, adjusts the real-time motor drive and brake pedal force, to achieve a better real-time performance. Electric vehicle energy predictive model was built and simulation results indicated that the optimal control can improve driving behavior (reduce the frequency of starting and stopping), which greatly reduces vehicle’s energy consumption and improves the whole vehicle performance.
The difference and importance of studying optimal control of V2I vehicle in this article could be divided into three points. First, there are few studies on optimal control of V2I vehicle and there is no standard test cycle, so an advanced predictive optimal control method based on new V2I cycle is studied in this article. Second, the proposed cycle is rooted in New European Driving Cycle (NEDC), which has been known as standard and realistic cycle from people’s life. Finally, after evaluating indexes (safety, economy, etc.), an optimal controller is designed based on traffic data, which is beneficial for improving vehicle performance.
Driving cycle research of V2I
New European Driving Cycle (NEDC) was known as the most objective standard cycle for energy consumption and emission test. So, in this article, traffic information extracted from NEDC could be used as a source of V2I, such as traffic light gap and time gap, and an entire NEDC cycle includes one extra-urban driving cycle (EUDC) segment and four urban driving segments (ECE) as shown in Figure 1. ECE segment could effectively reflect the actual condition in urban area (as shown in Figure 2) and EUDC segment could represent suburban condition (as shown in Figure 3). As the actual driving conditions and vehicles are different, it therefore cannot reflect the actual driving conditions and level of energy consumption. Once the expected speed is determined, the driver’s driving habits as well as the operating point of the drive system will be determined, so the possibility of vehicle driving control is limited. In the actual driving process, the driver does not know the actual running speed, except the traffic condition. The driver, according to the information of traffic lights, pedestrians, surrounding vehicles, and obstacle information, combined with their driving habits and skills, achieve optimal performance by changing the driving operation.
NEDC cycle.

ECE segment of NEDC.
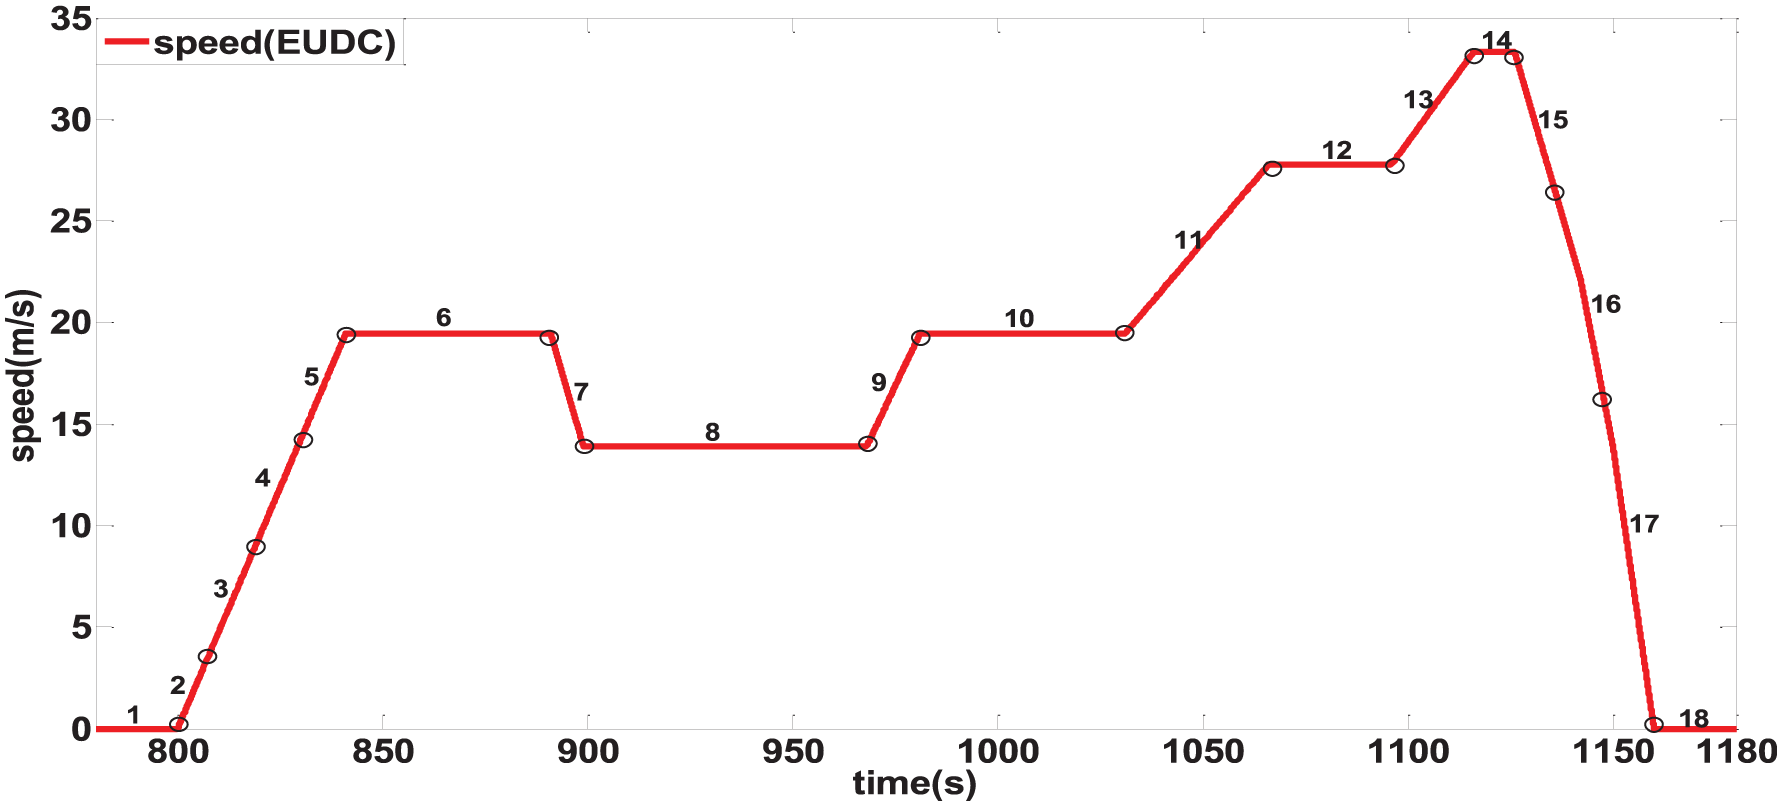
EUDC segment of NEDC.
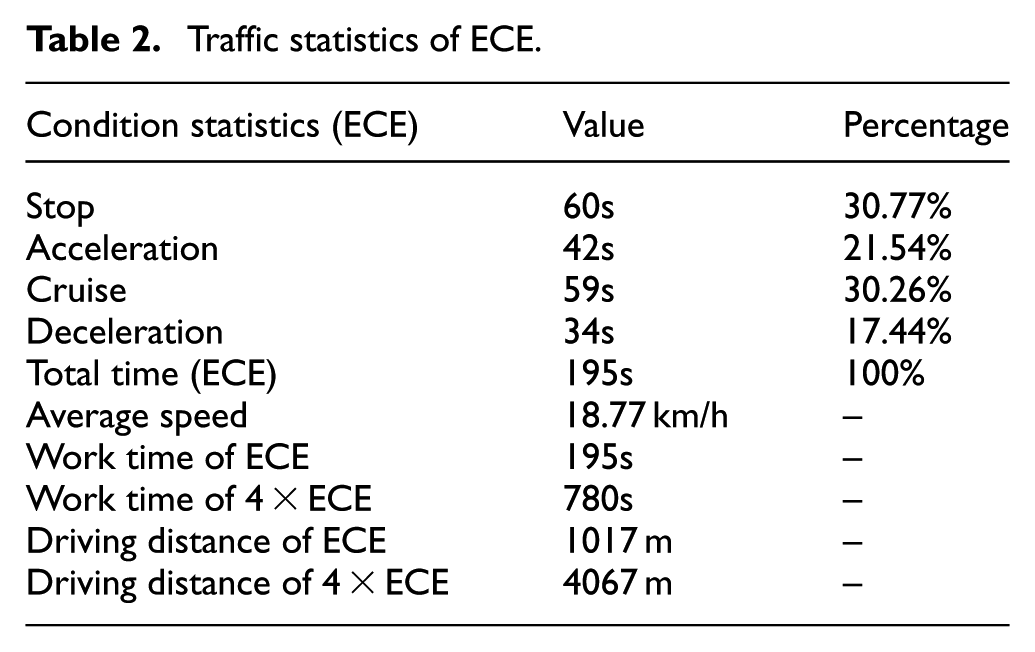
The specific traffic information in ECE is given in Table 1 and Table 2. And traffic information in EUDC is given in Table 3 and Table 4.
Traffic information of ECE.

Traffic statistics of ECE.
Traffic information of EUDC.

Traffic statistics of EUDC.

In order to carry out the theoretical analysis and the control optimization, the actual driving cycle should be quantified. In this article, the physical meaning of the NEDC condition is quantified as shown in Figure 4.

Physical meaning of NEDC.
As can be seen in Figure 4, each parking point (where velocity is zero) of NEDC cycle can be set as traffic light position (fixed). So, there are 13 traffic lights (because there are 13 points where velocity is zero) in the NEDC cycle. The parking time can be seen as the time of red and yellow light, and vehicle start time is the time traffic lights change from red to green. For convenience, this article assumes that green phase duration is equal to 10 s. The area between the curve and the coordinate axis between each two parking points could be considered as the actual distance between two adjacent traffic lights. Therefore, the NEDC data are quantified as the driving cycle based on traffic light position and the red light time information, as shown in Table 5.
Traffic information table based on NEDC cycle.

According to Table 5, the road traffic information map is shown in Figure 5.

Road traffic information.
In order to make the road traffic information more close to the actual situation, a forward vehicle was introduced in L6 and L13 sections as the target of subject vehicle to follow. After entering the L6 and L13 sections, the subject vehicle follows the forward vehicle as a goal of automatic cruise control. When the forward vehicle runs out of L6 and L13 sections, the subject vehicle recovers the original intelligent control according to the traffic lights information on current road. The forward vehicle driving cycle is shown in Figure 6.
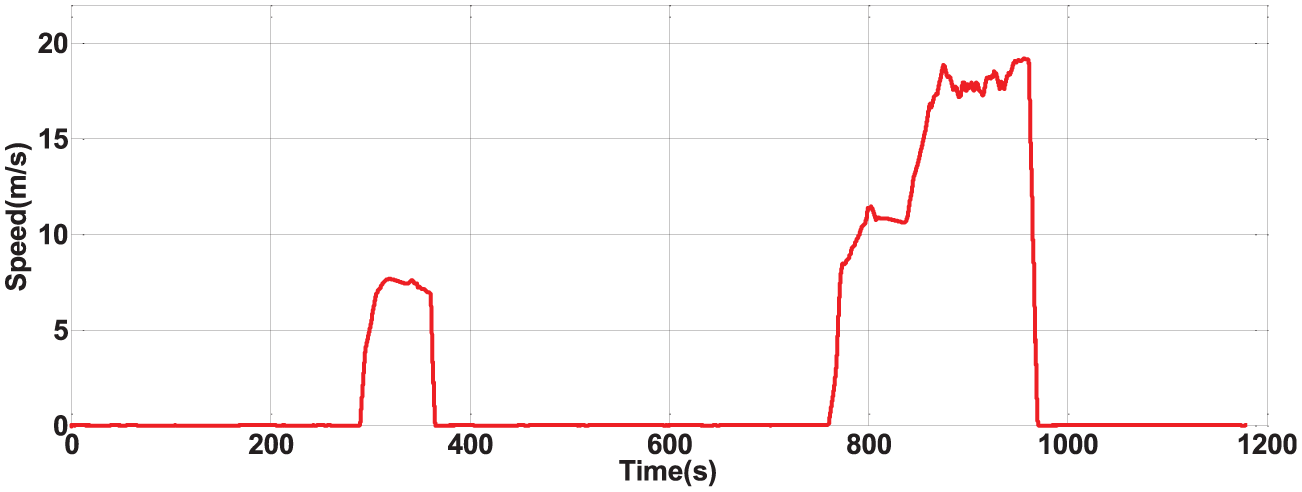
Forward vehicle driving cycle.
Electric vehicle energy predictive modeling
Vehicle system dynamics modeling
The main driving force of vehicle is rolling resistance, acceleration resistance, gradient resistance, and air resistance according to the automobile power balance equation15,16

where Tm is the motor driving torque. m denotes the quality of electric vehicle; G stands for the weight of electric vehicle, G = mg; V is the vehicle velocity; f is the rolling resistance coefficient; ig is the transmission ratio; i0 represents the transmission ratio of main reducer; ηT denotes the mechanical efficiency of transmission system; CD is the air resistance coefficient; A is the windward area; δ is the conversion coefficient of vehicle rotary mass; a is the vehicle acceleration; and r is the wheel radius.
Power-train system modeling
The structure of electric power train is shown as Figure 7. Motor controller input and output power are as follows

where PmI represents the input power of motor controller; PB is the output power of the battery; UB denotes the output voltage of the battery; IB is the output current of battery pack; PmO is the output power of the motor; and ηm refers to the efficiency of the motor system (including the motor and controller), and it generally adopts the efficiency MAP, which is obtained through the bench test, as shown in Figure 8.

The structure of electric power train.

Motor efficiency MAP.
The input and output power of single-stage reducer is

where PgI is the input power of single-stage reducer; PgO stands for the output power of single-stage reducer; and ηg denotes the single-stage reduction gear efficiency. As there are only two sets of gears in the single-stage reducer, it is generally believed that its efficiency is higher and it can reach about 96%–98%. But considering that the electric vehicle single reducer operation points have the relationship with the efficiency, in order to reflect the effect of operating conditions on the vehicle energy consumption, the efficiency MAP of single reducer was tested on the bench, as shown in Figure 9.

Single reducer efficiency MAP.
The driving torque of the tire can be approximated as the output torque of the transmission

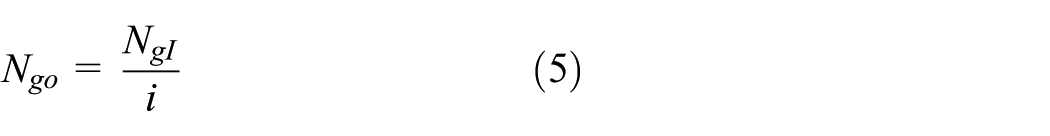
where Tgo is the single reducer output torque; Ngo denotes single reducer output speed; NgI is the single reducer input speed; and I represents single reducer ratio.
Battery system modeling
The battery consists of banks in serial and parallel arrangements, and each battery bank consists of cells. Related equations are as follows

where Ucell represents the output voltage of single cell; U0cell is the open-circuit voltage of single cell; Rcell denotes the internal resistance of single cell; Icell is the current of single cell; IB is the output current of battery pack; Pbank is the number of battery banks in parallel; UB is the output voltage of battery pack; Ncell is the number of cells in series per battery bank; and Sbank is the number of battery banks in series. The single cell open-circuit voltage and single cell internal resistance are shown in Figure 10 and Figure 11, respectively.

Battery open-circuit voltage.

Single-cell internal resistance.
Energy predictive optimal control using V2I communication
Figure 12 is the ratio of energy consumption in different driving mode under urban conditions.21,22
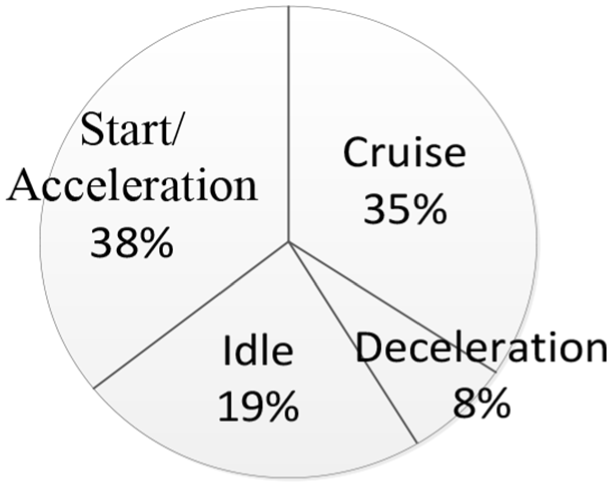
Energy consumption ratio of different driving conditions.
As can be seen from Figure 12, the start/acceleration process accounted for the largest reaching 38%, followed by the cruise process, about 35%. This shows that in city conditions, the use of economic acceleration and cruise strategy to reduce energy consumption has a positive significance. 4 According to Kamal et al. 11 and Asadi et al., 12 predicting cruise control system through the traffic information and relaxed cruising speed tracking requirements can reduce the parking time of vehicle in the traffic intersection.
When the vehicle is running at a relatively constant speed, it can not only save energy but also improve the life of vehicle. This article presents an intelligent energy predictive optimal control algorithm for electric vehicles based on V2I information.
Optimal control is one of the main branches of modern control theory, which focuses on the basic conditions and synthesis methods to optimize the performance of control system. Optimal control theory is proposed to solve the problem by searching the best solution from all alternative control selections.23,24 Preview follower theory is proposed by the Chinese Academy of Engineering GuoKonghui in 1982. 25 The theory describes the characteristics of system based on future input information. Generally, driving behavior is consistent with the “preview follow theory.”21,22,26–29 The driver’s control of vehicle speed is essentially determined by the driver to follow the preview path. According to the preview follower theory, the preview step mainly reflects the driver’s expected trajectory decision; it is the decision-making process of the driver. The follower step is driver’s understanding of their own characteristics, and dynamic of the vehicle can be equivalent to the operation of driver’s correction of vehicle dynamics. 26 Accong to Gao et al. 27 and Yamaguchi et al., 28 the driver’s control of vehicle can be considered as a continuous process of “information processing—trajectory decision—operation correction” process.
Some researchers have studied the model predictive control in hybrid electric vehicles.30–32 In literature, 30 stochastic Markov chain and neural network–based velocity prediction approaches were described depending on basic principles of exponential variation, and results demonstrate that NN-based velocity predictors provide the best overall performance across a range of certification and real-world drive cycles. 30 A supervisory state of charge (SoC) planning level generating an SoC trajectory from traffic data for the terminal SoC constraints in the MPC level and a power balance PHEV model were developed in Sun et al. 31 Results showed that the predictive energy management strategy with dynamic traffic data can achieve 94%–96% fuel optimality of the deterministic DP benchmark in a highway driving scenario. 31 According to the literature, 32 a neural network–based velocity predictor was constructed to forecast the short-term future driving behaviors by learning from history data, and it can achieve better fuel economy and more stable battery SOC trajectory, with a fuel consumption reduction by over 3%. 32
The control structure based on V2I information is shown in Figure 13. The information process module is responsible for collecting external traffic information and vehicle’s information. The external traffic information is the traffic lights location and time, forward vehicle speed, and distance. The subject vehicle information includes vehicle speed, location, and current time information. The optimal decision module calculates and decides the optimal expected speed, according to the pass time that the forward traffic lights allowed and the distance, or the forward vehicle speed and distance. Correction module, according to the vehicle driving and brake system characteristics, adjusts the real-time motor drive and brake pedal force to achieve the optimal performance.

Control structure based on V2I information.
The vehicle has several options to pass through road junction; it can choose the time of red light turning green, can also be the last moment becoming yellow, or any time between these two moments. Vehicle motion preview algorithm can predict different modes according to the distance and expected time, and then the optimal driving mode could be decided:

V is the expected vehicle speed, S is the distance from subject vehicle to forward vehicle, and Tp is the expected time.
Based on the multi-objective optimization of vehicle performance, the safety index IDS1, the economic index IDS2, the dynamic index IDS3, and the comfort index IDS4 were used to evaluate four kinds of evaluation indexes.
The safety index IDS1 is the weighted value of the distance to the forward vehicle and relative acceleration value to the forward vehicle. The economic index IDS2 is the energy consumption of the whole vehicle; it can be predicted by vehicle energy consumption model. The dynamic index IDS3 is the weighted values of the vehicle speed and acceleration. The comfort index IDS4 is the weighted values of acceleration and jerk.
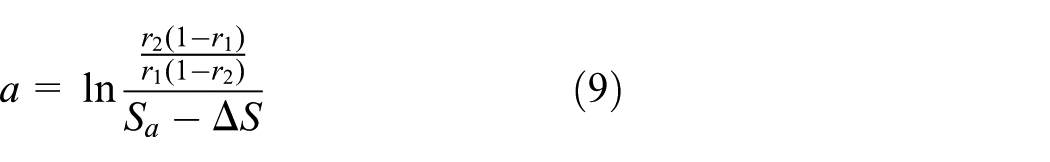
The safety index IDS1 describes vehicle driving safety in the process of making decision of expected positions, which is according to the longitudinal distance between expected positions and forward vehicle, and ideal safe distance. The IDS1 membership diagram and function formula is as follows

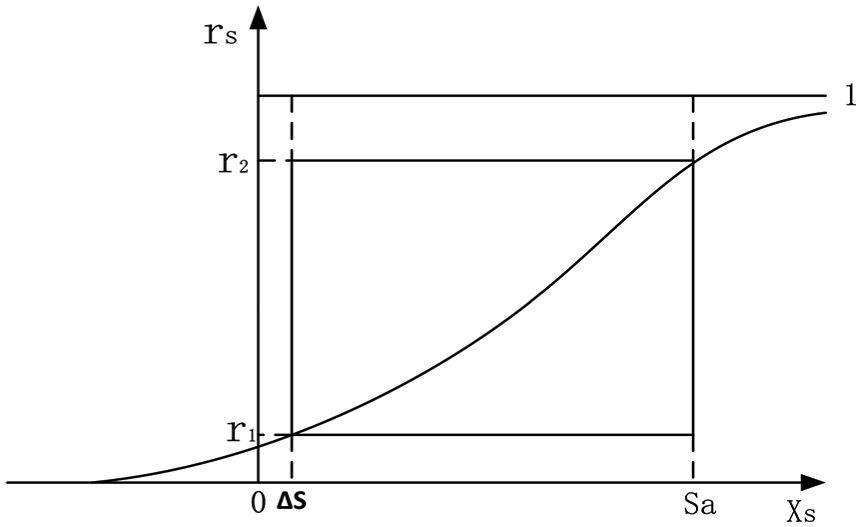
In Figure 14, Sa symbolizes the ideal distance between two vehicles, ΔS is the minimum distance between two vehicles after braking (this article used it as the boundary between low gain and high gain), and rs is the security membership. xs represents the characteristic value of security membership, which refers to the distance between the subject vehicle and forward vehicle after the preview time period Tp. The larger xs is, the better IDS1 will be. At the same time xsi = Sa was used as the membership function high-gain boundary. In formula (8), the coefficients a and c are determined as follows: the unipolar sigmoidal function is a non-linear gain function, that is, the middle part is the high-gain region (shown in the box part in Figure 14) and other part is low-gain area. As long as the independent variables of the high gain area and the range of values can be obtained, coefficients can be determined. The independent variables region of the high-gain region is set as [ΔS, Sa], and the corresponding range is set as [r1, r2] (in this article, r1 is equal to 0.08 and r2 is equal to 0.92 (r1, r2 are empirical values)). In summary, a and c are

IDS 1 membership diagram.
The safety index which was established above is in case that there existed a forward vehicle, and if there does not exist a forward vehicle, the formula is assumed as


where Si, j is the distance between two vehicles at present time; VB is the speed of the forward vehicle and VA is the speed of subject vehicle; and Sa is the minimum safe distance between the two vehicles.
The economic index IDS2 is the energy consumption of the whole vehicle, and its membership diagram and function formula are as follows

From Figure 15, T1 is the time when traffic lights in current road section changed from red to green; Δt is the green light duration (10 s); re is the economic membership; and xe is the characteristic value of economic membership, which refers to the power consumption. The smaller xe is, the better IDS2 will be. At the same time, xei represents the corresponding power consumption through the intersection at different times in green light duration [T1, T1 + ΔT], which can be predicted by the vehicle energy consumption model. Then, they are arranged from small to large as the horizontal axis.

IDS 2 membership diagram.
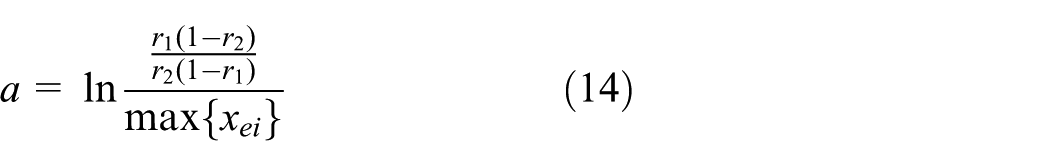
The method of determining the coefficients a and c is similar to the safety index. The independent variables region of the high-gain region is set as [0, max{xei}], where i is between [0, ΔT], and the corresponding range is set as [r1, r2] (in this article, r1 is equal to 0.08 and r2 is equal to 0.92). In summary, a and c are

The dynamic index IDS3 is the simulation based on principle of passing through the road intersection in the shortest time (in actual driving process, driver always want to pass through the front intersection in the shortest possible time). Its membership diagram and function formula are as follows
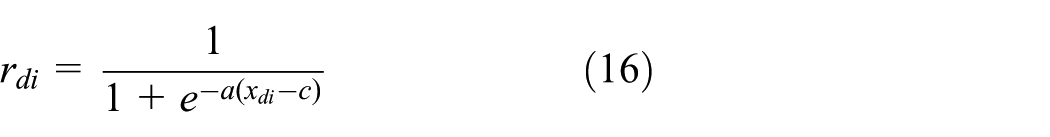
From Figure 16, T1 is the time when traffic lights in current road section changed from red to green; Δt is the green light duration; here, it is set as 10 s; rd is the economic membership; and xd is the characteristic value of economic membership, which refers to the time of the vehicle passing through the current intersection. The smaller xd is, the better IDS3 will be. At the same time, xdi represents the corresponding power consumption through the intersection at different times in green light [T1, T1 + ΔT] duration.

IDS 3 membership diagram.
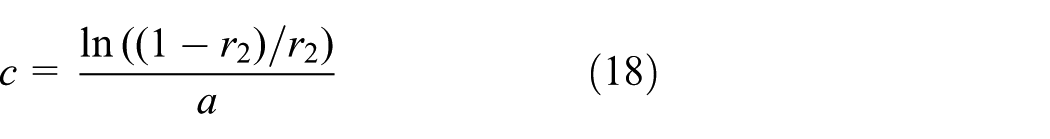
The method of determining a and c is similar to the safety index. The independent variables region of the high-gain region is set as [0, T1 + ΔT], where i is between [0, ΔT], and the corresponding range is set as [r1, r2] (in this article, r1 is equal to 0.08 and r2 is equal to 0.92). In summary, a and c are

The comfort index IDS4 reflects the degree of change in the control command in the vehicle control system, which means that the driver should control the vehicle in a moderate and gentle manner. On the one hand, the speed of the car and other driving state cannot be abruptly mutated; on the other hand, the huge degree of changes in speed or acceleration will lead to a sharp decline in passenger comfort. Its membership diagram and function formula are as follows

From Figure 17, it can be observed that rm is the comfort membership; xm is the characteristic value of comfort membership, which refers to the change in the longitudinal acceleration of the vehicle.

IDS 4 membership diagram.
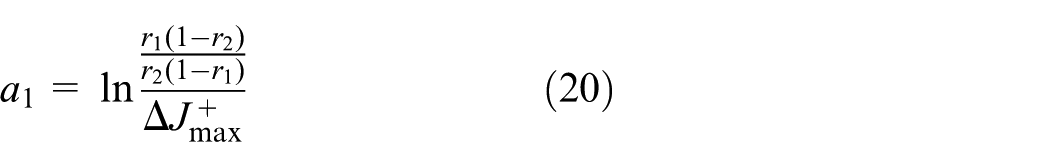
The method of determining the coefficients a1, c1, a2, and c2 is similar to the safety index. The independent variables region of the high-gain region in acceleration is set as [0,


The overall evaluation index

Four kinds of weight reflect the importance of various indexes. Generally, safety is the most important index. In the economic driving mode, the economic index is higher weighted, and in dynamic driving mode, the dynamic weight value is higher. Comfort index is generally low value; if it is a limousine, can be considered a higher value. In this article, safety is the most important index, and economic index is less important, while other two indexes are the least important. So k1, k2, k3, and k4 are, respectively, set as 0.6, 0.2, 0.1, and 0.1.
There are some constraint conditions of the control should be considered
Vehicle speed range limit

Motor torque limit

Battery output power limit

where Vmin and Vmax are the vehicle speed limited according to the traffic regulations. Tmax is the maximum motor output torque ability and Pmax_T is the battery output power limited in different temperatures.
Simulation and results
The software AMESim is an alternative solution for multisubject field modeling and simulation. Users can develop complex multisubject system model in the platform and move to simulation rapidly. Engineers can be liberated from math modeling and pay more attention to physical system design and control. More and more applications of AMESim have been found in automotive industry in recent years.33,34
The co-simulation platform has been becoming one of efficient developing methods in multisubject simulation area nowadays. Platform built in this article is shown as Figure 18. It includes vehicle model, driving cycle, battery model, accessory model, motor model, reduce gear and drive-train, and VCU.

Simulation platform based on Simulink–AMESim.
V2I section in simulation was designed as a table containing traffic information (green duration and position of lights) which could be directly transmitted to VCU and be used to plan the future vehicle trajectory. So, VCU would receive updated information from V2I table in different time when making decision, and the updates would cause various driving behavior which could influence the vehicle performance.
The control algorithm developed in this article is built in Simulink. Vehicle has several options to cross the road, and preview algorithm makes optimal decision according to several driving modes.
Vehicle parameters are given in Table 6, which is front motor front drive (FF) PEV with 26.78 kW h battery power.
Vehicle and battery parameters.

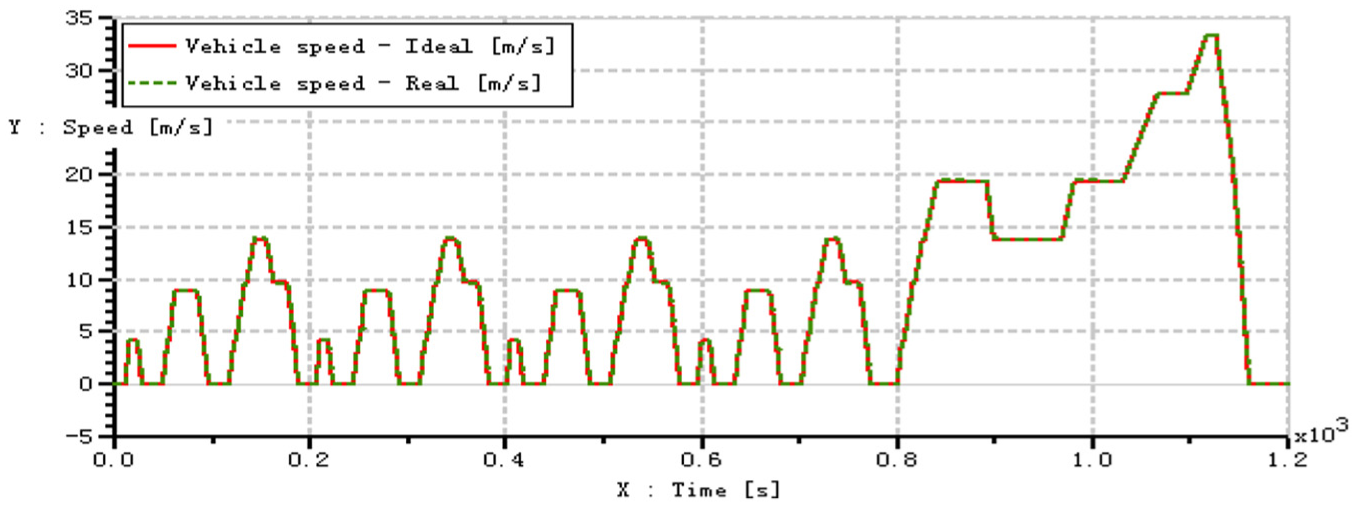
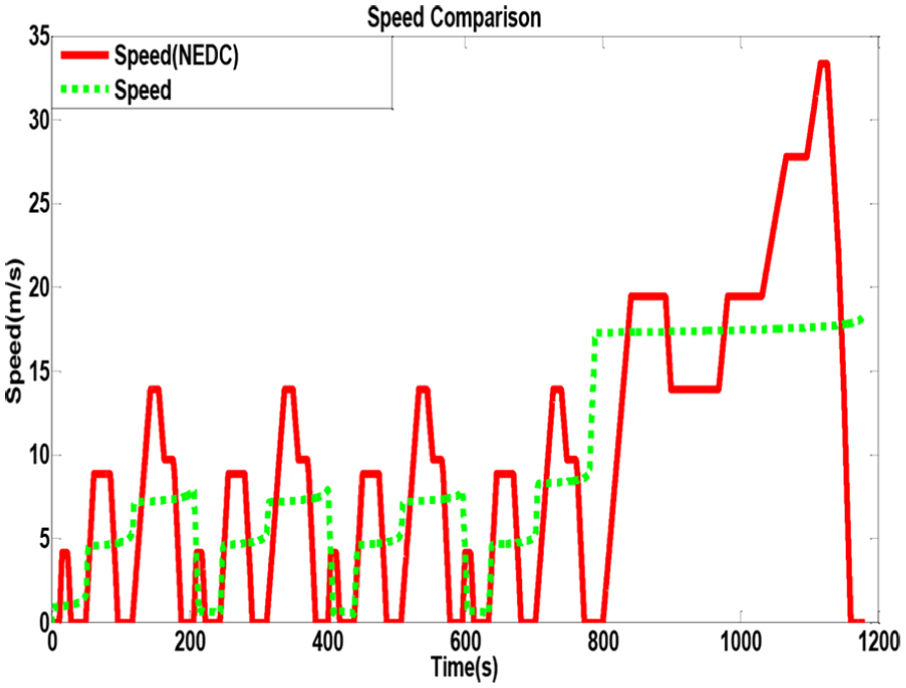
From Figures 19 and 20, vehicle driving optimization and intelligent control were realized; based on intelligent traffic information control algorithm, the vehicle deceleration operation was effectively reduced frequently. Moreover, the proposed algorithm can achieve following function in many complex driving conditions and it has strong adaptability and robustness.
Speed comparison (without forward vehicle).

Speed comparison (with forward vehicle).
Comparison of motor working points
The motor output torque comparison is shown in Figure 21, which is the comparison between normal NEDC control and the V2I optimal control proposed in this article.

Comparison of motor torque.
From Figure 21, it can be observed that the optimal control strategy can reduce the motor torque frequency significantly. Originally, motor frequently switches between driving and braking. After using optimal control, motor mainly works in drive mode. Mode switching is greatly reduced, so the operation of the motor is more stable, to improve motor efficiency and increase the service life.
In order to quantify the effect of the whole vehicle economic performance improvement, the energy consumption and the endurance mileage are simulated as follows.
Vehicle economic comparison
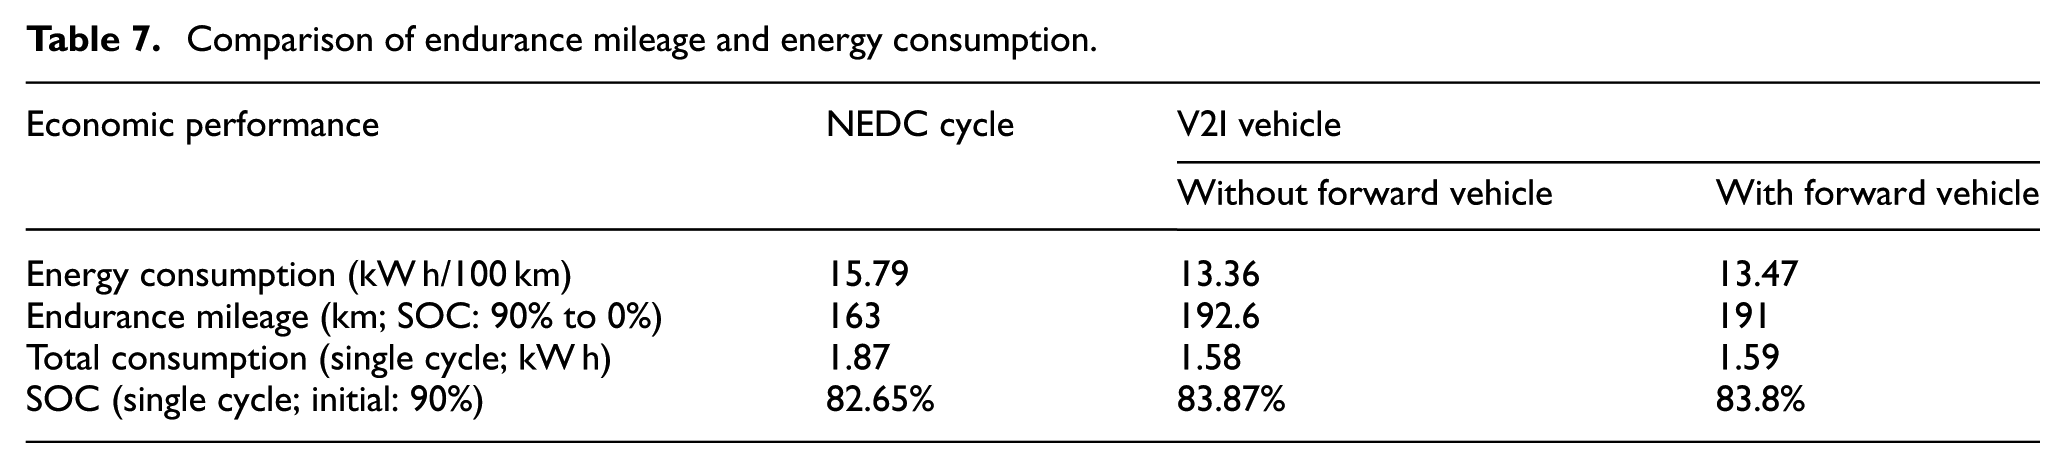
The economic performance comparison between NEDC normal controls and optimal control based on traffic information is shown in Table 7.
Comparison of endurance mileage and energy consumption.
Comparison of comfortable performance (without forward vehicle).

As can be seen from Table 7, the use of optimal control algorithm can effectively reduce the energy consumption of the vehicle and improve vehicle endurance mileage, and vehicle economic performance has been significantly improved as well. This is because during the driving process, the start and acceleration processes accounted for relatively large, and the optimal control algorithm can greatly reduce the starting frequency and acceleration. And the economic drive and cruise control strategy can reduce energy consumption significantly.
Vehicle ride comfort comparison
The ride comfort comparison, between normal NEDC control and intelligent control, is as shown in Figures 22–27.

Acceleration pedal (without forward vehicle).
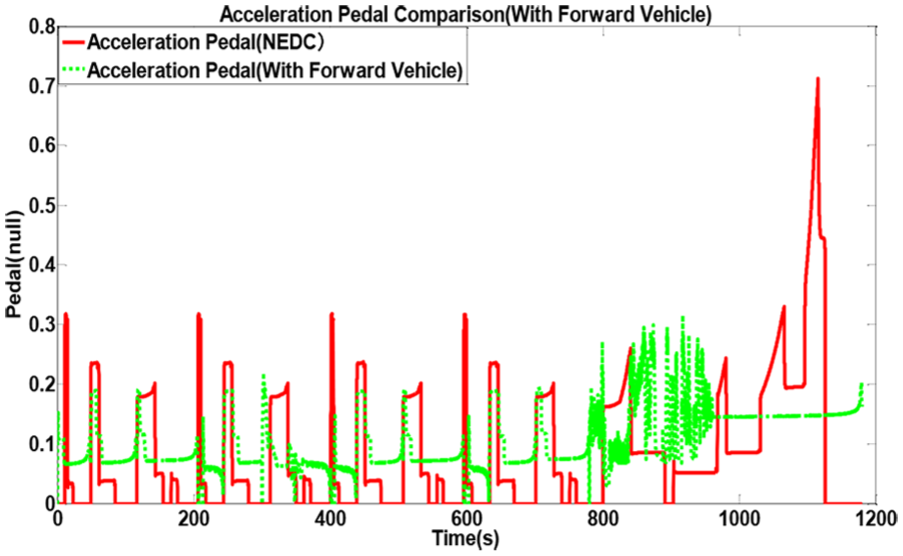
Acceleration pedal (with forward vehicle).

Braking pedal (without forward vehicle).
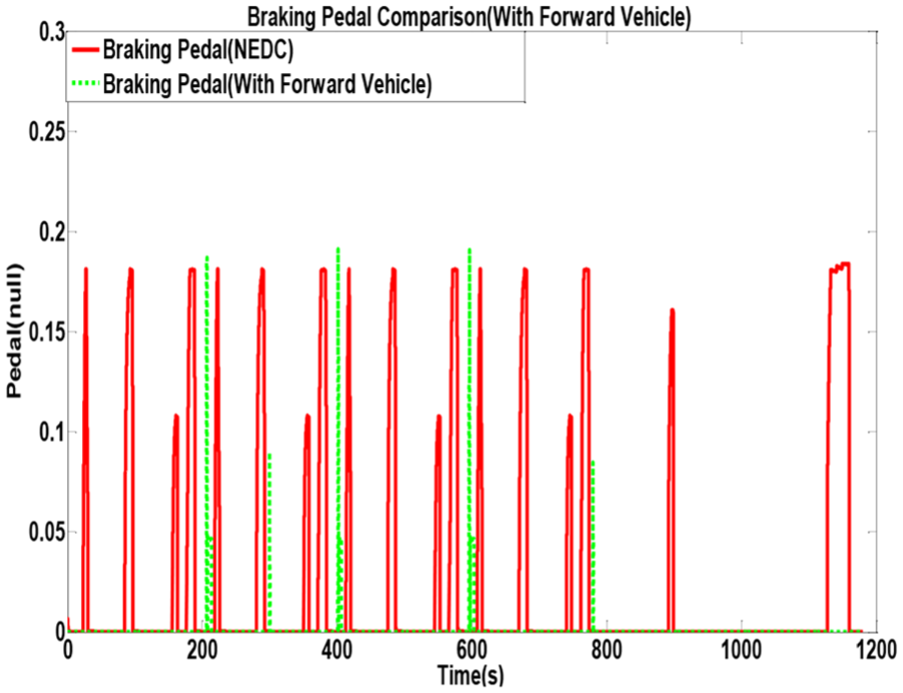
Braking pedal (with forward vehicle).
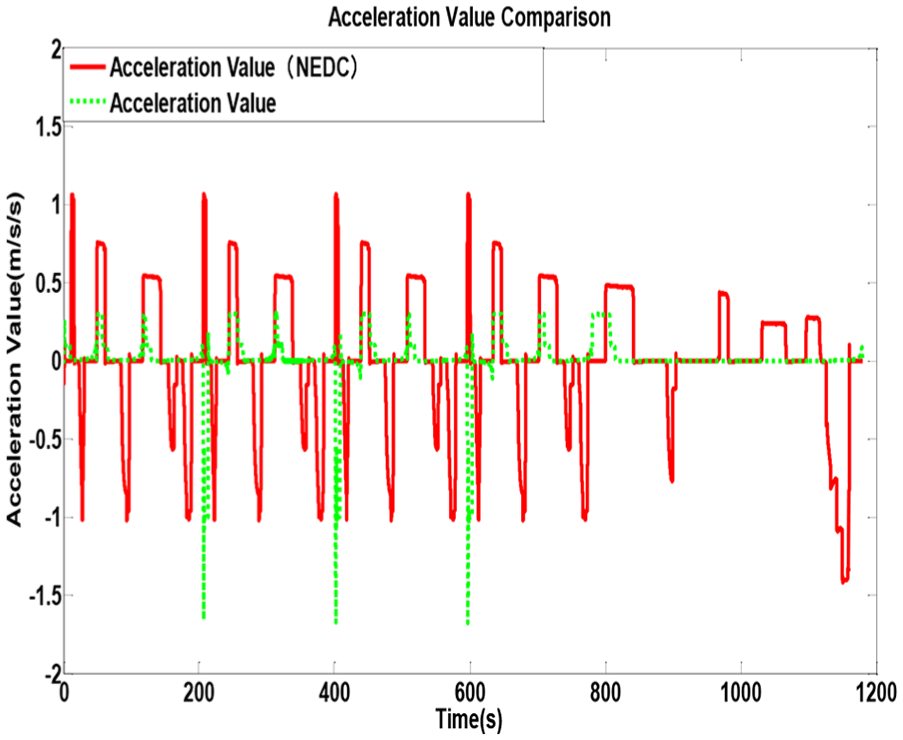
Acceleration comparison (without forward vehicle).
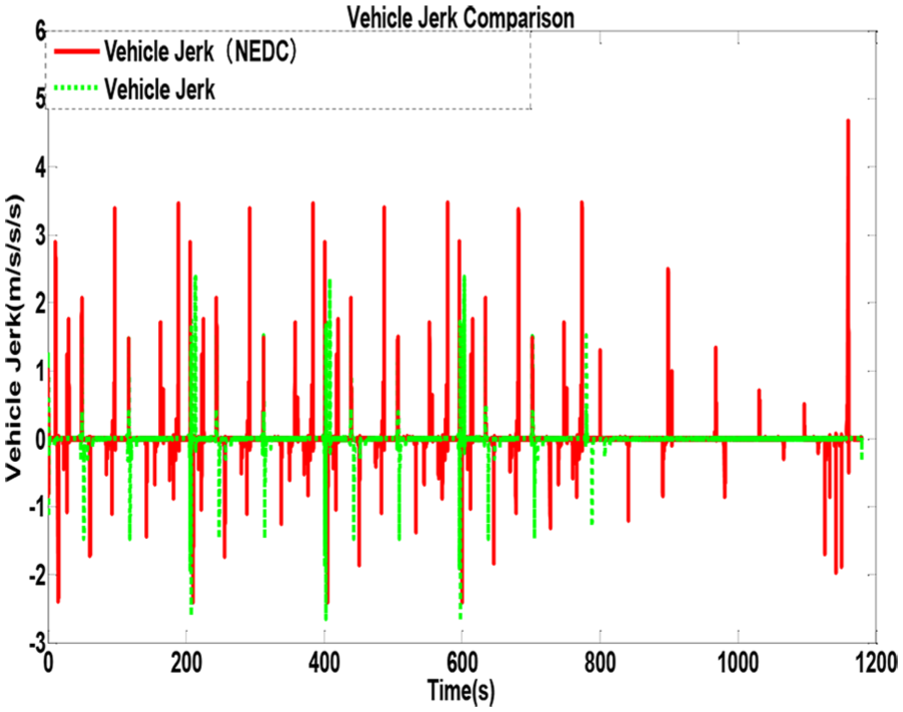
Jerk (without forward vehicle).
From Figures 22–27, the number of pedals’ fluctuations was reduced significantly. Meanwhile, the peak value was decreased as well. It means that the optimal control based on V2I information alleviated the labor of the driver effectively, and driving comfort was increased. The increment of comfort can be certified as shown in Figures 26 and 27 and Table 4, where the frequency of acceleration and peak value of jerk were reduced significantly.
Driving mode comparison
The comparison of the ratio of different driving mode between normal NEDC control and intelligent control is as follows.
From Figure 28, percentage of the start and acceleration process and stop and deceleration has been decreased significantly; however, the cruise accounts for extremely large. So, after intelligent control, the energy consumption can be obviously reduced.
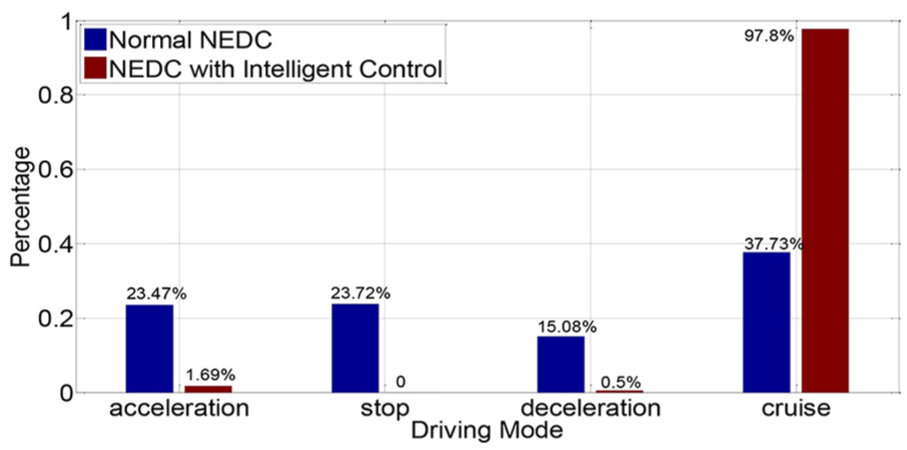
The comparison of the ratio of different driving modes.
Conclusion
This study focused on the trajectory and performance optimization of battery vehicle with V2I. Firstly, based on NEDC data, a new test cycle including V2I information was quantified. Then, the intelligent drive control strategy was developed and the electric vehicle system dynamic model construction and control strategy were analyzed and modeled. The developed cycle and control algorithm were simulated in the AMESim and Simulink co-simulation platform. In the same time, the target vehicle was introduced and its trajectory was designed in order to make the simulation environment more in line with the actual situation. Finally, the simulation results showed that the real-time intelligent decision-making and control algorithm based on road information could improve its economic performance and ride comfort effectively. After the introduction of the forward vehicle, the following drive can be effectively achieved.
However, research in this study also has some limitations. For example, the traffic information used in the driving was simple; it only considers the traffic light information and front vehicle information. In the future, more information will be considered such as obstacles and pedestrian. In addition, for practical applications, the optimal control strategy needs to consider the real-time performance and it would be better to be implemented easily.
Footnotes
Handling Editor: Marianna Imprialou
Declaration of conflicting interests
The author(s) declared no potential conflicts of interest with respect to the research, authorship, and/or publication of this article.
Funding
The author(s) disclosed receipt of the following financial support for the research, authorship, and/or publication of this article: The authors received financial support from National Key R&D Program of China (2017YFB0103700).