
Abstract
This article is based on the spindle reliability test bench, which carries out a thorough study on the rotor system misalignment. Misalignment is one of the most common malfunctions in the rotor system, which seriously affects its reliability. When misalignment occurs, the diaphragm group will deform to compensate for the misalignment between the driving shaft and the driven shaft, but the deformation will generate additional load. When the degree of misalignment is more serious, the additional load will affect the stability of the test bench. Due to lack of research on diaphragm couplings, there is no concrete formula of additional load caused by misalignment. In this article, the mechanism of additional load is expounded, which is based on the force and deformation analysis method. And the formulas of deformation in different misalignment conditions are deduced. Through the combination of Workbench simulation and experimental verification, the axial stiffness and radial stiffness of the diaphragm coupling are solved, and the formulas of the additional load are derived. The misalignment characteristic signals are analyzed theoretically, and the monitoring system of misalignment characteristic signals is established. Through experiments, we study the characteristics and influence of the misalignment error value in various misalignment conditions.
Introduction
It is misalignment malfunction that the misalignment of the rotor system exceeds the design specifications. Misalignment malfunctions will cause the rotor system to bear additional loads in the axial and radial directions, which will increase with the degree of misalignment. Access to relevant literature at home and abroad shows that misalignment as one of the most common malfunctions of rotor system, the failure rate of which account for 60%–70%, seriously affecting the reliability of rotor system.1–4 Diaphragm coupling is a kind of coupling that transmits torque and compensates relative displacement between two shafts by several thin metal steel plates. It compensates the axial, radial, and angular displacements between the two rotating shafts through the three-dimensional deformation of the metal diaphragm group. Compared with the traditional couplings, the diaphragm coupling has the advantages that are strong misalignment adaptability, simple structure, easily disassembling and installing, no lubrication required, wide application of working conditions, and early warning ability, so it has been applied more and more widely.5–7 So far, domestic and foreign scholars have carried out some researches on the misalignment working condition of diaphragm coupling. L Rong 8 established a dynamic model of a misaligned coupling, simulated, and experimentally analyzed the bending stiffness and torsional stiffness of the coupling. Using the dynamic model of the rotor-bearing system, Gao Hongtao discussed the influence of misalignment on modal, eigenvalues, and stability of the rotor system. The experiment results show that slight misalignment only brings out some changes to the modal of the system and will not change the critical speed, but serious misalignment will affect the stability of the system. 9 However, equivalent shaft segment method does not consider the coupling effect of the coupling and adds a constraint to the system, so there is still a little shortage. Al-Hussain 10 established the flexural and torsional coupling vibration equation of the rotor system composed of the gear coupling by Lagrange method. C Li 11 established the misalignment dynamic equation of the coupling by Lagrange method and got the misalignment parametric vibration system. The Lagrange energy method is suitable for simple rotor systems with less degrees of freedom, but has lower accuracy for complex (multiple degrees of freedom) rotor systems. Z Shen 12 established the mathematical model of the rotor–coupling–bearing system by studying the mechanical characteristic of misaligned gear couplings and obtained the function expression of exciting force generated from misalignment and explained the malfunction mechanism of misaligned gear coupling in detail. S Liu and Wang 13 established the mechanical model of the diaphragm coupling in the axial misalignment condition by ANSYS and discussed the influence of the bolt preload on the finite element analysis results. W Wei 14 analyzed the causes and characteristics of rotor system misalignment and deduced the exciting force function expression of the rotor system caused by parallel misalignment of coupling from the geometric relationship of deformation. Based on the meshing relationship of the gear coupling, X Long 15 analyzed the force and motion of the gear coupling, obtained the functional relationship between misalignment and radial additional load, simulated the rotor system differential equations of motion with newmark, and got the dynamic characteristics of the system. Considering that this article needs to obtain the function expression of additional load caused by misalignment, synthesizing the merits and demerits of the above three methods, this article chooses the force and deformation analysis method based on the coupling to construct the misalignment modals of motorized spindle test bench.
The modeling analysis of the misalignment rotor system is an explanation of the misalignment phenomenon, and the destination of the research is to find the method on monitoring misalignment state and prevent harsh conditions. Therefore, domestic and foreign scholars have also deeply studied the characteristic signals in the misalignment state of rotor system. JL Nikolajsen 16 points out that there is no absolute alignment in the rotor system and analyzes the impact of bearing-induced misalignment on system stability by finite element method. From the perspective of kinematics, X Zhang and Y Zhang 17 expounded that when the rotor system is misaligned, the characteristic signals of double frequency vibration will generate and then proved it by the spectrum analysis of experiment data. C He et al. 18 established a misalignment flexural and torsional coupling differential equations using kinetic theory and qualitatively analyzed the interaction between flexural vibration and torsional vibration. Numerical simulation shows that the torsional and flexural directions are mutually coupled, and the bending and torsion coupling will stimulate the system working frequency and frequency multiplication, the working frequency component accounted for the largest. From the perspective of structural vibration, Dewell and Mitchell 19 studied the vibration frequency of diaphragm coupling in misalignment condition. Jalan and Mohanty 20 pointed out that the misalignment malfunction can cause a large dynamic effect on the rotor system, such as mechanical vibration, shaft deformation, and bearing wear that cause the rotor system to be abnormal. AW Lees 21 pointed out that in the tiny-angle misalignment condition, the exciting force contains double frequency excitation. W Birchall et al. and S Bouaziz et al. proved that the misalignment malfunction will cause bending deformation of the shaft and result in a change of shaft center trajectory. When the misalignment malfunction is particularly serious, the frequency doubling vibration component is more.22,23
To sum up, different research methods to rotor system are different, and of which the characteristic signals are also different. The domestic and foreign scholars mostly study the misalignment of the rotor system formed by the gear coupling, while the misalignment research on the rotor system formed by the diaphragm coupling is less. Therefore, the misalignment research on the rotor system formed by the diaphragm coupling needs further study.
Diaphragm coupling misalignment model
Misalignment type
Due to manufacture and installation errors, load deformation, temperature change, and many other factors, the driving and driven shaft axis cannot guarantee coincidence, and there is a certain degree of relative displacement. As shown in Figure 1, according to the relative position of the two axes, misalignment is divided into four types, which are axial misalignment, radial misalignment, angular misalignment, and synthesized misalignment.
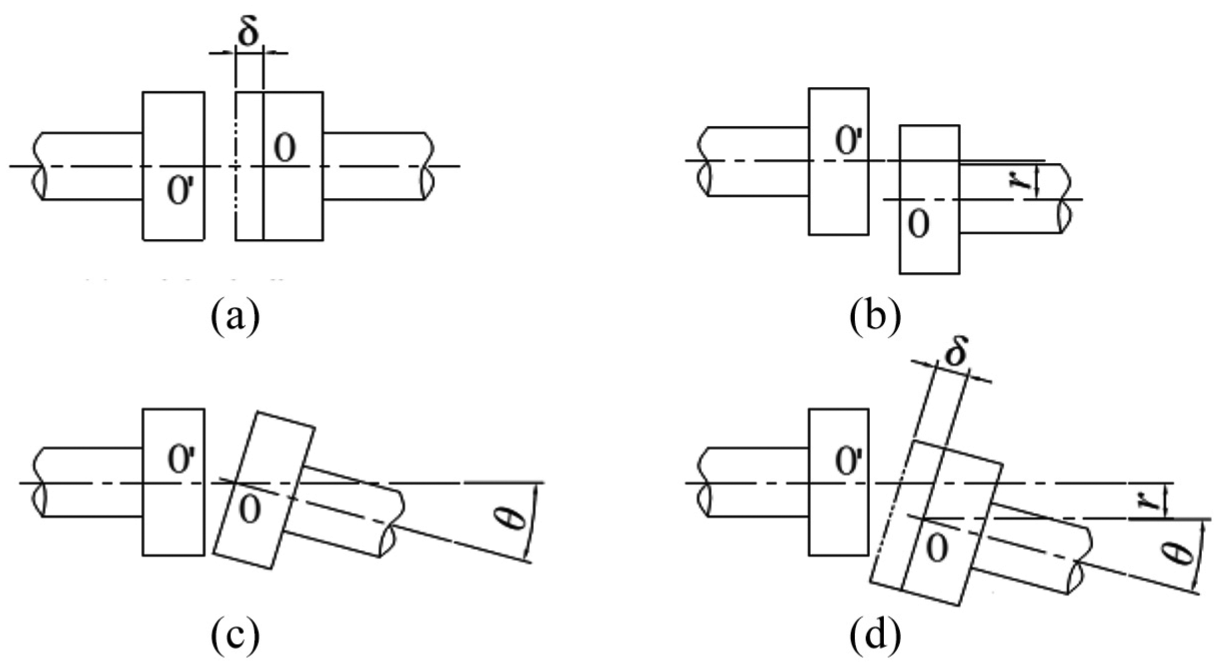
Misalignment types: (a) axial misalignment, (b) radial misalignment, (c) angular misalignment, and (d) synthesized misalignment.
Deformation caused by misalignment
In this article, the diaphragm coupling structure is shown in Figure 2, which mainly consists of the left and the right semi-coupling, diaphragm group, pads and bolts, and other components.

Diaphragm coupling structure diagram.
Work process (assuming the force input from the left axle): the left half of the coupling transmits torque to the A, C driving bolt, and then A, C transmit torque to B, D driven bolt, and then B, D driven bolt transmit the torque to the right half-coupling, and finally complete the transmission of torque between the two axes. Through the force analysis, it can be drawn that in the process of torque transmission, the metal diaphragm group AB, CD sides are pressured but AD, CB sides are tensioned. Therefore, the diaphragm coupling transmits torque through the tension and pressure deformation of the metal diaphragm group.
At any instant of operation, the driven bolt hole is considered as stationary, and the diaphragm group will generate the following several types of deformation in different misalignment conditions:
Torsional deformation caused by torque transmission (Figure 3(a)).
Bending deformation caused by axial misalignment (Figure 3(b)).
Tension and compression deformation caused by radial misalignment (Figure 3(c)).
Bending deformation caused by angular misalignment (Figure 3(d)).
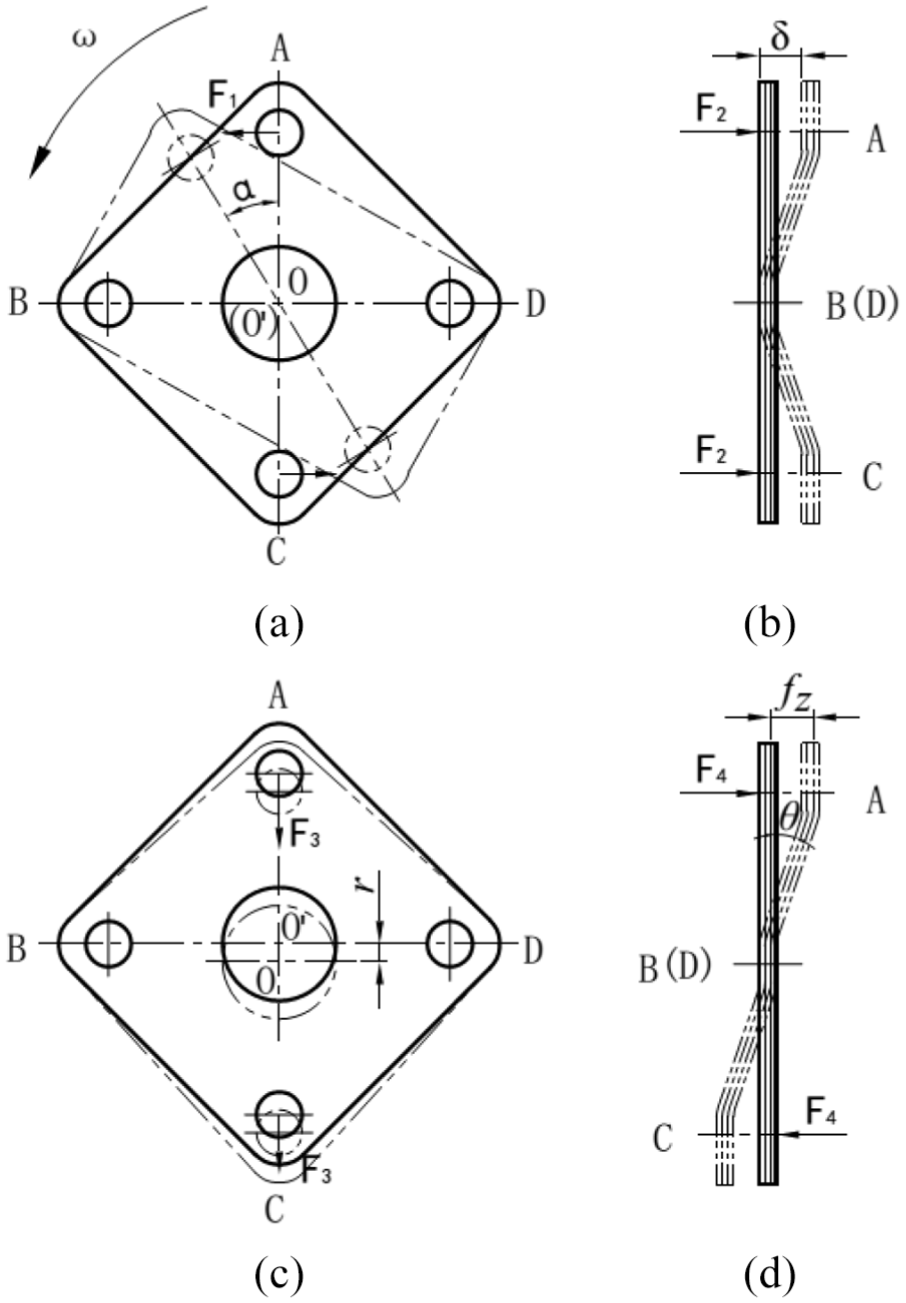
Deformation types of the diaphragm.
In Figure 3, the solid line is the contour line without the deformation, and the two-dot chain line is the contour line subjected to the force of various working conditions.
In summary, when the coupling misalignment occurs, the driving bolt and driven bolt have a tendency to maintain the original position and make the diaphragm group generate tensile, compression, and bending deformation, thereby producing an internal excitation.
Additional load caused by misalignment
The previous section shows that when misalignment occurs on test bench, the diaphragm group will deform to compensate for the misalignment between the two axes of the spindles. Deformation will generate force, which is a kind of additional load. It will react to the rotating shaft through the driving bolt and be applied to the spindle. The purpose of this section is to derive function expressions of the additional load generated from various misalignment conditions.
Mathematical model of the diaphragm group
It can be seen from the previous study that the additional load generated by misalignment is caused by the deformation of the diaphragm group. Therefore, a mathematical model of the diaphragm group needs to be established first. Considering the structural characteristics and the force of the diaphragm group, we should establish a 3-degree-of-freedom mathematical model. The 3 degrees of freedom include axial, radial, and tangential directions, as shown in Figure 4.

Model of diaphragm coupling.
In Figure 4,
Based on the theory of vibration theory, the formula of motion for a multi-degree-of-freedom system is

where M is the quality matrix of the system, C is the damping matrix of the system, K is the stiffness matrix of the system,
Solving the additional load is to solve the kinetic parameters in equation (1), which is to solve the stiffness matrix, the equivalent mass matrix, and the damping matrix. Misalignment malfunction will only deform the diaphragms in the axial and radial directions. Therefore, the tangential dynamic parameters are unnecessary in this article.
Solution of stiffness of diaphragm group
This article studies the additional load caused by misalignment, so only the axial stiffness and radial stiffness of the diaphragm coupling should be solved. There are three methods to get the stiffness of the diaphragm coupling mainly: the first one is the analytic method, which apply mechanics knowledge to derive the stiffness that is divided into the elastic mechanics method and the material mechanics method according to the selected mechanics theory. The second one is the numerical method, using finite element method through simulation to obtain the stiffness. The third one is to measure it directly through the experiment.
The research ideas of this section: first use mechanical analysis and finite element simulation to solve the diaphragm coupling axial stiffness separately and then measure the actual axial stiffness of diaphragm coupling through experimental measurement (Figure 5); furthermore, comparatively analyze the axial stiffness obtained from theoretical deduction and simulation to find the best solution to solve the stiffness value of diaphragm coupling in others directions.

Solving idea of diaphragm coupling stiffness.
Solving results
In Table 1, x is the amount of deformation in the stiffness experiment. Fully binding, slippery, binding, and no separation are the contact types of diaphragm group. As shown in Figure 6, when the diaphragm group is bent and deformed, it is unknown whether there is a binding relationship or a relative slip relationship between the diaphragms.
Comparative analysis of diaphragm group axial stiffness solution methods.

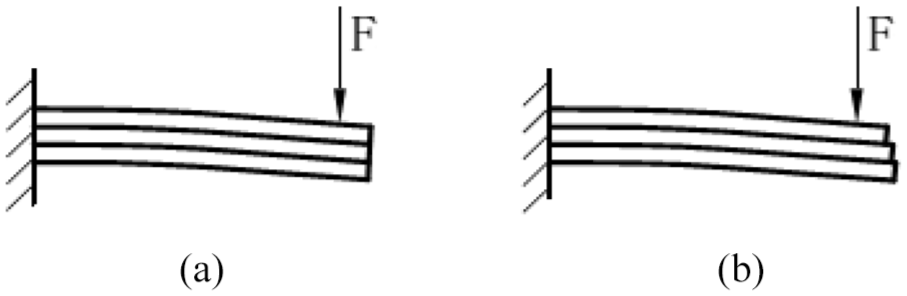
Motion relationships between diaphragms.
A simple comparison shows that the axial stiffness of the diaphragm group obtained from the application of material mechanics is quite different from the experimental one, which is very unreasonable. Through comparing the finite element simulation results and the experimental results, it can be seen that the simulation results are in good agreement with the experimental results. And compared with the result of the linear fitting, the error value is only 10.63 N/mm when the contact type between diaphragms is defined as “no separation.” Therefore, the finite element simulation method can be chose to solve the other stiffness values of the diaphragm group.
Derivation of additional load function
The stiffness solved above is static stiffness which is the ability to resist deformation under static load. In actual conditions, the diaphragm coupling may work under dynamic load, so it is necessary to study the coupling dynamic stiffness. The harmonic response analysis of the Workbench can just solve the dynamic stiffness. The value of the axial dynamic stiffness is between the experimental measurement value and the simulated value. Therefore, in this article, the dynamic stiffness and static stiffness can be considered equal. Ignoring mass and damping matrices of which the magnitude is far below the stiffness values, the misalignment model can be further simplified to yield an additional load expression

where
Substituting the corresponding deformation of the axial misalignment, radial misalignment, angular misalignment, and synthesized misalignment into equation (2), we can get the additional load generated in various conditions and sort them as shown in Table 2.
Additional load generated from four conditions.

In Table 2,
Misalignment characteristic analysis and misalignment condition monitor
Misalignment characteristic analysis
Rotary shaft misalignment force model
Misalignment can result in additional load caused by diaphragm group deformation. The additional load acts on the end of the rotary shaft through the coupling. The force model of the rotary shaft is shown in Figure 7.

Additional loads on the rotary shaft: (a) axial misalignment, (b) radial misalignment, (c) angular misalignment, and (d) synthesized misalignment.
As can be seen from Figure 7, except that the size and direction of the additional load caused by axial misalignment is constant, the other types of misalignment will produce a cyclical additional load, of which the size and direction change with the rotation angle varying. From the perspective of excitation, the additional load on the test bench is a kind of cyclical internal excitation, this internal excitation will cause vibration phenomenon, and the vibration signals of different excitations are not same. Therefore, the vibration signal is a misalignment characteristic signal.
Diaphragm coupling has two driving bolts and two driven bolts, which causes the additional loads always appear in pairs, and the direction of additional load changes in real time. To study the characteristics of vibration signals caused by misalignment excitation, the additional loads need to be synthesized first. And then it should be decomposed along the fixed coordinate system. At this time, the excitation characteristics in different directions are obtained. Definition of coordinate system direction could refer to Figure 4: z is the axis direction, x is the horizontal direction, and y is the vertical direction.
Excitation generated from misalignment
In Table 3,
Excitation generated in four misalignment conditions.
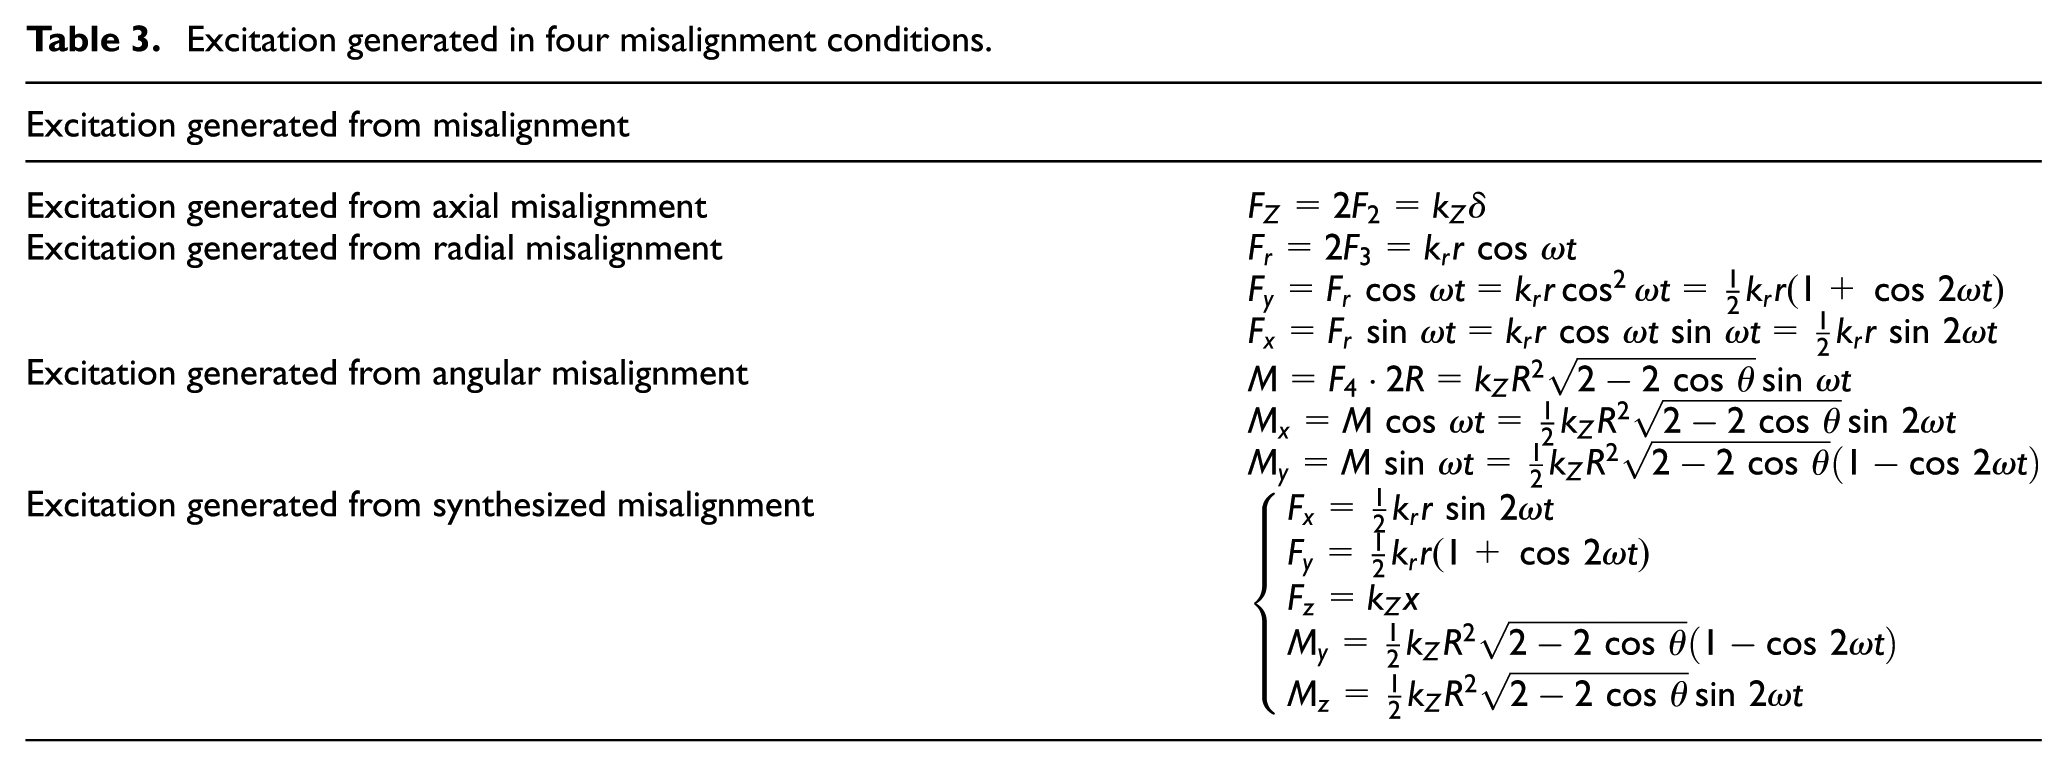
To sum up, radial misalignment, angular misalignment, and synthesized misalignment will make the rotating shaft generate double speed frequency (double frequency), and the magnitude of the excitation is positively related to the misalignment. Therefore, by monitoring the vibration signal in the horizontal direction and the vertical direction of the rotating shaft and analyzing the frequency components, we can judge whether there is a misalignment malfunction.
Other types of rotor system malfunction can also produce double frequency vibration, such as rotor cracks and rotor friction. Therefore, only one kind of characteristic signal such as a vibration signal is not enough to judge whether there is a misalignment. Different additional loads can result in different deformations of the rotating shaft. When monitoring the axis track of some point on the rotating shaft, it can be seen that axis tracks caused by different types of misalignment malfunction are not same. Therefore, the axis track can be used as another characteristic signal of misalignment malfunction. So vibration and axis track are selected as the characteristic signal of misalignment malfunction.
Characteristic signal monitoring
When measuring the vibration signal of the rotating shaft, the two-point laser displacement sensors are mounted on the same cross-section with a separated angle of 90° to measure the radial run-out of the shaft journal. At the same time, the axis track is obtained by measuring and synthesizing the two radial run-outs which are perpendicular to each other on the same cross-section of the rotating shaft. Therefore, the axis track and the vibration signal can be obtained by the same measuring system, as shown in Figure 8.

Vibration signal and axis track measuring system.
Although the two signal sources are obtained from one same measuring system, there is a great difference in the subsequent data processing. Vibration analysis is to denoise the two displacement signals first, then do spectrum analysis, and finally observe the relationship between the frequency, amplitude, and various types of misalignment malfunction. However, axis track analysis is to denoise the two displacement signals first, then synthesize them to get the axis track of the rotating shaft, and finally observe the relationship between the axis track and various misalignment malfunctions.
Since the original signal without noise reduction contains a lot of noise and the axis track is disorganized, the regularity of axis track cannot be seen at all. In this article, the denoising method based on wavelet adjacent coefficient is chose to purify the axis track.
Experiment and data analysis
This section studies the characteristics of all kinds of misalignment by comparing experiments and proves the correctness of the theoretical analysis in the previous sections. Based on this, the influence of rotation speed on the above two characteristic signals is also studied.
Experiment platform
Experiment platform for this experiment is shown in Figure 9, and we select the rotation axis of the motorized spindle as the vibration signal measurement position.

Misalignment experiment platform.
In order to analyze the relationship between the typical malfunction signals (vibration, axis track, and noise) and the misalignment values, it needs to design multiple sets of contrast experiments. Starting from the type of misalignment malfunction to conduct group experiments, the experiments are divided into four major conditions: good alignment condition, radial misalignment condition, angular misalignment condition, and synthesized misalignment condition.
In order to explore the impact of rotation speed on the axis track and noise, in each working condition, experiments are subdivided into low rotation speed and high rotation speed; the low rotation speed is about 1000 r/min and the high rotation speed is about 5000 r/min.
Before studying the characteristic signals generated from various misalignment conditions on test bench, it is necessary to know the specific value of the misalignment error in the specific misalignment condition in order to establish the one-to-one corresponding relationship between the characteristic signals and the misalignment values. Therefore, this section firstly introduces the misalignment error experiment, and then introduces the characteristic signal experiment (noise and axis track) and its data analysis.
Misalignment error measurement experiment
This article has done four kinds of experiments in different conditions, and chose laser alignment instrument, used the standard 3-12-9 three-point alignment method to measure the error between the shafts in different conditions. All the data in Figures 13–16 are counted into the same table; in Table 4, the angle error value refers to the tangent value of the angle. (Note: The design index of alignment error on test bench is
The alignment error in various conditions.

Vibration and axis track experiment
Experiment scheme
Experiment scheme is shown in Figure 10. Laser displacement data acquisition interface is shown in Figure 11. Experiment scene is shown in Figure 12.

Experimental scheme.

Laser displacement data acquisition interface.

Experiment scene.
Experiment results and data analysis
Specific processing steps of axis track experiment data are as follows:
Filter and denoise, using the wavelet adjacent coefficient denoising method to filter the original signal;
Synthesize the axis track, synthesizing the horizontal data and the vertical data filtered;
Spectrum analysis, using Fast Fourier Transform (FFT) to analyze the filtered data.
The specific experiment results are shown in Figures 13–18.

Frequency spectrum in the X direction at the speed of n=1000r/min.
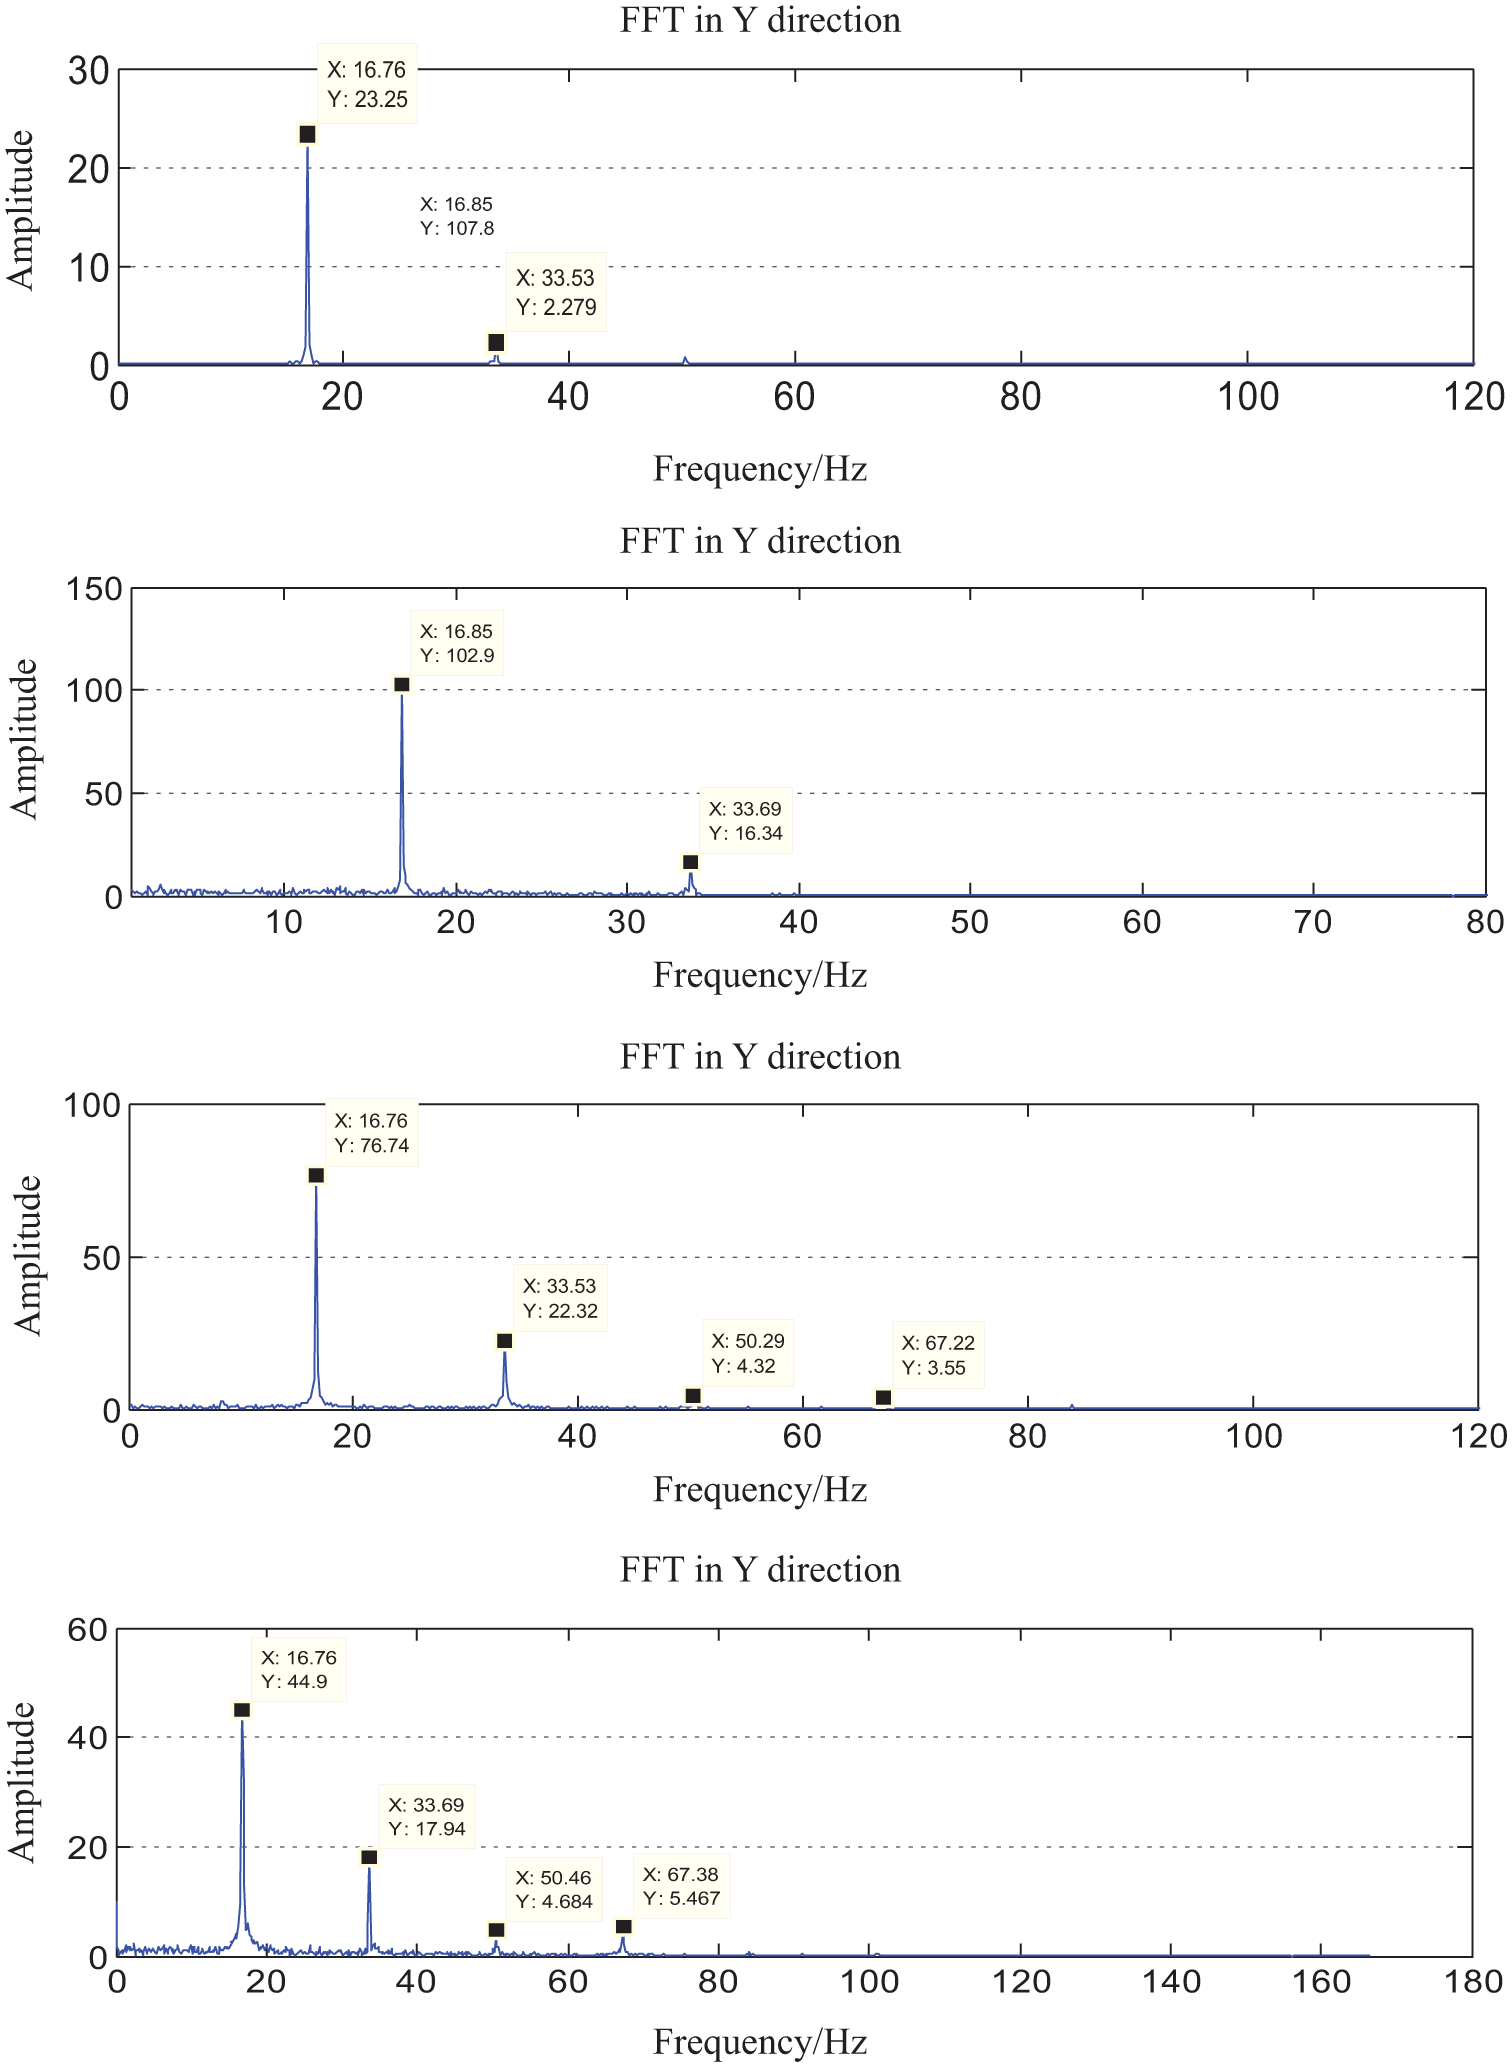
Frequency spectrum in the Y direction at the speed of n=1000 r/min.
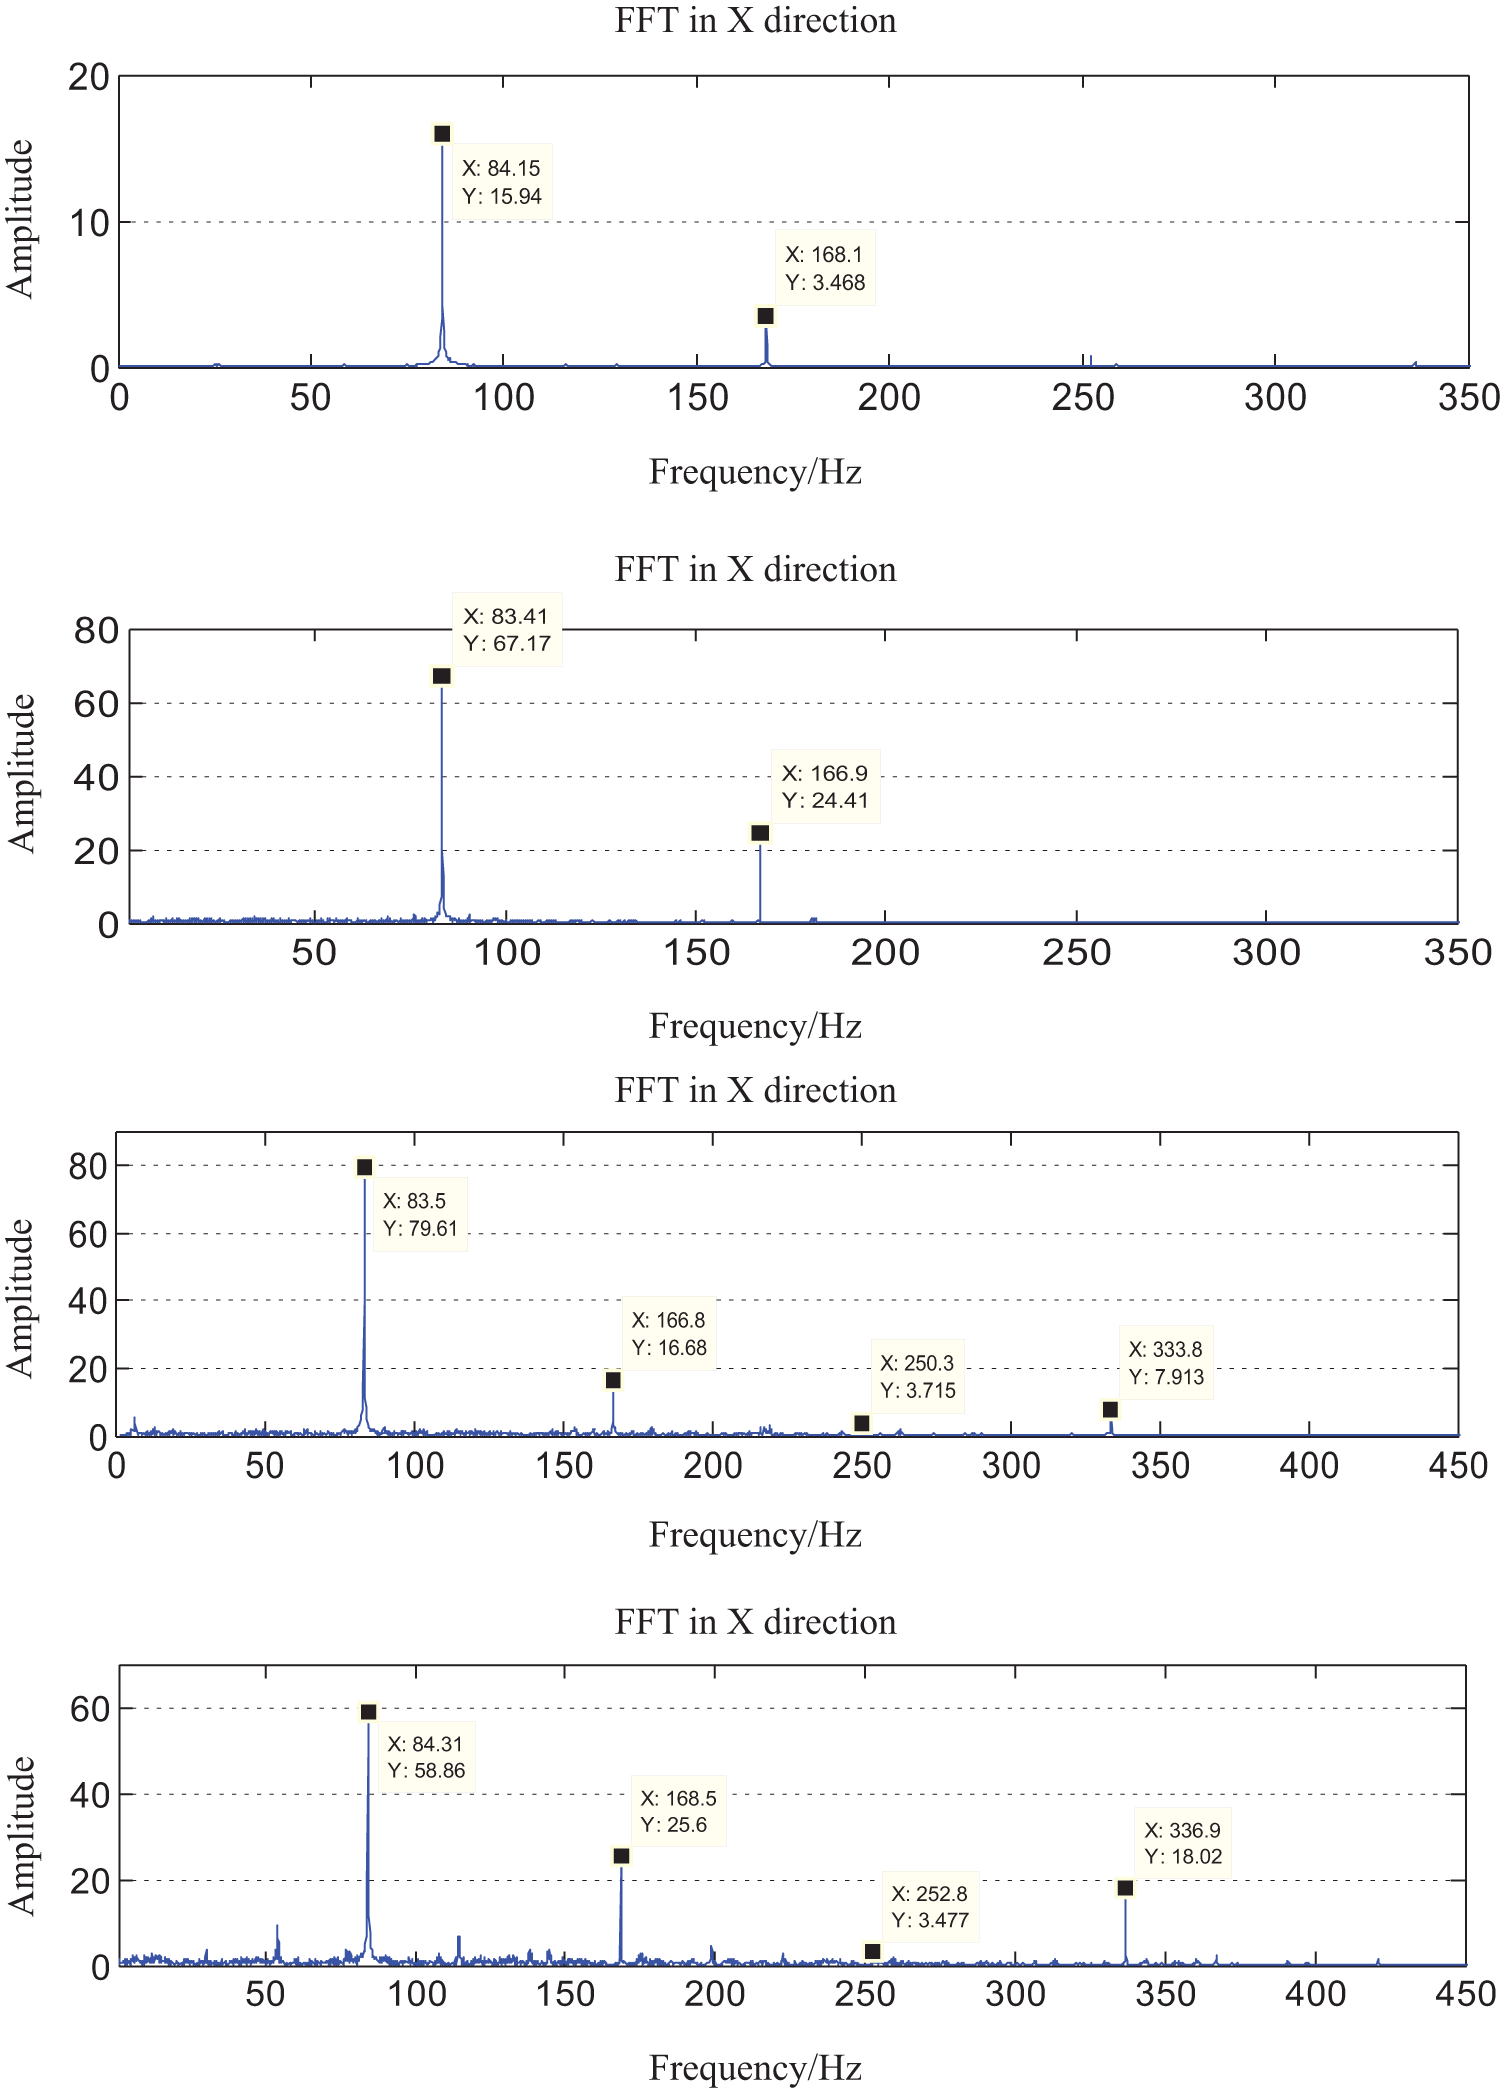
Frequency spectrum in the X direction at the speed of n=5000 r/min.

Frequency spectrum in the Y direction at the speed of n = 5000 r/min.

Axis track at the speed of n = 1000 r/min.

Axis track at the speed of n = 5000 r/min.
As shown in the figures, there are frequency spectrum and axis track after wavelet denoising, respectively, at the lower and higher rotation speed of the rotating shaft, in good alignment, radial misalignment, angular misalignment, and synthesized misalignment four different conditions. A comprehensive analysis can draw the following conclusions:
In frequency spectrum analysis, misalignment malfunction is easy to generate frequency multiplication. In order to make it more intuitive, count all the data in Figures 13–16 into the same table (Table 5). Slashes in Table 5 indicate that the amplitude is too small or zero at the point. From the data in the figures and table, it can be seen that there are amplitudes in all conditions at the point of work frequency and double frequency and they are obvious. Compared with other misalignment conditions, the amplitudes at the point of work frequency and double frequency are smaller in the good alignment condition. In the angular misalignment condition, there will be obvious triple frequency and quadruple frequency components, and even it will generate higher frequency multiplication components in the serious synthesized misalignment condition. From this conclusion, we can prove the theory obtained in section “Misalignment characteristic analysis and misalignment condition monitor” that radial misalignment, angular misalignment, and synthesized misalignment will cause double rotating speed frequency (double frequency) vibration of the rotating shaft.
Different kinds of misalignment malfunction have different axis tracks, which are expressed as follows: for good alignment condition, the axis track is characterized as an oval shape (close to a circle shape); the axis track of the radial misalignment is characterized as a “D” shape which is just like a flattened circle; the axis track of angular misalignment is characterized as a “ ” shape which just like a letter S and semicircle combination, the axis track of synthesized misalignment deforms more seriously, which shows a shape like “8.”
Through the contrast between the axis track at the speed of 1000 and 5000 r/min, it can be found out that rotating speed also affects the shape of the axis track. In good alignment condition, as the rotating speed increases, the radial run-out of the rotor becomes larger, especially in the horizontal direction, and the axis track deforms slightly at high rotating speed. However, in the misalignment condition, when the rotating speed is high, the range of rotor motion will become larger, the axis track will deform more severely, become disordered, and generate poor repeatability.
Frequency amplitude in various conditions.

Conclusion
According to the relative positions between the two axes of the two shafts, there are four types of misalignment condition when the diaphragm coupling is working: axial misalignment, radial misalignment, angular misalignment, and synthesized misalignment. When there is misalignment between the left and right couplings, the diaphragm will deform to compensate for the misalignment value, and the diaphragm will generate force after deformation which will become external excitation acting on the driving and driven spindle.
When there is axial misalignment and angular misalignment between the left and right semi-coupling, the diaphragm will generate bending deformation. When there is radial misalignment, the diaphragm will generate tension and compression deformation. Moreover, the deformation of the diaphragm caused by radial misalignment and angular misalignment changes with time, but the deformation of axial misalignment remains constant.
The kinematic parameters of the diaphragm additional load involved are mainly axial stiffness and radial stiffness. The axial stiffness can be solved by experiment measurement and finite element method, and the results agree with each other extremely which proves the applicability of finite element method. However, the radial stiffness is difficult to be solved by experiment measurement method, so Workbench is used to solve this problem. According to harmonic response analysis, static stiffness and dynamic stiffness are considered equal in this article. Neglecting the mass matrix and damping matrix which are much lower than the stiffness matrix, the mathematical model of the diaphragm group is greatly simplified. Finally, the additional loads generated in various kinds of misalignment conditions are obtained.
Different misalignment conditions correspond to different vibration characteristics and axis tracks so that vibration and axis tracks can be used as characteristic signals caused by misalignment.
The specific phenomenon is as follows: for good alignment condition, the axis track is characterized as an oval shape (close to a circle shape); the axis track of radial misalignment is characterized as a “D” shape which is just like a flattened circle; the axis track of angular misalignment is characterized as a “” shape which just like a letter “S” and semicircle combination, the axis track of synthesized misalignment deforms more seriously, which shows a shape like “8.”
Through spectrum analysis, it can be found that there are amplitudes in all conditions at the point of work frequency and double frequency and they are obvious. Compared with other misalignment conditions, the amplitudes at the point of work frequency and double frequency are smaller than those in the good alignment condition. In the angular misalignment condition, there will be obvious triple frequency and quadruple frequency components, and even it will generate higher frequency multiplication components in the serious synthesized misalignment condition.
Footnotes
Handling Editor: Zengtao Chen
Declaration of conflicting interests
The author(s) declared no potential conflicts of interest with respect to the research, authorship, and/or publication of this article.
Funding
The author(s) disclosed receipt of the following financial support for the research, authorship, and/or publication of this article: This article was supported by National Science and Technology Major Project (research and capacity building of functional component test): 2016ZX04004007, JLU Science and Technology Innovative Research Team Program (JLUSTIRT), and Science and Technology Project in Education Department of Jilin Province (JJKH20180133KJ).