
Abstract
Mid-story isolation eccentric structures with tower–podium are examples of vertically irregular structures. Its seismic performance and the related mechanisms, however, have not been experimentally examined. In this study, a representative model of a practical mid-story isolation eccentric structure with a large podium was fabricated, tested, and simulated to investigate its seismic response under different earthquakes. The results were then compared to those of an anti-seismic model without the isolation layer. The results show that (a) the mid-story isolation eccentric structure with tower–podium has the similar characteristics of seismic performance with the regular story isolation structure; (b) as the peak acceleration value increases, the podium could quickly enter the elastoplastic state and reach the medium damage level. The damage extent in the second layer of the podium is larger than that in its first layer. It is thus recommended that the structural components of the podium be strengthened, and the elastoplastic displacement angle limit of the podium be increased. The modeling results also indicate the torsional effects of such eccentric structure are effectively inhibited. Our study enhances the understanding of the mid-story isolation eccentric structure with tower–podium and pioneers a guide to the seismic design of such a structure.
Keywords
Introduction
Single-tower or multi-tower structures with a large podium at their base are examples of an eccentric structure. This type of structure is a popular construction form that can be used for providing a large open space for commercial uses such as parking lot and hotel lobbies. According to the Code for seismic design of buildings, 1 a tower–podium structure is defined as a vertically irregular structure, and there is an abrupt change in the stiffness and shear stress between the bottom of the tower structure and the top of the podium. It has been shown that earthquake-induced damage occurs mainly at structure locations where the vertical stiffness changes abruptly. 1 A mid-story isolation system has recently been developed by which an isolation layer with a relatively small stiffness is inserted underneath the tower to alleviate potential damage caused by the abrupt change in stiffness and shear stress between the tower and podium.1–3 As reported by the Code for seismic design of buildings, 1 the tower–podium structure has become the main structure type where the mid-story isolation system is applied. 1
The mid-story isolation system has been investigated theoretically in a variety of studies over the last decades. According to these studies, the application of mid-story isolation system is further employed in buildings and serves as an effective seismic isolation system.2–5 In the story isolation system, the isolation layer is inserted between two adjacent stories, so that this system can be divided into three parts, that is, the isolation layer, the superstructure above the isolation layer, and the substructure below the isolation layer. The isolation system is designed to reduce the seismic response of superstructure above the isolation layer and keep the seismic response of the substructure below the isolation layer constant or less, and thus, the seismic response of the whole structure could be reduced by the isolation system. The main design parameters that affect the seismic performance of the inter-story isolated eccentric structures include the mass ratio of the superstructure above the isolation layer and the substructure below the isolation layer, frequency ratio, and damping ratio of the isolation layer. 6
Analytical approaches for calculating the optimal parameters of a mid-story isolation system were formulated by Zhou et al. 7 to optimize the design of the isolation system. Zhang et al. 8 and Forni et al. 9 suggested that the design of isolation layer needs to be optimized to not only minimize the acceleration response of the structure and the relative displacement of the isolation layer but also reduce the difficulty of constructing the isolation structure and designing the tubes resulting from the connection between the isolation layer and the structures above and below it. The construction of the isolation system is simpler than that of the base isolation system. For example, the isolation groove is easier to construct, although the elevator shaft in the vertical direction of the structure needs to be suspended from the superstructure above the isolation system. Zargar et al. 10 and Tsai 11 suggested that the substructure below the isolation layer in an elevator shaft should have general space to avoid the collision as the relative displacement of the isolation layer is large.
Previous studies12–14 proposed a three-rigid-panel model to analyze and calculate the seismic response and spatial vibratory characteristics of the inter-story isolated eccentric structure. Figure 1 shows this calculation model, which has the following assumptions: (a) The floor is rigid in the plane, while its stiffness is negligible outside the plane. (b) Only the torsional vibration caused by the eccentricity between the center of mass and the center of stiffness is considered. (c) The vertical and rotational components of earthquake motion are neglected.

Three-rigid-panel model.
In Figure 1, md, mb, and mu respectively represent the mass of substructure below the isolation layer, isolation layer, and superstructure above the isolation layer; kd and ku represent the elastic lateral stiffness of the substructure below the isolation layer and the superstructure above the isolation layer; Kb represents the effective lateral stiffness of isolation layer; cd and cu represent the viscous damping coefficient; cb represents the equivalent damping coefficient. The two-way eccentricity between superstructure and substructure is considered. Each rigid panel has two horizontal translational degrees of freedom (x, y) and a torsional degree of freedom (

where the displacement
The vibratory characteristics and seismic response of the regular mid-story isolation system were also numerically analyzed by previous studies.12–18 The following results have been obtained: (a) The story isolation technology is capable of reducing the seismic response of the superstructure above the isolation layer and dramatically decreases the peak shear force at the substructure below the isolation system. (b) The seismic performance with regard to the peak acceleration and displacement response at the substructure below the isolation system undergoes a minor change. (c) The overall seismic response of the structure is not dependent on the stiffness of substructure below the isolation system. Qi et al. 6 and Earl 19 conducted shaking table tests to study the isolation performance of regular mid-story isolation structures with isolation systems at different stories. The above results consistently showed that the isolation performance is good for the superstructure above the isolation system; while the lower the isolation layer is inserted into the structure, the better isolation performance the entire structure has. In addition, the isolation performance of the substructure below the isolation layer is poor. Li et al. 20 pointed out that the existing studies mostly focus on regular mid-story isolation structures, and they investigated the dynamic responses of an irregular mid-story isolation structure, namely an eight-story building with a podium. The results showed that (a) The isolation performance of a mid-story isolation structure was slightly worse than that of a base-isolated structure. (b) The isolation performance of the superstructure above the isolation layer was much better than that of the substructure below the isolation layer. (c) The lower the isolation layer, the better the isolation performance on the entire structure. (d) The shear force value at the structure element where stiffness was abruptly changed was found to be relatively large, indicating the top of the podium should be strengthened. JL Almazán and JCDL Llera 21 analyzed the effect of eccentricities on the seismic response of the mid-story isolation structure. The results showed that the lateral–torsional coupling effects between the superstructure above the isolation layer and the substructure below the isolation layer have no significant change after the installation of the isolation layer. Du and Jia 22 and Zhou et al. 23 investigated the seismic response of the mid-story isolation structure, base isolation structure, and the anti-seismic structure without an isolation system; the results showed that the isolation system reduced the lateral–torsional coupling effects of the structure, and compared to other two types of structures, the mid-story isolation system is better in reducing the lateral–torsional coupling effects.
The above literature review shows that there is little theoretical research on irregular mid-story isolation structures and no experimental research on the mid-story isolation eccentric structure with tower–podium. Therefore, in this article, a simplified and scaled model of a single-tower mid-story isolation eccentric structure with a large podium at its base was fabricated for experimental studies. The seismic response of the structure and stress characteristics of the podium under different test conditions were examined. A shaking table test and a numerical simulation were carried out in the test, and their results were compared. Our results can be helpful to guide the seismic design of mid-story isolation structures with a large podium.
Design of structural model
Description of the prototype model
The hotel with large chassis is a typical form of mid-story isolation eccentric structure with tower–podium. Most of these high-rise buildings are frame structures. The shear deformation occurs at the superstructure above the isolation layer when the aspect ratio of the superstructure is less than or equal to 3. The first mode of the structure is a translational model. A typical layout of this type of prototype structure is shown in Figure 2.
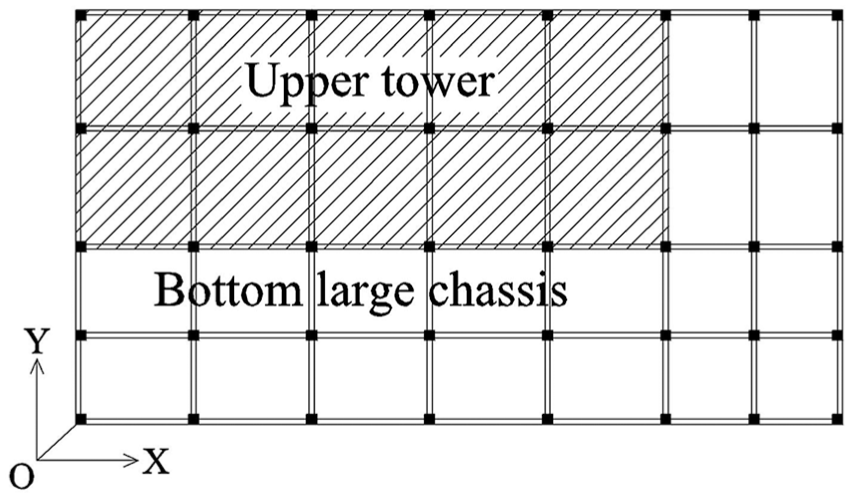
The layout of the prototype structure (top view).
The prototype structure with two-story podium has a long side of three spans (X-direction), a short side of two spans (Y-direction), a story height of 4.9 m, a column grid dimension of 7 m×7 m and 7 m×5.25 m. The tower with six stories has a long side of two spans, a short side of one span, a story height of 3.5 m, a column grid dimension of 7 m×7 m, and a total height of 30.8 m. The design of two-story podium and six-story tower of the structure can maintain the parameters (frequency ratio, mass ratio) of the superstructure above the isolation layer and the substructure below the isolation layer within a reasonable range.1–3,14 The plane area ratio of the tower to the podium is 1:2.4, and the ratio of the tower’s height to width is 1:3 (Y-direction). These parameters are designed to meet the requirements of the stress characteristics and conditions of a high-rise structure with a large podium.
The main design information of the prototype structure is as follows: fortification intensity of 8°, peak acceleration of 0.20g; site classification II; characteristic period of 0.35 s; standard live load of the floor is 3.5 kN/m2; main frame column size of 700 mm×700 mm (podium), 500 mm×500 mm (tower); frame beam 300 mm×700 mm; concrete strength grade C35; isolation floor thickness is 160 mm; thickness of other floors is 110 mm. The isolation layer is set at the bottom of the tower, and six isolation rubber bearings are installed. The rubber shear modulus is 0.392 N/mm2, the four columns in the corner are lead rubber bearings (LRBs), the two columns in the middle are linear natural rubber bearings (LNRs) with a diameter of 600 mm, and a vertical surface pressure range of 6–10 MPa, and rubber bearings are not subjected to tensile stress.
Design of the structural model
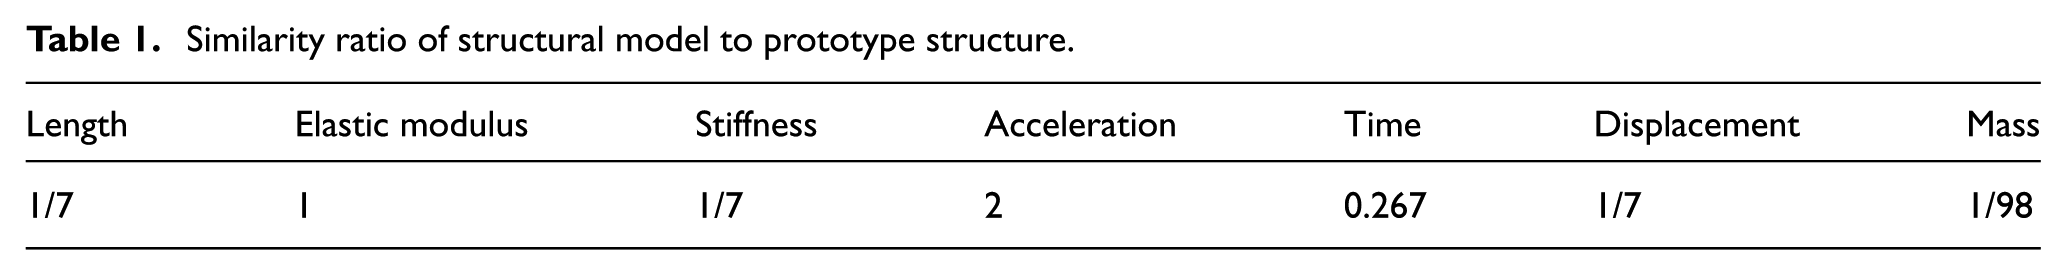
Based on the above prototype structure, a simplified and scaled model was fabricated for the shaking table test. The length similarity ratio is set to 1:7 considering conditions such as the size of the shaking table of 4 m×4 m and its maximum working load limit of 22 tons. Table 1 shows the similarity ratios of the structural model to the prototype structure.
Similarity ratio of structural model to prototype structure.
The long side of the podium (X-direction) of the testing structure has three spans with a story height of 0.70 m and has two spans in the short side of the podium (Y-direction). The long side (X-direction) and short side (Y-direction) of the tower have two spans and one span, respectively. The tower has six stories with a story height of 0.50 m. The steel structure frame was constructed followed by casting concrete floors. The beams and columns were made of GB-L80×5 and GB-L100×8 angle steel, respectively. The extra story mass was added by increasing the thickness of the concrete floor (200 mm), and the mass of the entire structural model was approximately 16.30t. The tower and the podium were prepared separately and were connected by a pre-embedded connection tray and bolts. Figure 3 shows the top view and front view of the scaled structural model.
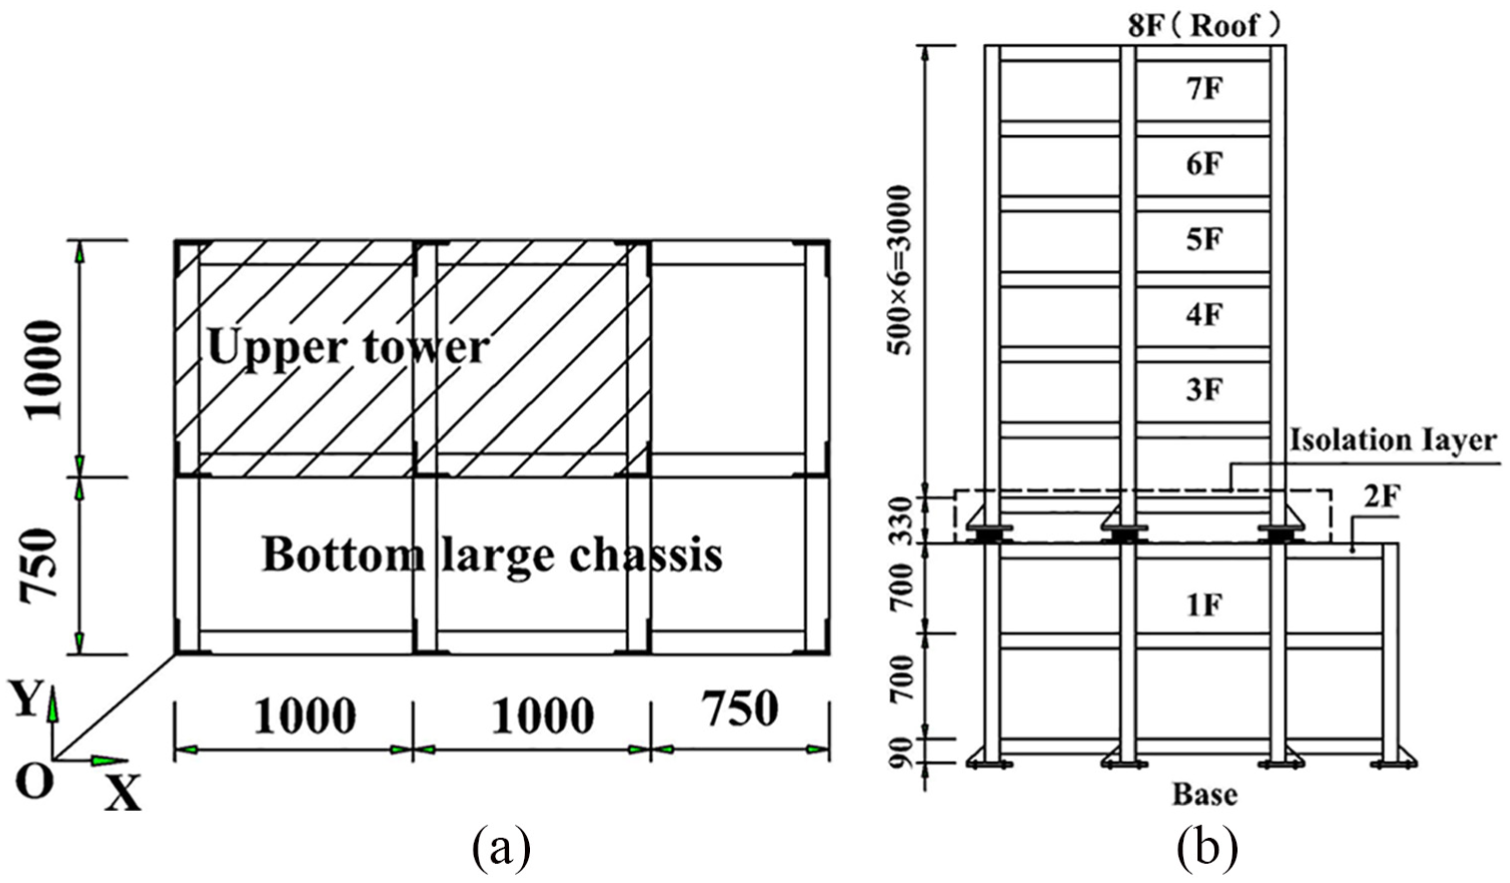
Illustration of the structural model: (a) top view and (b) front view.
The FEA model of prototype structure and model structure was established for modal and harmonic response analysis. The comparison showed that the vibration characteristics of the two are basically in a similar relationship. Especially, the error of the first three modal frequency values was less than 5.6%, indicating that the prototype structure and model structure in the finite element computing environment are of high similarity in vibration characteristics.
Installation of isolation layer and design of isolation rubber bearings
The horizontal equivalent stiffness (rubber shear strain γ = 100%) of each LRB and LNR in the prototype structure is 1.49 and 1.12 kN/mm, respectively, and the horizontal stiffness of the isolation layer is 8.19 kN/mm. The selection of isolation bearings with a diameter of 100 mm considers the fabrication reliability and the target displacement of less than 35 mm. According to the similarity theory, the horizontal stiffness of the isolation layer in the scaled model was calculated as 1.17 kN/mm. Figure 4 shows the layout of isolation rubber bearings.

The layout of the isolation rubber bearings.
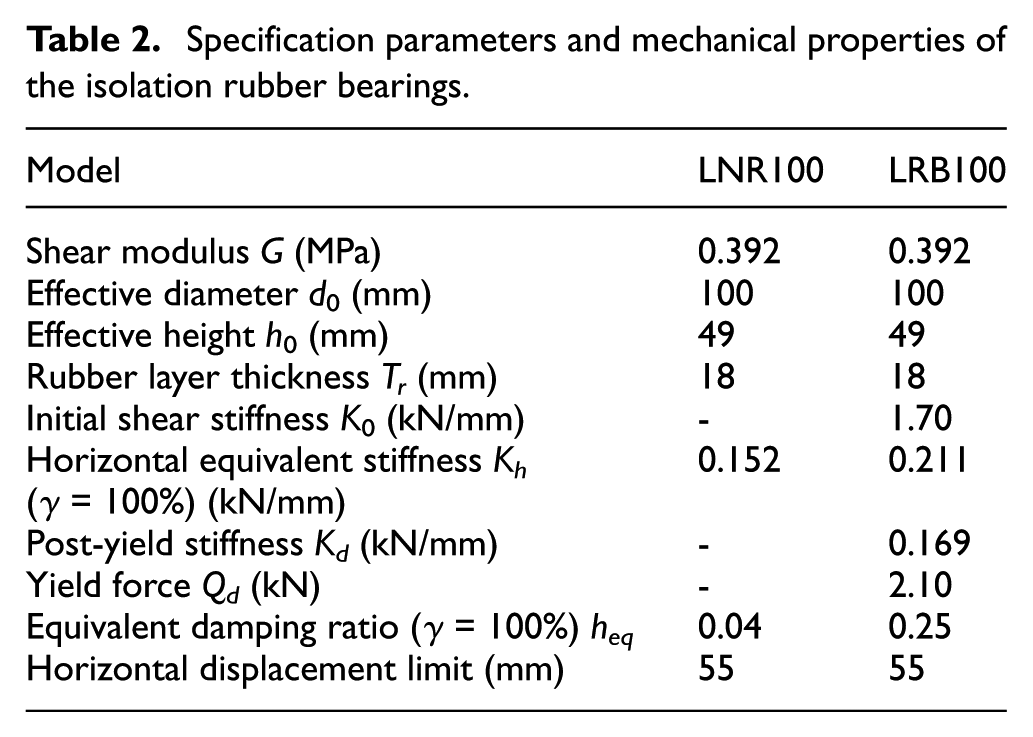
The specification parameters and mechanical properties of the isolation rubber bearings are shown in Table 2, and a cross-section diagram and a photograph of an isolation rubber bearing are shown in Figure 5.
Specification parameters and mechanical properties of the isolation rubber bearings.
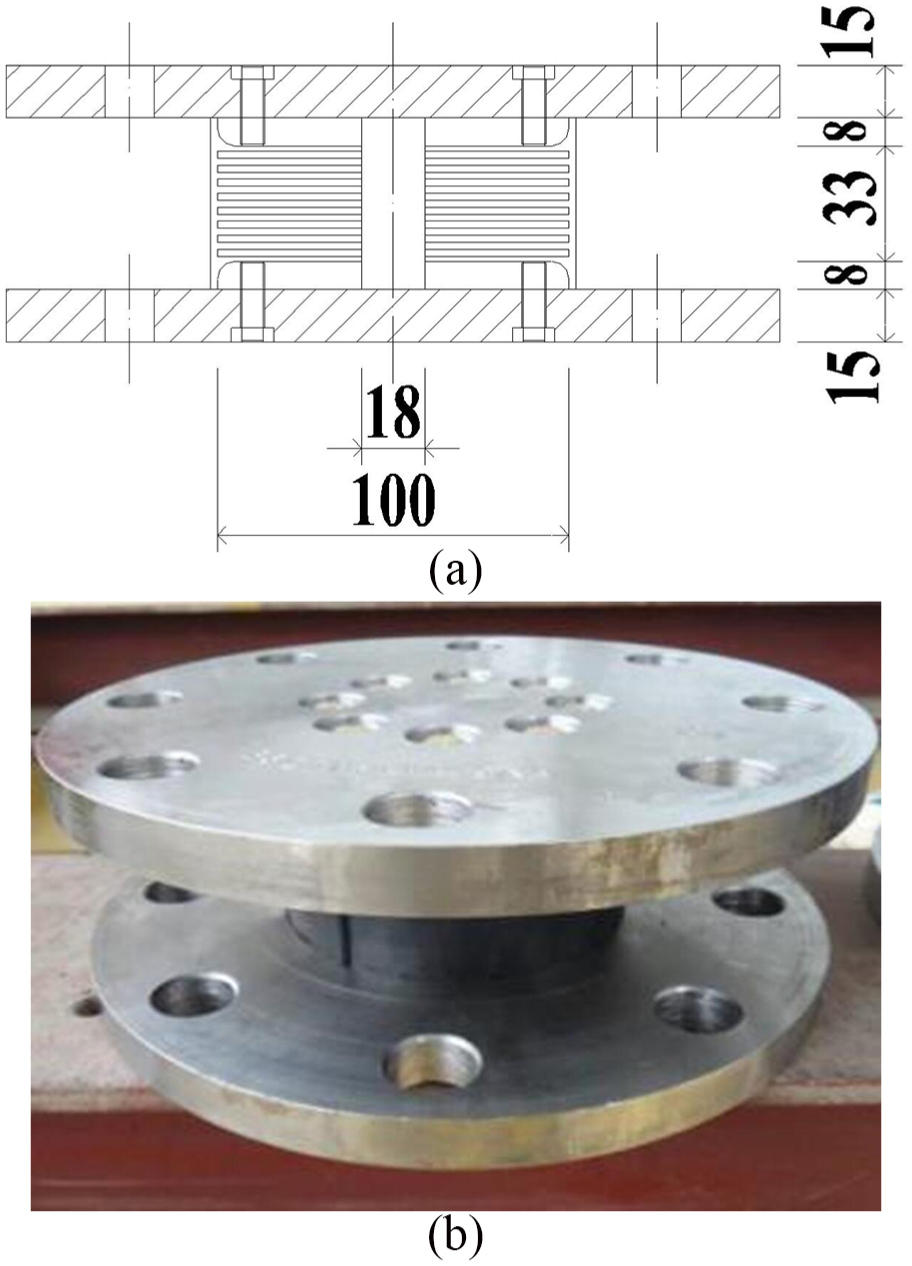
Isolation rubber bearing: (a) cross-section diagram of isolation rubber bearings and (b) photograph of a typical isolation rubber bearing.
The inter-story stiffness and the stiffness ratios between tower and podium are calculated and shown in Table 3. Note that the value of inter-story stiffness of the isolation layer was corrected after an isolation bearing test was performed.
The inter-story stiffness of the structural model.

Numerical analysis of the structural model
Numerical model
The finite element analysis (FEA) software PERFORM3D 24 was used to perform a dynamic elastoplastic simulation of a three-lumped-mass structural model, which can be inelastic. The three-dimensional FEA model is shown in Figure 6. The model elements, the steel material constitutive model, and the material strength are described as follows:
Element model: Considering the calculation efficiency and analysis accuracy, the columns and beams of the frame adopt the fiber model and plastic hinge model, respectively. The plastic hinge adopts the moment–curvature model to calculate the component yield stress, moment, and curvature when the component reaches its maximum bearing capacity. 24
Only the elastic deformation of isolation rubber bearings with the same tension and compression stiffness is considered in the vertical direction. The strength loss and stiffness hardening due to the shear deformation in the isolation bearing are ignored in the horizontal direction, and the performance in the horizontal direction is not affected by the vertical force. The LNR adopts a linear elastic model with horizontal control parameters being described by equivalent stiffness; the LRB uses a bilinear restoring force model with horizontal control parameters of stiffness before yielding and after yielding as well as yield force. Based on the above assumptions, the real stress characteristics of the rubber bearing can be simulated.
The constitutive model of steel material: The bilinear kinematic model is used, 24 and the stiffness ratio is 0.01 after the steel yields. This bilinear model can reasonably determine the stress–strain relationship and thus can accurately simulate the mechanical properties of the steel material.
The constitutive model of concrete material is the Kent–Park model, considering the degradation of concrete hysteresis energy but not its tensile strength. The tensile strength is not considered because the floor is mainly used as the additional mass, causing no effect on the simulation results.
The steel is Q235, the concrete strength grade is C35, and the material strength is set to the standard value.
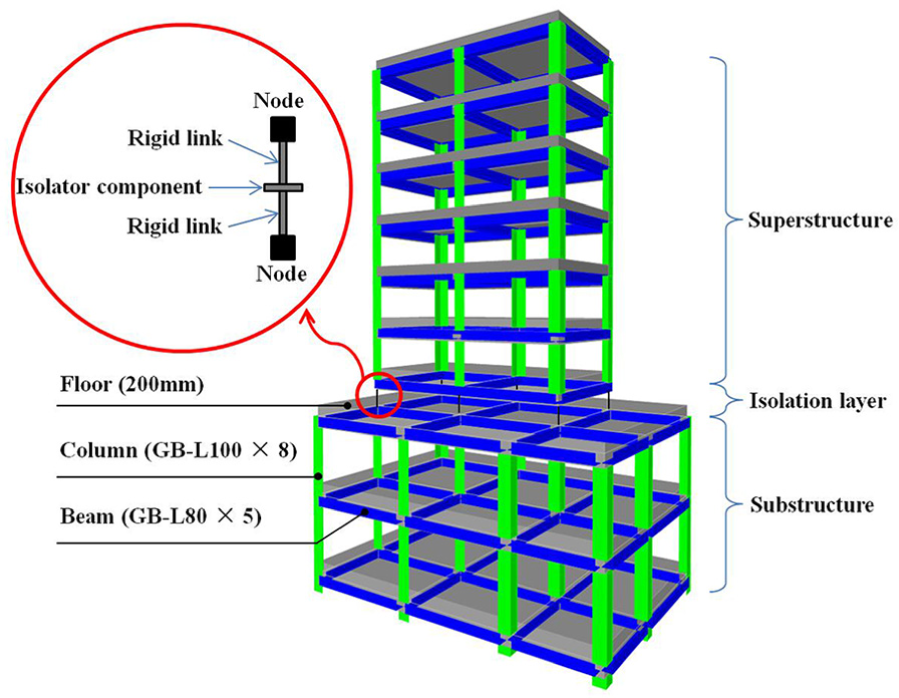
FEA model.
Selection of seismic waves
Four earthquake waves were selected from the strong earthquake database of the Pacific Earthquake Engineering Research (PEER) Center, and the test and numerical analysis were then conducted based on these data. Among these four waves, there are three strong waves: Taft, El Centro, and Tar-Tarzana earthquake waves, which suit type II sites; the other wave was an artificial seismic wave (Rgbtongan), commonly used for testing structures in China.25,26 The characteristics of the four seismic waves are shown in Table 4, and the acceleration time histories and the acceleration response spectra are shown in Figures 7 and 8, respectively.
Details of the seismic waves.

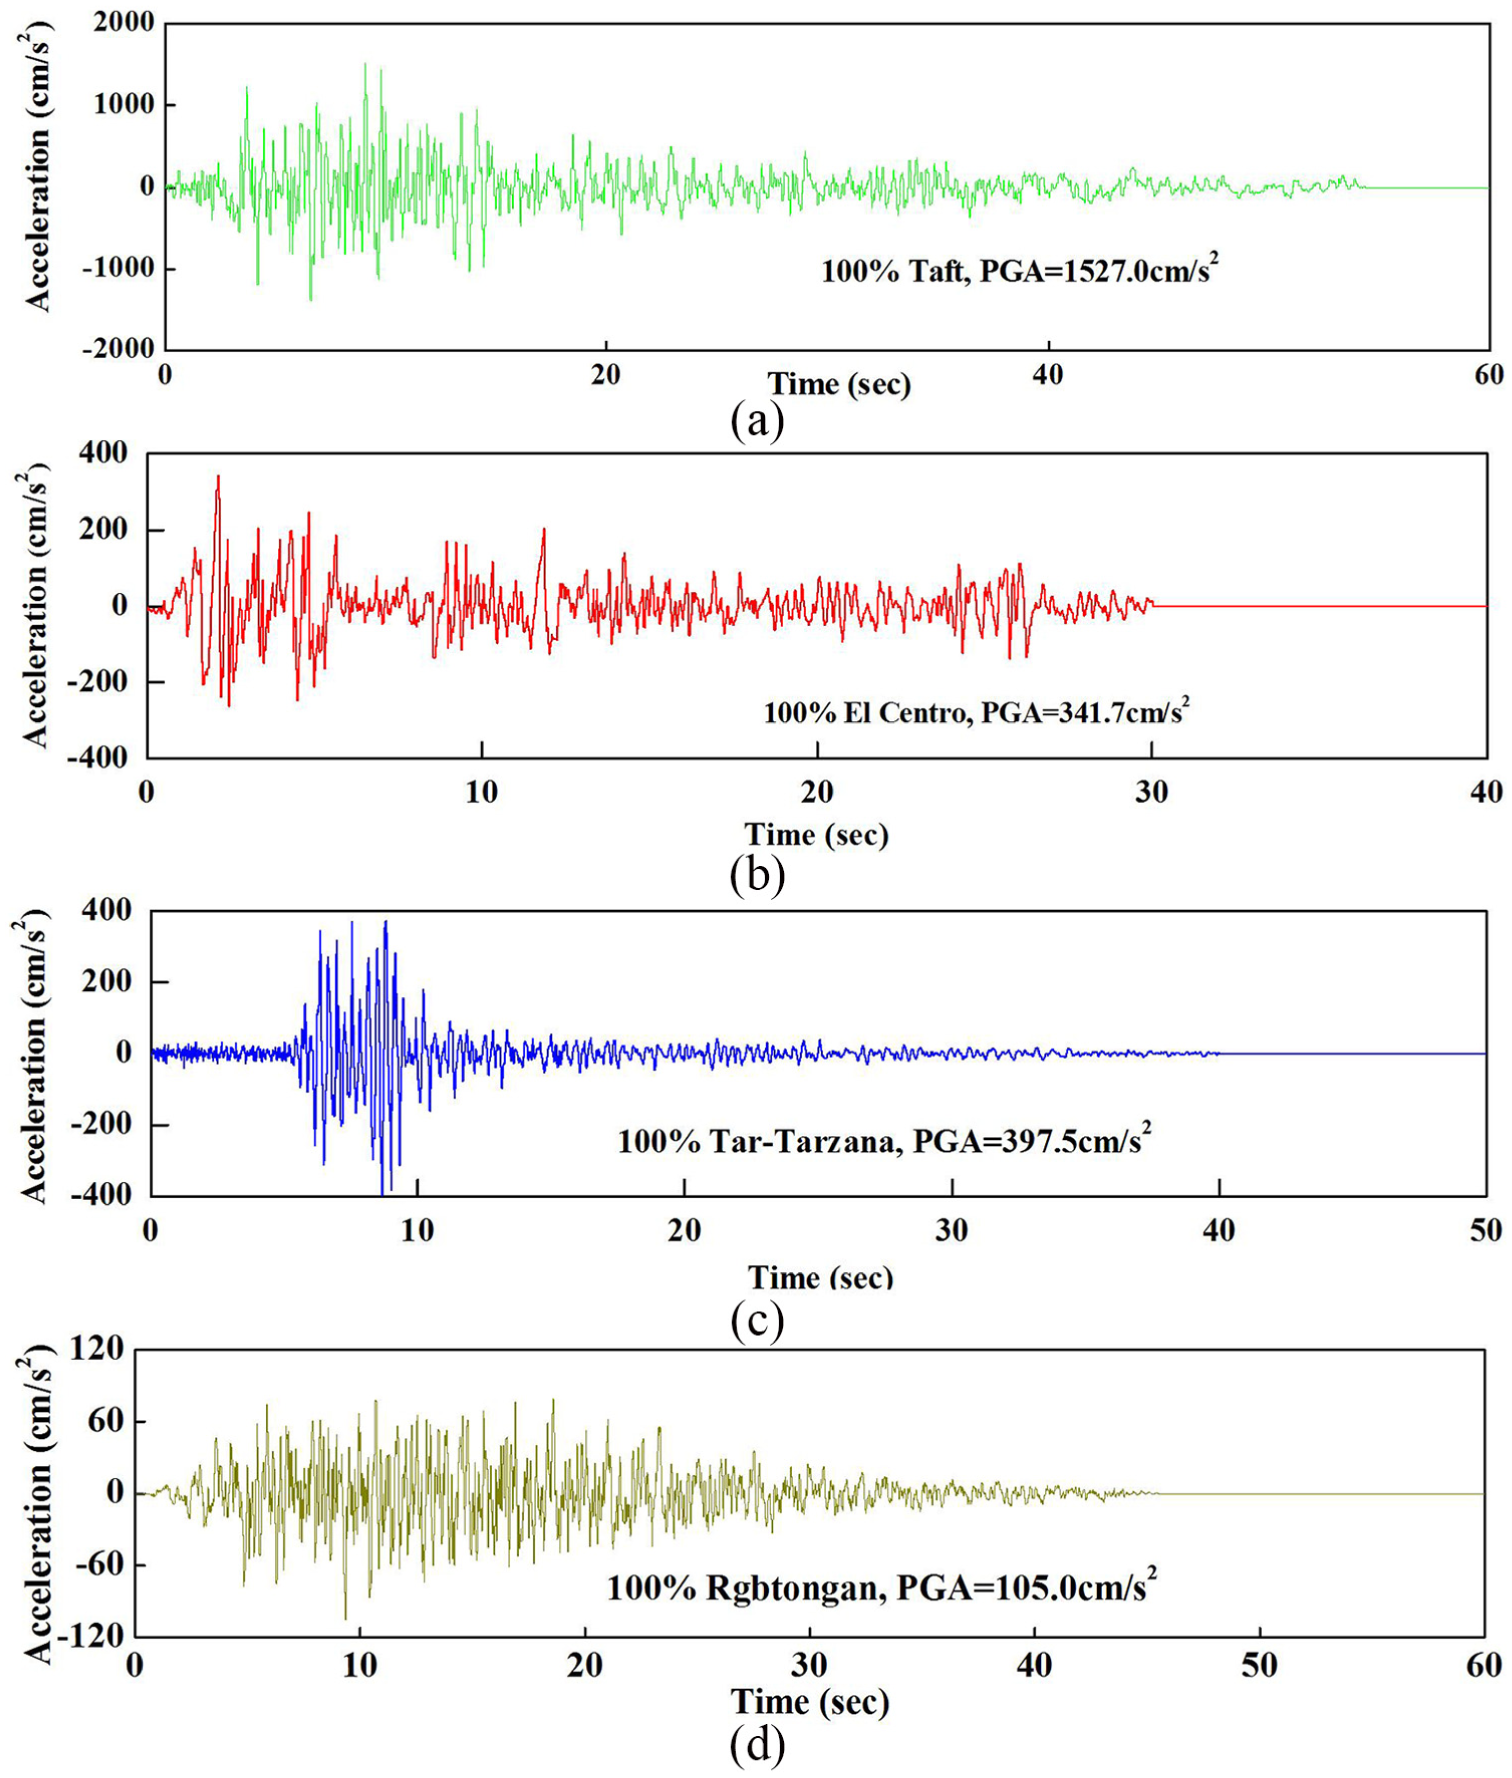
Acceleration histories of input earthquakes: (a) Taft, (b) El Centro, (c) Tar-Tarzana, and (d) Rgbtongan.

Acceleration response spectra.
The seismic waves were input in two directions in shaking table test and were compressed and modulated according to the frequency similarity and amplitude similarity; the peak accelerations are 0.40g and 0.60g.
Results of numerical analysis
Through modal analysis, the natural vibration periods of the anti-seismic model and mid-story isolation model are obtained as 0.368 and 1.115 s, respectively. The latter is three times the former; thus, the vibration isolation target is achieved.
To examine the seismic response of the structure, three important indexes including absolute acceleration, story drift, and inter-story torsional angle are used. Also, a vibration decreasing ratio is defined as

where
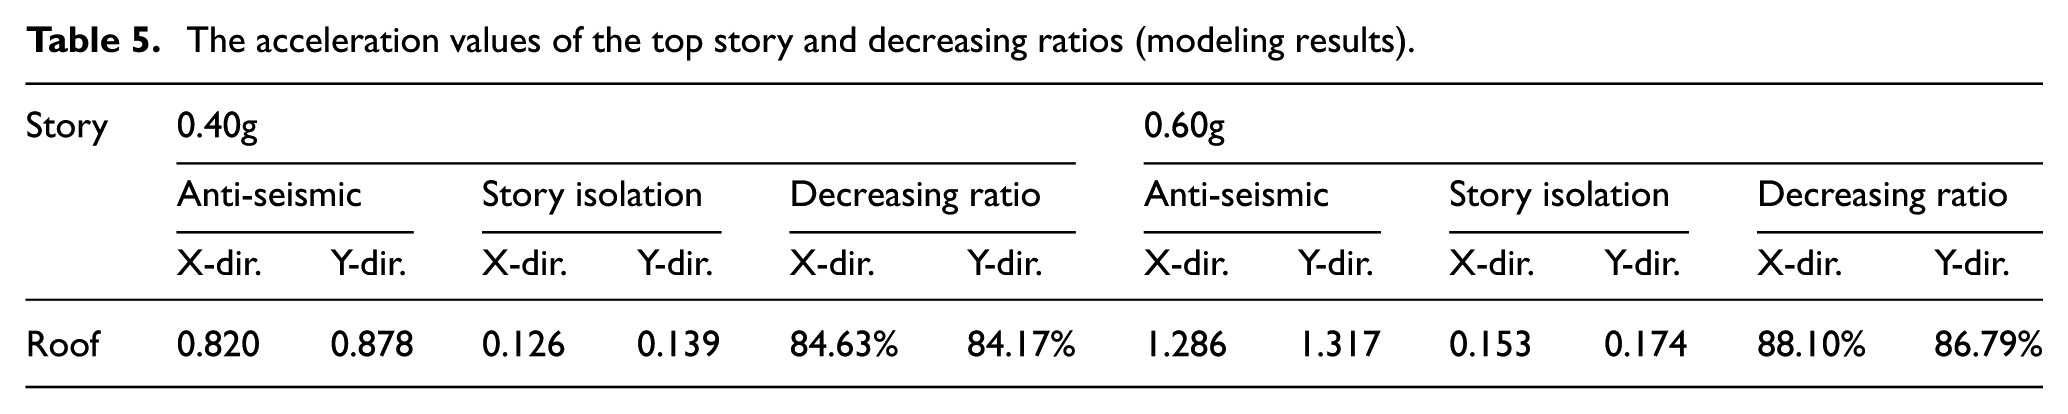
To demonstrate the acceleration response of each story under the different peak accelerations, the response accelerations and the corresponding decreasing ratio for each story of the anti-seismic and mid-story isolation model in X and Y directions are obtained. Table 5 shows the acceleration values at the top story (as a reprehensive of each story) and the corresponding decreasing ratios.
The acceleration values of the top story and decreasing ratios (modeling results).
To compare the seismic response of the anti-seismic model and the mid-story isolation model subjected to a seismic wave, Figure 8 shows the acceleration values of different stories of the two models in X and Y directions when the peak acceleration is 0.60g.
As shown in Table 5 and Figure 9, under the peak acceleration of 0.60g, the acceleration decreasing ratios for the tower of the anti-seismic model in X and Y directions are both larger than 80%, indicating an excellent damping effect when the isolation system is used. The results also show that the story acceleration value of the isolation layer changes abruptly, and the acceleration values of the top story have no amplification effect. The decreasing ratios are between −13.29% and −15.80% (X-direction) and between −13.33% and −18.93% (Y-direction) at various podium stories. These figures indicate that the acceleration response of the podium is not reduced after the addition of the mid-story isolation system but slightly increased.

Acceleration of floors in (a) X-direction and (b) Y-direction (0.60g).
To demonstrate the story drift response, Table 6 shows the story drift of the anti-seismic model and the mid-story isolation model in X and Y directions as well as their differences. The data for the fourth to seventh stories are not shown because the tower deforms mainly in the translational motion form.
Story drift response of different stories and the decreasing ratios (numerical analysis).

To compare the story displacement response of the anti-seismic model and the mid-story isolation model subjected to a seismic wave, Figure 10 shows the story displacement of different stories of the two models in X and Y directions when the peak acceleration is 0.60g.

Comparison of story displacement in (a) X-direction and (b) Y-direction (0.60g).
As shown in Table 6 and Figure 10, under the peak acceleration of 0.60g, the story drift decreasing ratio for the mid-story isolation tower model is between 83.89% and 86.63% (X-direction) and between 80.98% and 84.53% (Y-direction). The decreasing ratio values decrease with increasing tower height, and the values in the Y-direction are slightly higher than those in the X-direction. The displacement of the entire tower shows a translational motion form. On the other hand, the displacement decreasing ratio of the podium is between 10.56% and 16.67% (X-direction) and between 13.62% and 16.73% (Y-direction); these small changes indicate a negligible damping effect.
To compare the torsional response, the torsion angles at each story of both structures are shown in Table 7. The results showed that the inter-layer torsion angle of the isolation model is approximately 1/3 of that of the seismic model, indicating that the damping effect on the structure torsion is significant. While the torsion angle between the tower floors is negligible, that is, about 0.00005, showing no torsion effect on the tower. However, the torsion angle of the isolation layer is large. The torsion angle of the floor increases slightly with the increase of the floor, and the tower is approximately translational; thus, the torsion of the tower is effectively inhibited. The above results indicate the torsional response of the mid-story isolation eccentric structure with tower–podium can be significantly reduced using story isolation technology.
Structural inter-story torsional angle (rad).

Shaking table test
Horizontal property test of the rubber bearings
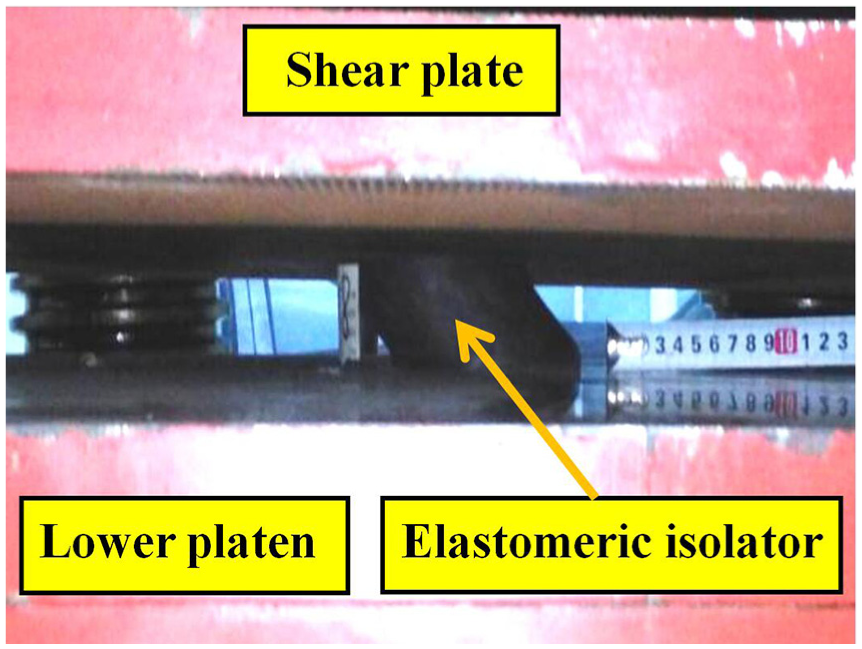
Taking into consideration the small diameter of the rubber bearings, a horizontal property test was performed using an YJW-1000 computer-controlled pressure shear testing machine. Two rubber bearings, considered as one group, were placed above and below the shear platen. The shear deformation was caused by the horizontal movement of the shear platen, and the shear platen tension was collected by the acquisition system of the machine. The displacement of the rubber bearing was measured using the displacement device on the top of the shear platen. The vertical pressure during the test was set to the surface pressure of the rubber bearing (6 MPa), and the axial compressive stress was maintained constant during the test, as shown in Figure 11.
Pressure shear test of the rubber bearings.
By performing pressure shear test on a series of rubber bearings, four LRBs and two LNRs with stable mechanical performance were selected for shaking table test. Their horizontal properties were measured during the pressure shear test. The average horizontal equivalent stiffness (rubber shear strain γ = 100%) of the LRBs and LNRs was 0.23 and 0.167 kN/mm, respectively. The hysteresis curve of the rubber bearings is shown in Figure 12. The real lateral stiffness of the rubber bearings is thus 1.25 kN/mm, which is 6.40% lower than the theoretical value of 1.17 kN/mm obtained through similarity theory, so that these rubber bearings could be used in the model test.

Hysteresis curve of rubber bearings: (a) LRB and (b) LNR.
Shaking table system and data acquisition
The main technical parameters of the shaking table system are as follows: table size 4 m × 4 m, load capacity 22t, three-directional shaking, maximum acceleration 1.50g with full loading condition, displacement ±250 mm, eccentric moment 110 kN m, and overturning moment 600 kN m. A shaking table system with these parameters can meet the test requirements.
The JM5958 three-array test system was used in the data acquisition, including software and hardware, using a data acquisition box with 64 signal channels. The acceleration responses of the roof floor and the displacements of the isolation layer were measured. The evaluation of these values are important as the high acceleration and displacement values could cause the overturn of the structure or the excessive displacement of rubber bearings.
The acceleration and story displacement in X and Y directions of the isolation system and isolation layer are recorded by the acquisition system. The layout of the sensors is as follows:
Two accelerometers in the X and Y directions (one in each direction) are placed at the mass center of each model story.
A total of 20 DH610 magneto-electric accelerometers are arranged on each of the 10 floors, from the shaking table to the roof floor of the model.
The cable length of the accelerometer is large enough to accommodate its displacement when it passes through the isolation layer; two displacement sensors in the X and Y directions (one in each direction) are placed on each of the 10 floors. A total of 20 NS-WY06 cable-actuated displacement sensors are placed on the model, with one end of the displacement sensor fixed on the stent and the other end fixed on the steel column of each floor of the model. The story displacement is equal to the measured displacement of each floor minus the displacement of the shaking table.
Fabrication of structural model
The tower and the podium were fabricated separately and were connected by pre-embedded connection trays and bolts. To ensure safety during testing, the diameter and number of connecting bolts were increased in the model design, because the tower bottom of the anti-seismic model may have generated a large overturning moment.
The bottom connection tray was pre-embedded in the tower bottom of the mid-story isolation model and was connected to the upper connection tray through the bolts. The bottom connection tray was then connected to the pre-embedded steel plates on the top surface of the podium. The bottom of the podium was then bolted rigidly to the top surface of the shaking table. For the anti-seismic model, the pre-embedded steel plates at the bottom of the tower were bolted to the top surface of the podium. Figure 13 shows the configurations of the completed mid-story isolation model and the anti-seismic model.

Test models: (a) mid-story isolation model and (b) anti-seismic model.
Selection of the seismic waves and test condition
The seismic waves were the same ones used in the numerical simulation in section “Numerical analysis of the structural model.” They were input in two directions during the shaking table test, and the peak accelerations of each seismic wave were adjusted to 0.40g and 0.60g. The model test was conducted first on the mid-story isolation model and then the anti-seismic mode. A total of 16 test conditions were carried out in this experiment.
Test results and analysis
White noise (0.10g) was input into the models to test the natural vibration characteristics of each model. The natural vibration period of the two models that were obtained by modal analysis is compared to the values obtained from the numerical analysis, as shown in Table 8.
Natural vibration period of the models.

Error = (test value – numerical analysis)/test value × 100%.
Period ratio = mid-story isolation model period/anti-seismic model period.
Table 8 shows that the error of the natural vibration period of the models is small, indicating that the test model has a minor fabrication error, and thus can be used for the subsequent test.
2. The two models were subjected to various seismic waves under peak accelerations of 0.40g and 0.60g. The acceleration values of the mass center of each story were measured, and the acceleration decreasing ratios were calculated, as shown in Table 9.
Story acceleration of different stories and the decreasing ratios (test results).

As shown in Table 9, under the peak acceleration of 0.60g, the acceleration decreasing ratio for the mid-story isolation tower model is larger than 80% (X-direction and Y-direction), indicating an excellent damping effect when the isolation system is used. There is no acceleration amplification response in the podium of the model. Meanwhile, the decreasing ratio of the podium is between −13.15 and −22.90% (X-direction) and between −12.69% and −24.07% (Y-direction), much lower than that of the tower. These figures indicate that the isolation mechanism of the mid-story isolation eccentric structure with a large podium is similar to a regular mid-story isolation structure.3–6,13–19
3. Table 10 shows the story drift, story drift decreasing ratio, and story drift angle in the X and Y directions.
Story drift, its decreasing ratio and story drift angle of different stories (test results).

As shown in Table 10, under the peak acceleration of 0.60g, the story drift decreasing ratio for the mid-story isolation tower model is larger than 80% (X-direction and Y-direction), indicating an excellent damping effect on the tower. Meanwhile, the displacement decreasing ratio of the podium is between 17.02% and 23.65% (X-direction) and between 15.53% and 17.15% (Y-direction). These figures indicate that the isolation mechanism of the mid-story isolation eccentric structure with a large podium is similar to a regular mid-story isolation structure.3–6,13–19
Further analysis shows that the tower model is still in the elastic phase under the peak acceleration of 0.60g, and thus is not damaged. However, under the peak acceleration of 0.40g, the podium enters into the elastic–plastic stage, and under the peak acceleration of 0.60g, the story drift angle of the podium in the second story is already 1/251 (Y-direction). This value indicates that the podium has reached a medium damage level. The results also show that the story drift (Y-direction) of the podium at the second story is 1.10 times larger than that of the first story (2.791/2.537). Overall, the story drift angle of the podium is significantly larger than that of the tower stories.
Comparison of the test and numerical analysis results
Analysis of the acceleration response
Figure 14 shows the numerical and experimental results comparison of the acceleration response of the mid-story isolation model when the peak acceleration is 0.60g.

Comparison of the acceleration response of the mid-story isolation model in (a) X-direction and (b) Y-direction (0.6g).
The results show that the acceleration response characteristics of the test results closely match the numerical analysis results, indicating that the numerical analysis results are accurate.
Analysis of the story displacement response
Figure 15 shows the numerical and experimental results comparison of the story displacement response of the mid-story isolation model when the peak acceleration is 0.60g.

Comparison of the story displacement of the mid-story isolation model in (a) X-direction and (b) Y-direction (0.6g).
The results also show that the response characteristics of the numerical analysis results match well with the test results, although the test values are slightly lower than the numerical analysis values. The comparison indicates that the numerical analysis results are accurate.
Figures 14 and 15 further show that the curves of the acceleration and displacement response of the tower stories are almost straight lines without a sudden change during the test, and this phenomenon indicates that the entire tower shifts horizontally as a whole. The curves of the podium acceleration and story displacement response increase to the right; this is because the podium is rigidly connected with the base. Also, the seismic response of the podium of the mid-story isolation structure is similar to that of the anti-seismic structure.
Discussion and perspectives
The above test results and numerical analysis results first show that a tower with a large podium has a similar isolation mechanism as that of a base-isolated structure. The isolation performance depends on the isolation layer and the position of the isolation bearing. The podium is rigidly connected with the base, so the story acceleration and story drift of the podium showed little damping effect. Thus, the seismic response of the podium of the mid-story isolation structure is similar to that of the anti-seismic structure.
After an in-depth analysis of the shaking table test results, it has been found that the tower is still in the elastic stage under a peak acceleration of 0.60g, indicating a high-security level. Although the podium stiffness is larger than that of the tower, it enters into the elastic–plastic stage under a peak acceleration of 0.40g. The Y-direction story drift angle of the podium’s second story is 1/251, indicating a medium damage level. Thus, the stressed components of the podium stories should be strengthened. According to the Chinese code, the limit of the story drift angle of the podium is 1/100. However, this value should be increased considering that the podium would quickly enter into the elastic–plastic stage and deform soon after being subjected to a strong earthquake. In this way, the podium is stable, and then the whole structure is safe in a strong earthquake. According to the numerical simulation, the inter-story torsional angle at the podium of the mid-story isolation system is one-third that of the anti-seismic model. This result indicates that the torsional response of the model is suppressed by the isolation system and there is no torsional effect in the tower of the model.
Conclusion
In this article, numerical analysis and a shaking table test were conducted on a typical single-tower mid-story isolation eccentric structure with a large podium, and the vibratory characteristics and seismic response of the model were obtained. The following conclusions can be made:
The numerical analysis and shaking table test show that the isolation mechanism of the mid-story isolation eccentric structure with a large podium is similar to a regular mid-story isolation structure. The acceleration and story drift of each story of the tower decrease sharply, indicating that the isolation performance of the tower is excellent. The acceleration decreasing ratio for the podium increases slightly, while the story drift of the podium undergoes minor change, which indicates there is almost no damping effect in the podium.
It is suggested that the stressed components of the podium should be strengthened, and the limit of the elastic–plastic displacement angle of the podium should be increased to ensure the safety of the podium’s structure when it is subjected to a strong earthquake. It has been found that the tower model is still in the elastic phase under the peak acceleration of 0.60g, while the podium enters to the elastic–plastic stage under the peak acceleration of 0.40g and reaches a medium damage level under the peak acceleration of 0.60g. In addition, the story drift of the second floor of the podium (lower layer adjacent to the isolation layer) is larger than that of the first floor of the podium.
The numerical simulation shows that the torsional angle at the podium of the story isolation eccentric structure model decreases significantly, indicating that the isolation performance of the tower is excellent and there is no torsional response in the tower of the structure.
It is suggested that the mid-story isolation system should be used in tower–podium structures to significantly reduce the seismic response of the structure and to effectively alleviate the problems caused by the abrupt change in stiffness and shear stress between the tower and podium.
Footnotes
Handling Editor: Ali Kazemy
Declaration of conflicting interests
The author(s) declared no potential conflicts of interest with respect to the research, authorship, and/or publication of this article.
Funding
The author(s) disclosed receipt of the following financial support for the research, authorship, and/or publication of this article: The research work was supported by the National Natural Science Foundation of China (grant no. 51778149).