
Abstract
Global automakers are implementing strategies to increase the adoption of electric vehicles (EVs) due to environmentally friendly policies. While extensive research has been conducted on various aspects of EVs, there is a lack of understanding from the perspective of human factors that could impact EV usability. This study, therefore, aimed to fill this gap by identifying the distinct characteristics of EV users’ charging behaviors and varying needs across different user groups. Our extensive surveys gathered information about EV users’ socio-demographics and overall charging behavior. After preprocessing the data of 114 participants, we derived the “Minimum Charging Frequency (MCF)” index, the distance driven per month divided by the vehicle’s range. The average MCF was used to segregate participants into two groups, and we found statistically significant differences in several characteristics. This underscores the importance of human factors in several stakeholders regarding EVs to meet diverse user preferences better.
Introduction
In response to introducing and enacting environmentally friendly policies, global car makers are organizing strategies to phase out internal combustion engines while expanding the adoption of electric vehicles (EVs) (IEA, 2024). There is a voice of slowing growth (Automotive, 2024; Korst, 2024), especially in South Korea is in the Chasm (Herh, 2024) of Roger’s diffusion innovation model (Rogers et al., 2014). However, there are also positive analyses in Europe and the U.S. that this slowed growth is a temporary phenomenon (Valdes-Dapena, 2024).
Aligning with this EV diffusion, extensive research has been conducted on various aspects of EVs. Psychological factors, such as range anxiety stemming from concerns about running out of battery charge before reaching a charging station, influence the adoption and optimal infrastructure of charging stations (Bakker et al., 2011; Neubauer & Wood, 2014; Pevec et al., 2020). Technological research about increasing chargers’ performance and machine-learning-based predicting and optimizing power grids are also active fields (Amjad et al., 2018; Park & Moon, 2022).
However, little research directly addresses aspects of human factors. Much research has focused on technological aspects and the expansion of EV chargers in the early stages of technological innovation. The lack of usability of EV chargers could result in inconvenience and mismanagement of charging infrastructure (Bae et al., 2024; Kim et al., 2020). For instance, charging stations are often located in underutilized areas, left unmanaged, or equipped with less preferred charging speeds, leading to frustration among users (DeLollis & Justice, 2024). In addition, the purposes behind EV usage vary considerably among individuals (Franke & Krems, 2013), ranging from personal usage like commuting and leisure to commercial usage such as taxi and truck services (Fieltsch et al., 2020).
Hence, the objective of this study is to find out the distinct charging characteristics of EV users, focusing on driving distance and vehicle battery capacity. By identifying these differences, we aim better to inform the development and management of EV charging infrastructure, ultimately enhancing user satisfaction and facilitating the broader transition to electric mobility.
To accomplish our research objective, we conducted extensive surveys containing socio-demographics and overall EV charging behaviors. We hypothesized that the EV usage frequency (i.e., driving mileage per month) and the EV’s battery range are the main factors influencing charging behavior and experiences. So, we formed “Minimum Charging Frequency (MCF),” which reflects the minimum number of charging times. We categorized survey participants into two groups with MCF: those below average and those above average.
Focusing on differences between the two groups from survey data, we inspected various charging behavioral factors with two-sample proportion statistical tests. The factors include charging frequency, preferred types of charging speed (i.e., slow, fast, and rapid), battery percentage level of start and finish, and so on.
A total of 114 participated in the survey, excluding errored data. The average MCF was 1.26, which is the criterion for segregating participants into two groups. Several statistically significant disparities emerged between these groups concerning initiation battery levels for charging, preferred charging locations, and the charging frequency,
This study enabled us to categorize EV users into two groups using a simple index, providing several disparities between the distinctive groups. Despite utilizing identical electric vehicles and charging infrastructure, individuals exhibit diverse charging experiences and needs. This insight underscores the importance of tailoring chargers or related mobile applications to accommodate users’ characteristics.
Method
Participants
A total of 117 participated in the survey, and three were eliminated because they seemed unreasonable and regarded as errors. The demographics of the participants are shown in Figure 1. They were all EV users recruited from an online EV club and offered about $4 in compensation. The survey consisted of a total of 39 questions: basic demographics (7), EV charging behavior (13), EV charging inconveniences (7), EV charging culture (5), and general perceptions about EVs (7).
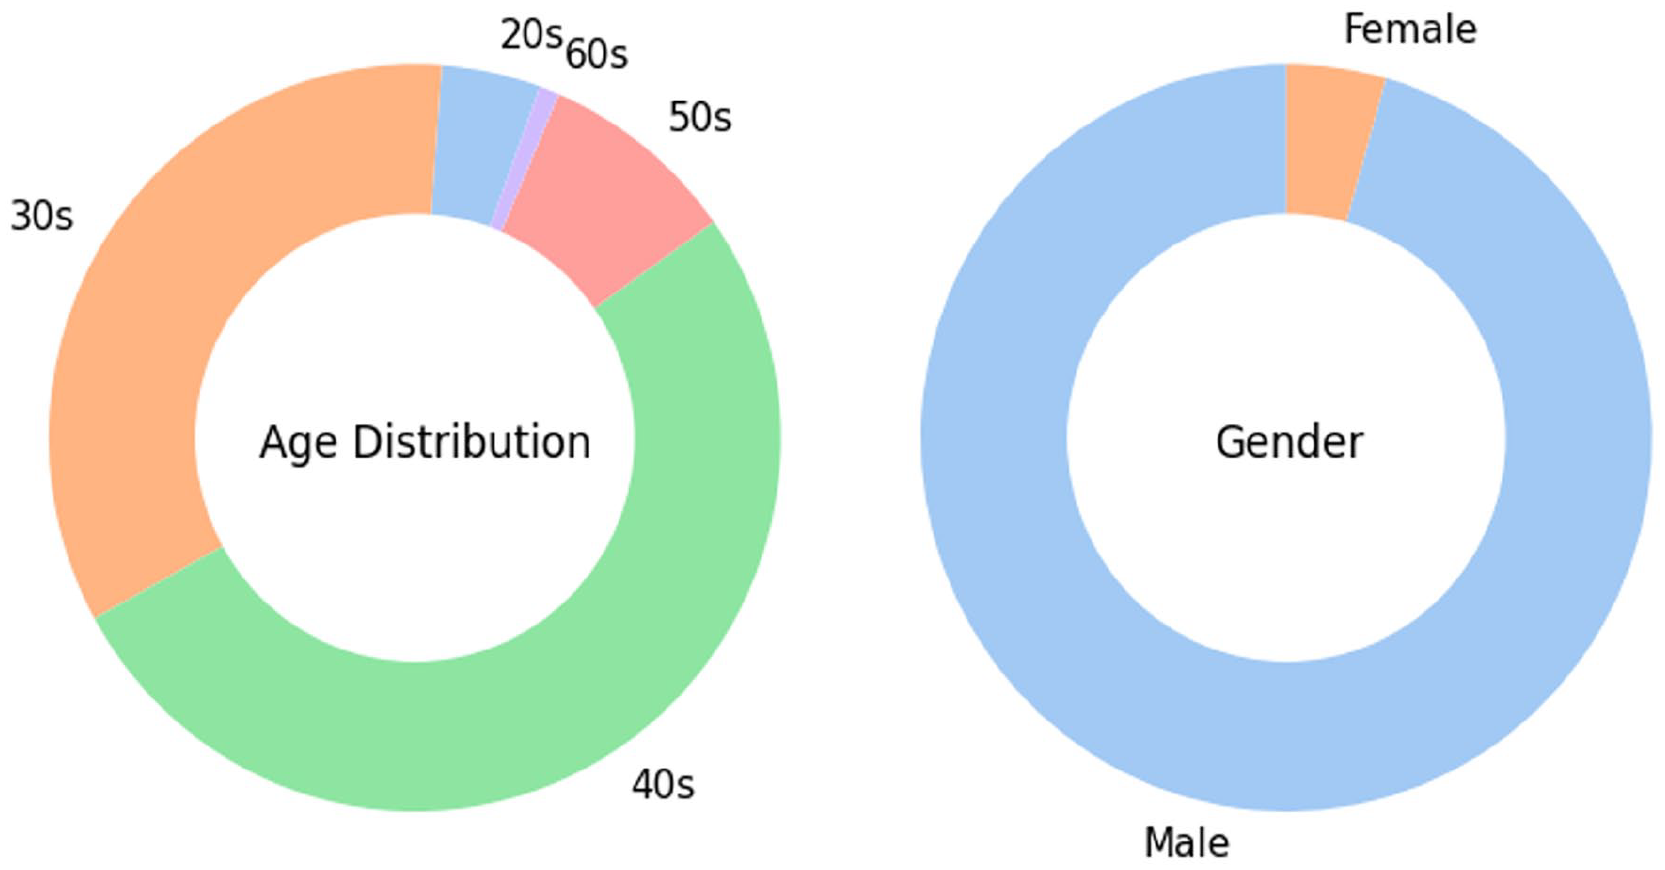
Demographics of the participants in the survey. Most of them were in their 40s (51.8%) and 30s (34.2%), and male (95.6%).
Minimum Charging Frequency (MCF)
“Minimum Charging Frequency (MCF)” is formed with two major factors influencing the charging influences, as shown in the following equation.

It reflects the minimum number of charging times per week. For example, an EV user drives 600 km per week (i.e., 2,400 km per month) and owns a Hyundai Ionic 6 model with a 600 km driving range. Then, the user’s MCF is 1.0, which will increase if he drives more, meaning he has to charge more than once weekly.
Analysis
We separated participants into two groups based on the average MCF: the low MCF group is below average, and the high MCF group is above average. We then performed a statistical analysis on these two groups. Normality was checked for each survey item, and Fisher’s exact tests were performed to check the difference in distribution between the two groups. A t-test was also conducted to examine the charging frequency differences.
Results
Overall Charging Behavior and MCF
Figure 2 shows the overall charging behavior across EV users. Users are labeled categorically, with “rand” for randomly charging with no specific criteria, “freq” for frequently charging whenever they saw an EV charger, and “n%” for starting charging at a particular (n%) battery level.
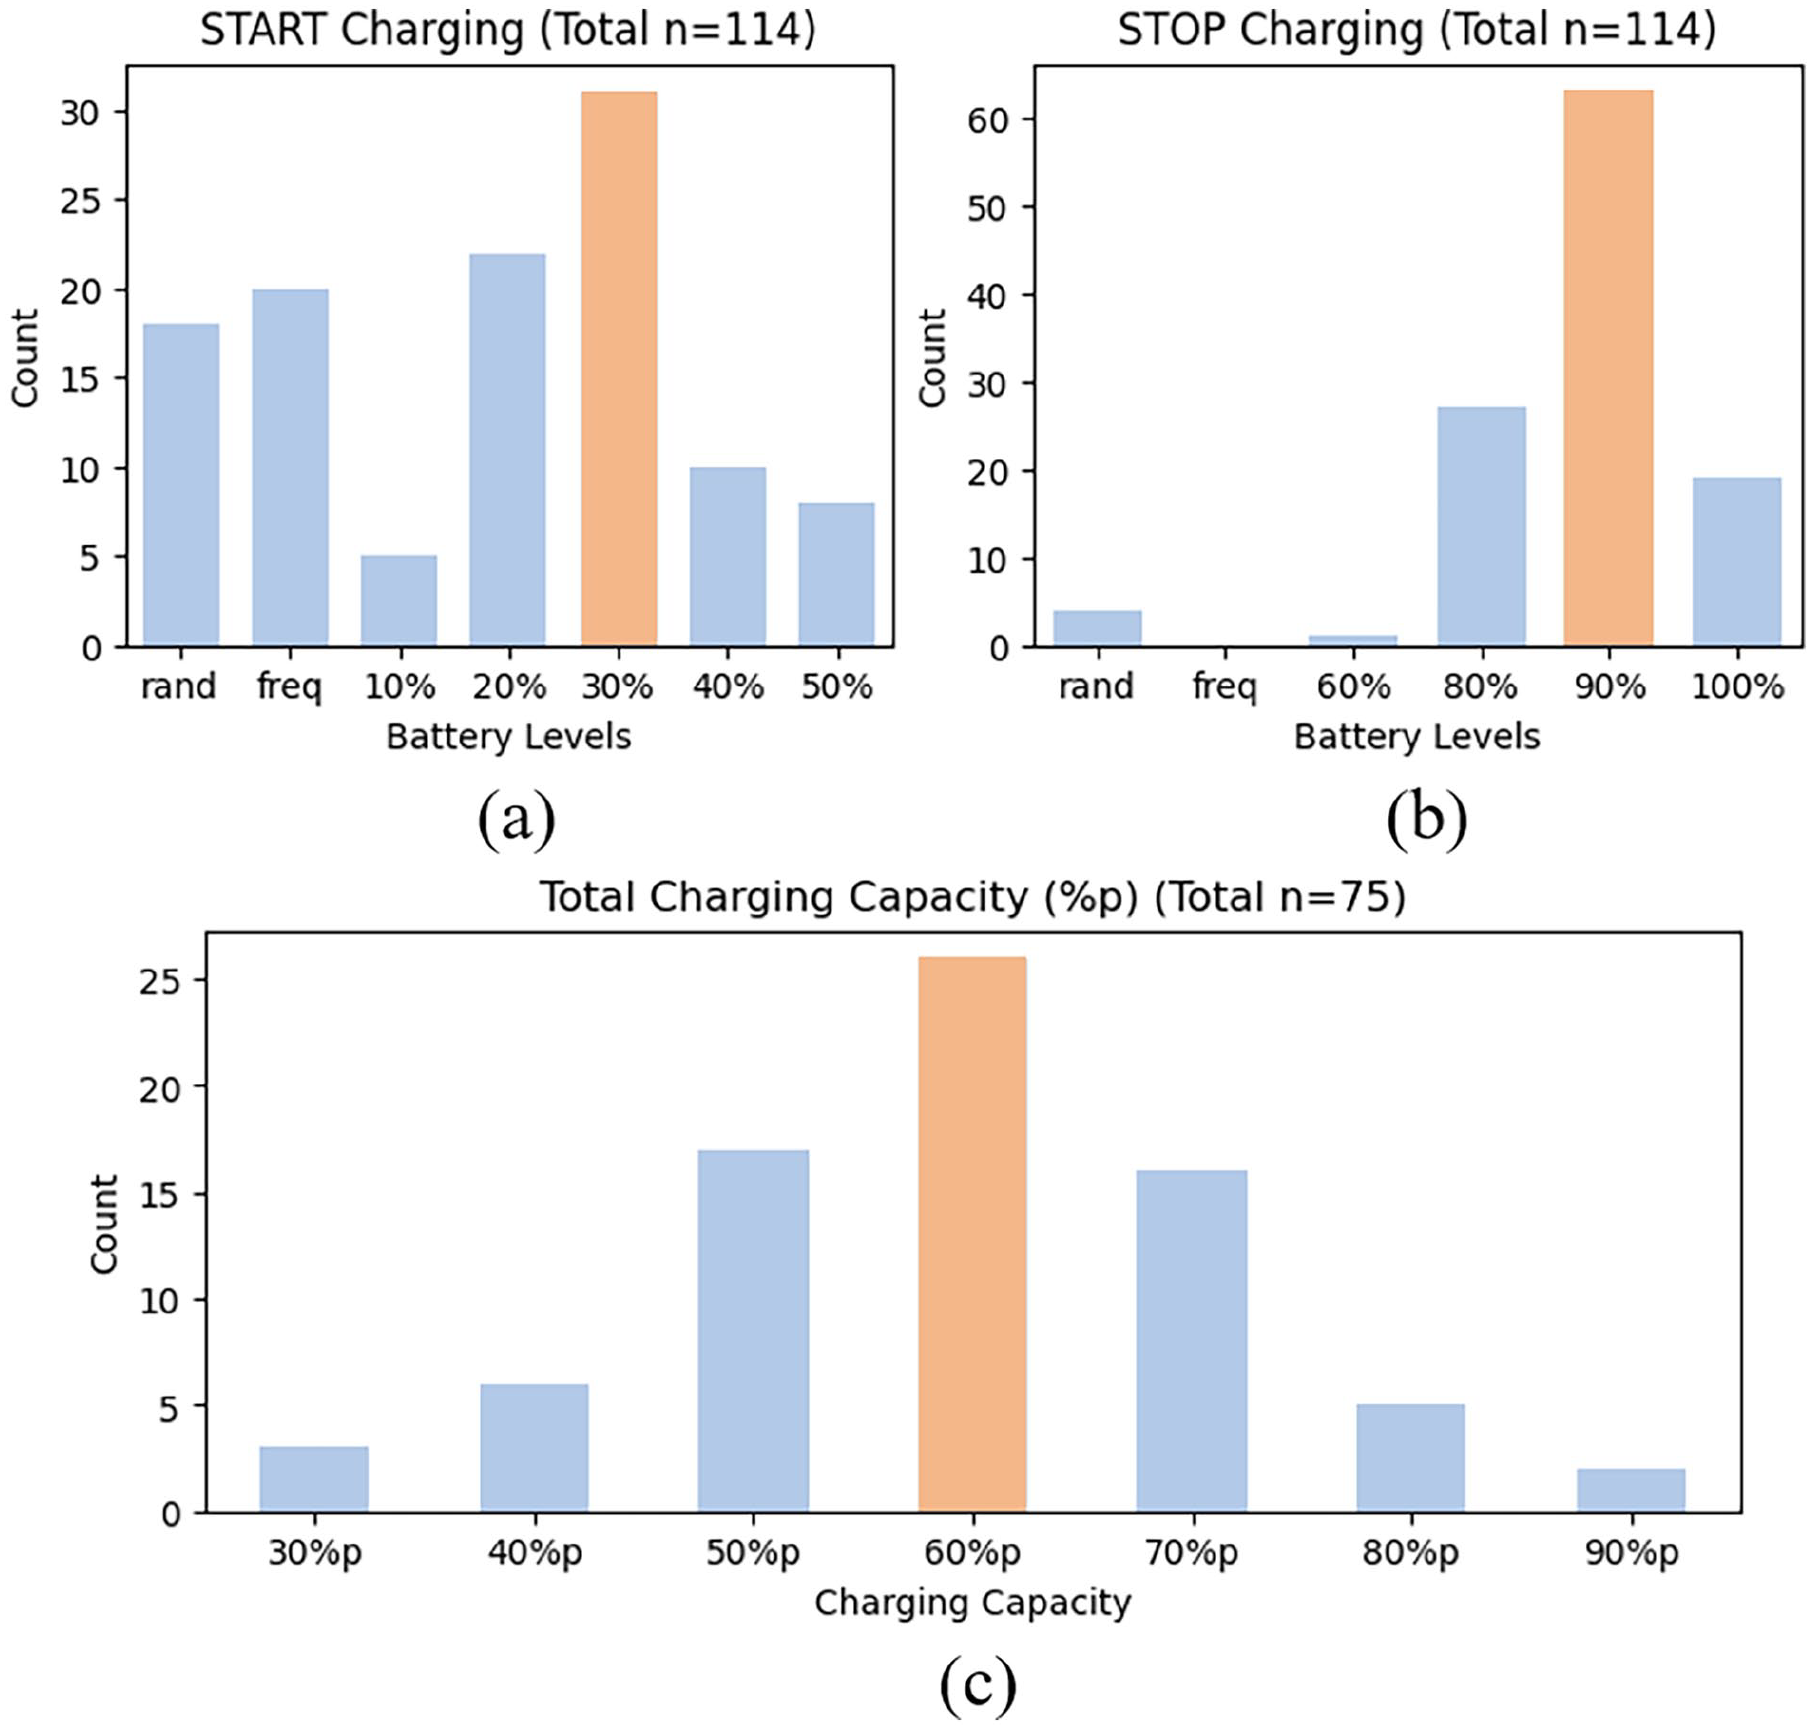
Charging behavior of all survey respondents. (a) Charging was most often started at 30% battery level, (b) finished at 90% battery level, and (c) charged by 60 percentage points.
The most common battery level at which to start charging was 30% (n = 31, Figure 2a), and over half of the participants ended the charge at 90% (n = 63, Figure 2b). The most common percent point of charge was 60 percentage point (n = 26, Figure 2c). The average MCF of all the participants (n = 114) was 1.26.
Charging Behavior Differences With MCF
Battery Level to Start Charging
The battery level to start charging (Figure 3) was categorized into five variables: rand, freq, 10%, 20%, and over 30%. Fisher’s exact test between MCF groups and charging start level showed a significant relationship (p = .037). Furthermore, post hoc analysis showed a significant difference between “freq” and “over 30%” (p = .038).
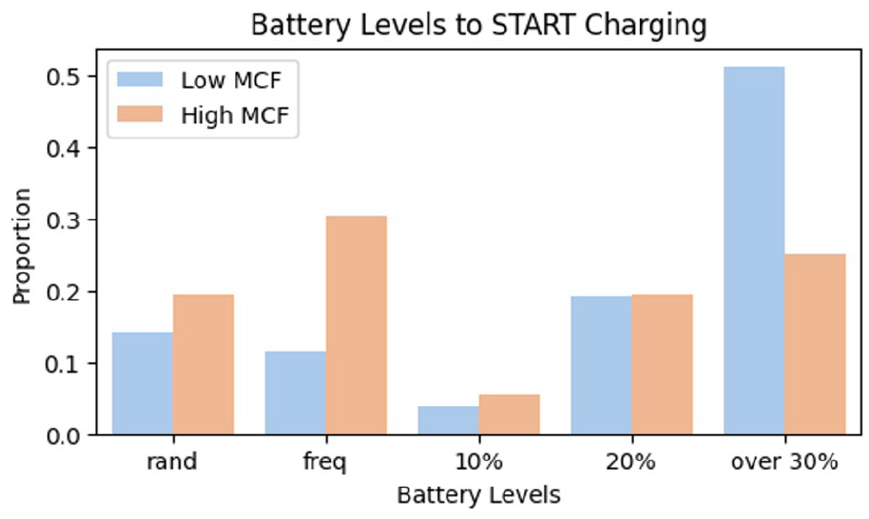
Battery levels to start charging by the MCF group. The low MCF group started charging at 30% battery level, while the high MCF group charged frequently (freq) with no specific level.
Battery Level to Stop Charging
Based on Fisher’s exact test, there was no significant relationship between battery levels to stopping charging and the MCF groups (p = .515, Figure 4)
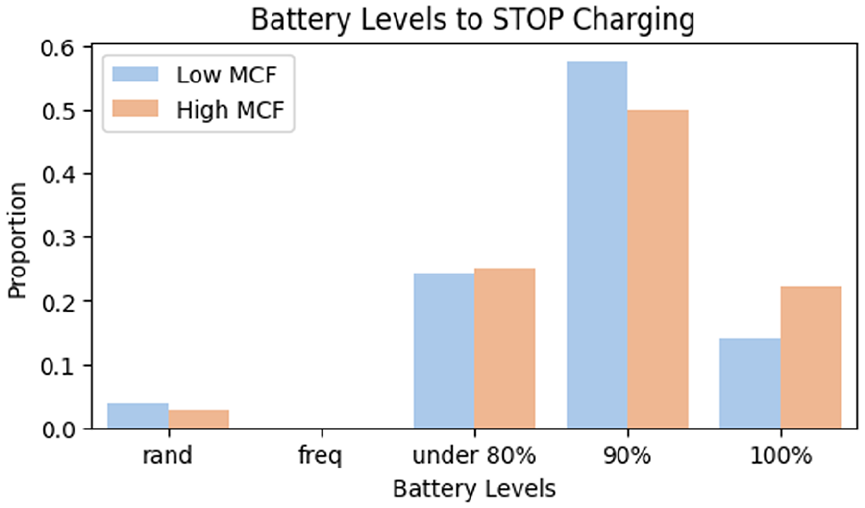
Battery levels to stop charging by the MCF group. Most users finished at 90% battery level, with no significant difference between the low and high MCF groups.
Charging Speed Types and Preference
We divided charging speed types into two categories: 7 kW slow charger and 100 kW fast charger. As a result of Pearson’s Chi-squared test, there were no significant relationships between charging speed types (p = .673, Figure 5a) and preference (p = .832, Figure 5b) and the MCF groups.
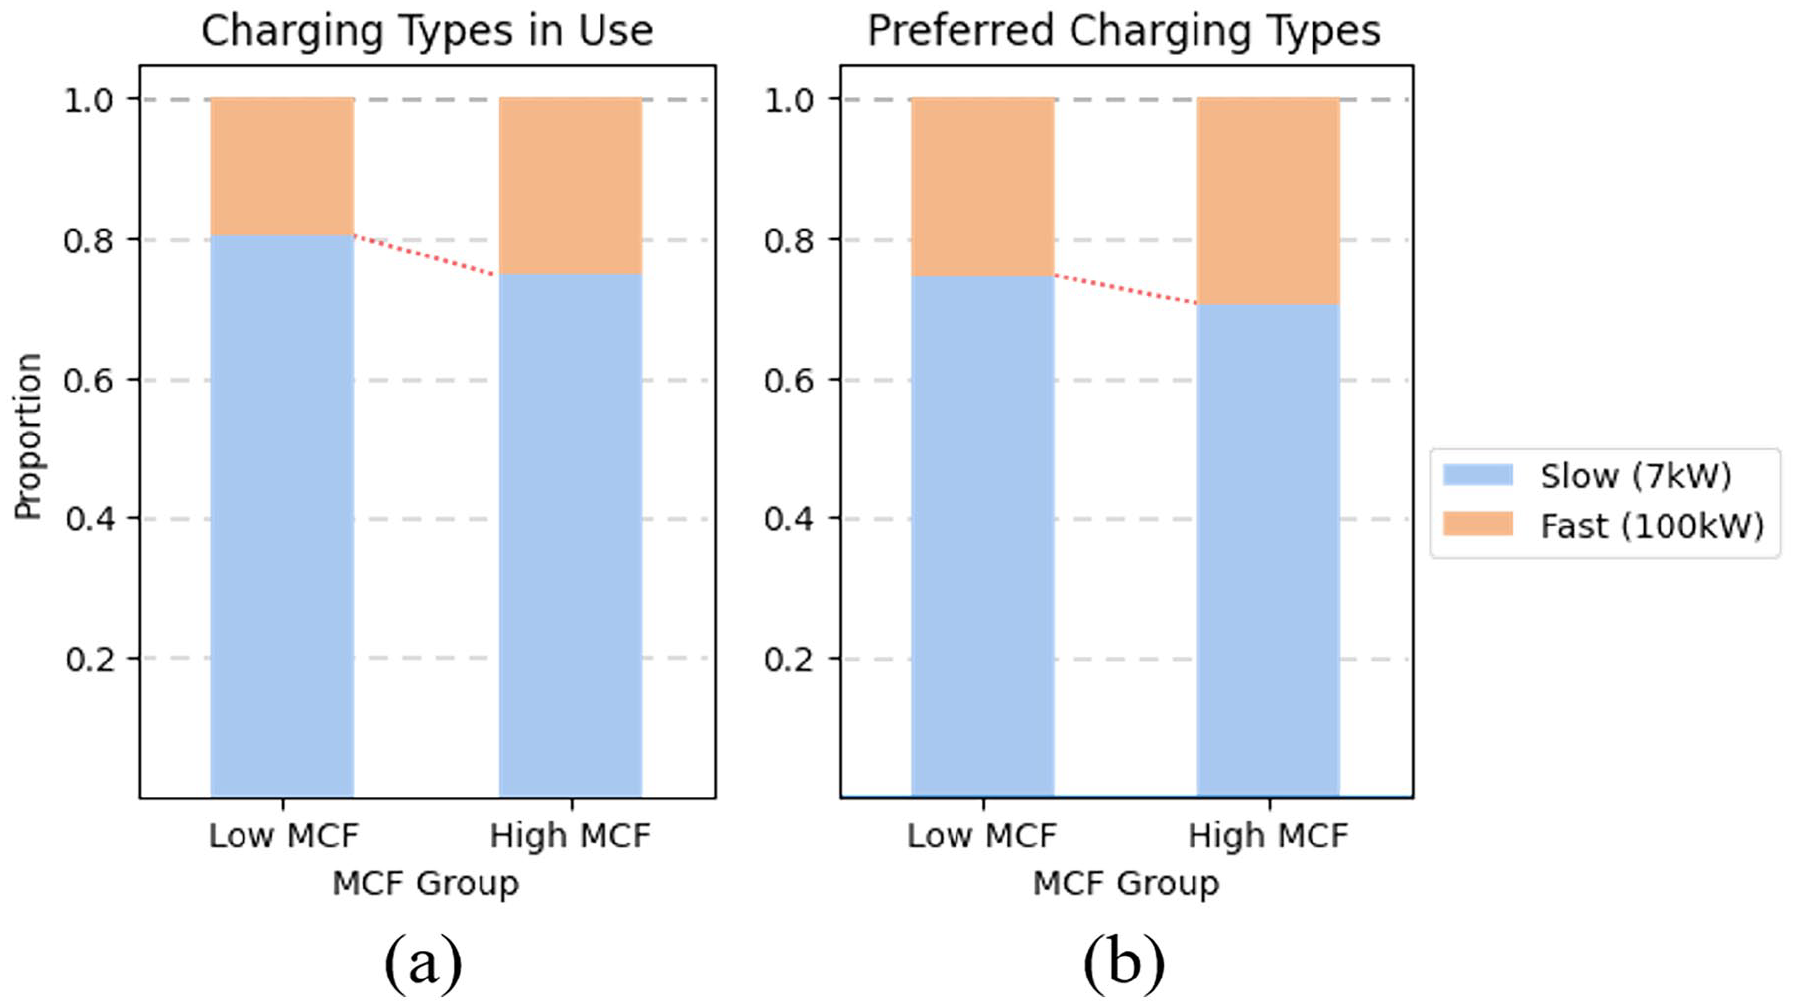
Charging speed types by the MCF group. (a) The high MCF group used fast charging more frequently, (b) and their preferred charging type also indicated a preference for fast charging.
Location Variance of Charging
For the EV charging location variances (Figure 6), we divided the participants into three categories: almost fixed (use the same charger more than 70%), slightly variable (under 70%), and mostly variable (find chargers whenever needed). According to Fisher’s exact test, the two groups and the variation in charging location were statistically significantly related (p = .039)
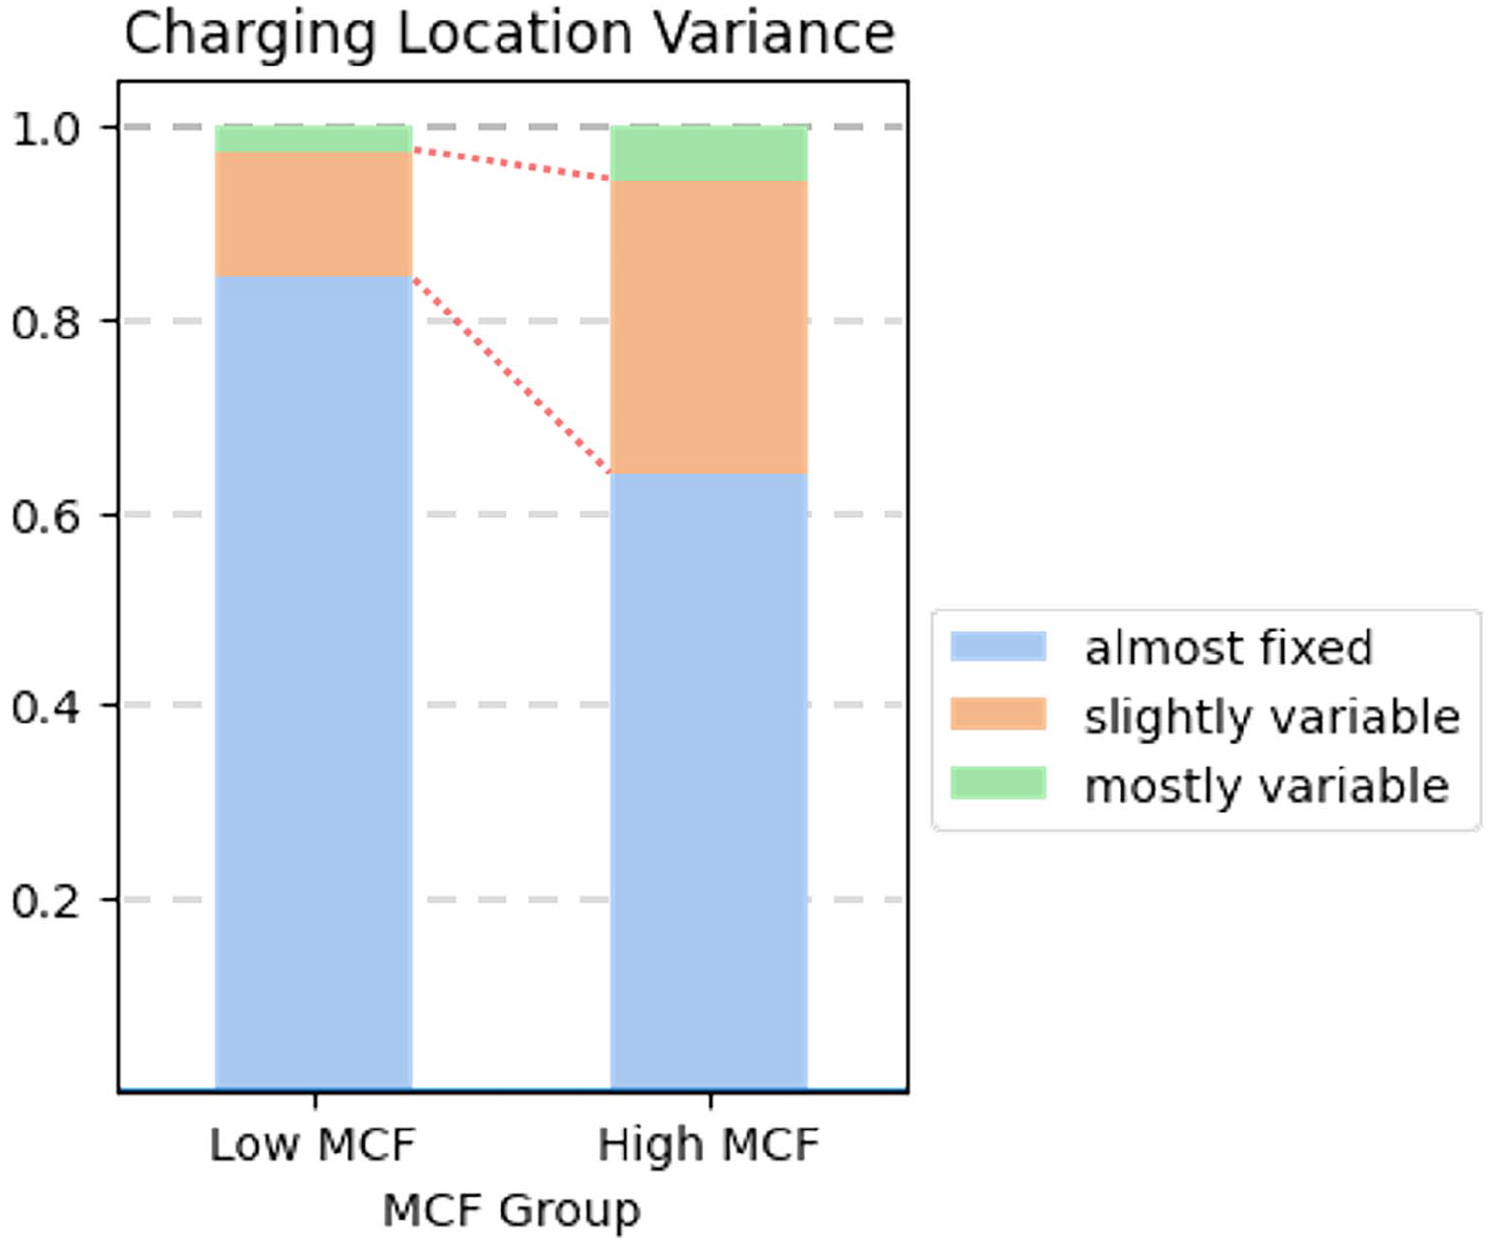
Charging location variance by the MCF group. The low MCF group charged at almost fixed locations, while the high MCF group charged relatively at various locations.
Frequency of Charging
Regarding the frequency of EV charging (Figure 7a), neither group passed the Shapiro-Wilk normality test. So, a Wilcoxon rank sum test was conducted and showed a statistically significant difference (p < .001).
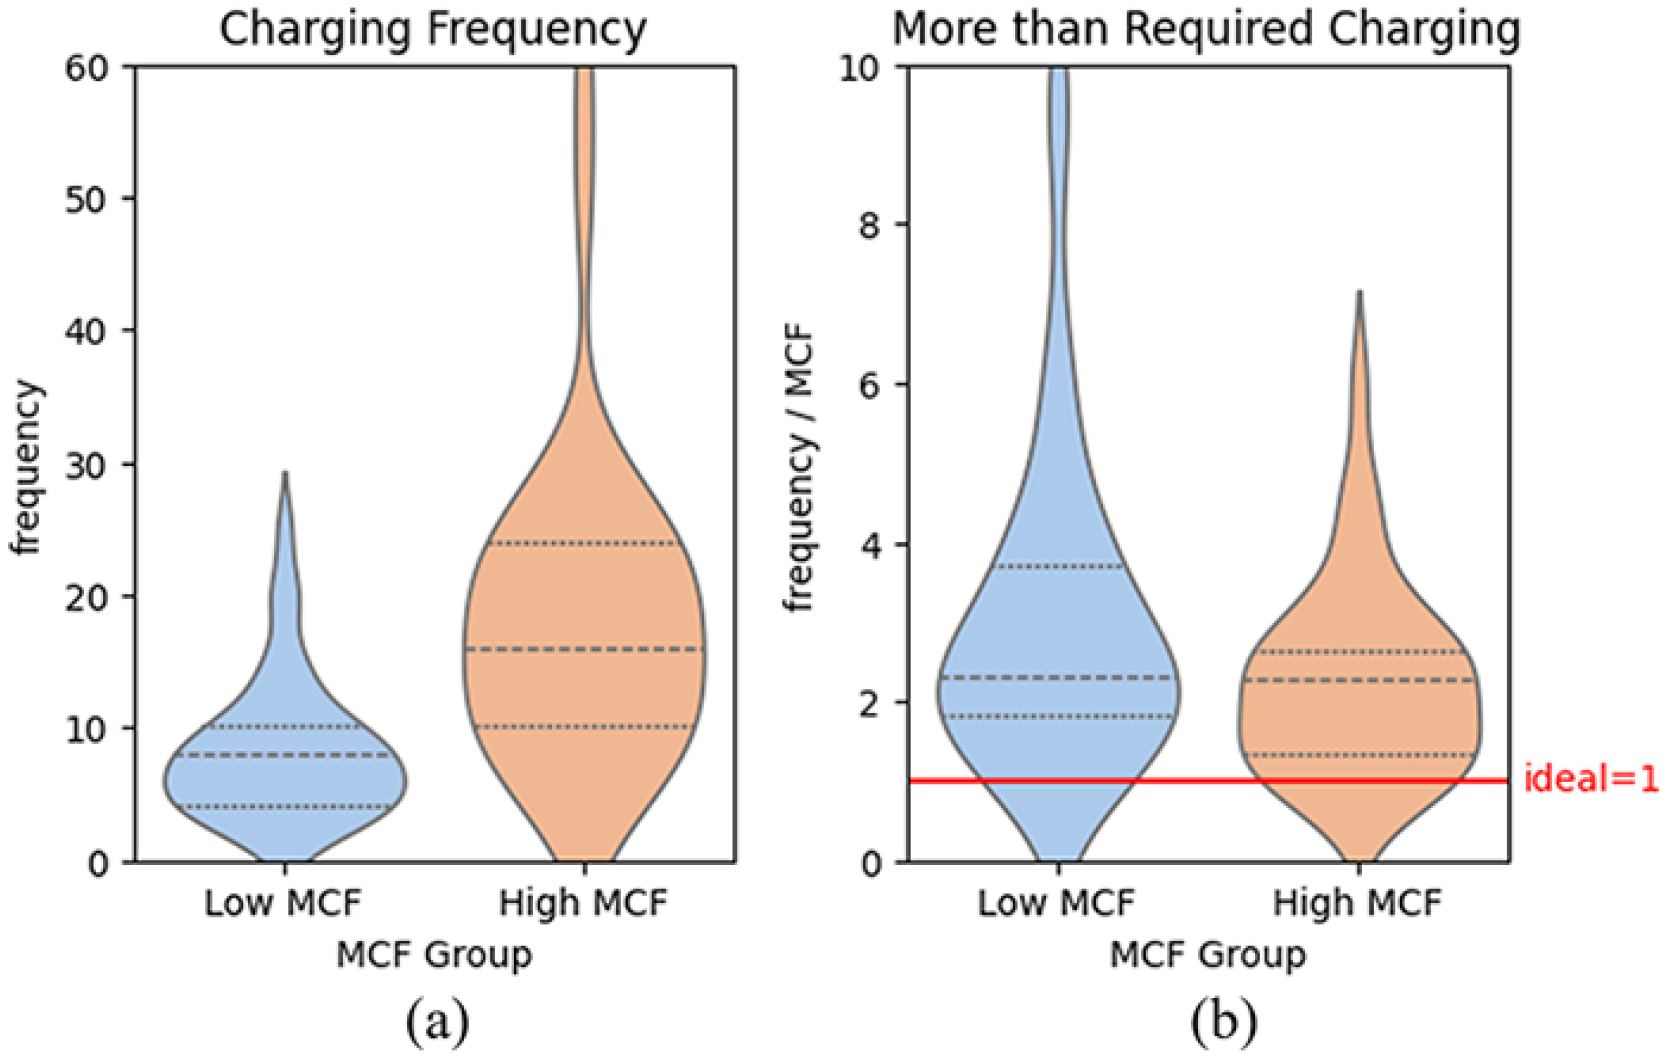
Charging frequency by the MCF group. (a) The high MCF group charged more frequently. But (b) the low MCF group, charged much more than needed. The ideal would be to charge at the same frequency as the MCF indicated by the red line.
Frequency of Charging and MCF
We investigated how much EV users charge relative to their MCF (Figure 7b). We divided each user’s charging frequency by their MCF and compared the values. The higher value means they charge their EV more than they need. Again, normality was not met, and the Wilcoxon test showed that the Low MCF group (M = 3.041, SD = 2.006) had a higher value than the High MCF group (M = 2.255, SD = 1.181), although not statistically significant (p = .068).
Discussion
This study was conducted to identify differences in the charging experience of electric vehicles based on user characteristics. We focused on driving mileage per week and battery capacity as important factors affecting the charging experience. We created an index called Minimum Charging Frequency (MCF) using these. Based on this, we divided users into two groups and analyzed differences in several charging behaviors.
The low MCF group initiates charging when their EV’s battery level reaches a specific remaining capacity. They also typically use the same chargers at the same locations. Although they charge less often, they tend to charge more than needed. In contrast, the high MCF group exhibited a propensity for more frequent charging without a threshold that had to be charged at a specific battery level. Additionally, they indicated higher variability regarding their charging locations. They charged more frequently, and this is because they needed it.
Until now, there hasn’t been much research on how EVs are charged or differences in behavior across groups. A common characteristic is that EV users start charging at the 30% battery level, near the level where they feel uncomfortable (Philipsen et al., 2018). Also, this is similar to the behavior of smartphone charging in previous studies (Ferreira et al., 2011). In sum, a 30% battery level could be a psychological threshold. They also finish charging at around 90%, which suggests that consumers know the basic characteristics of batteries. However, basic charging behaviors are influenced by different contexts and personalities, such as the purpose of driving, EV range, and psychological factors, resulting in diverse experiences for EV users. Moreover, these results could advocate integrating users’ demographic and behavioral characteristics or preferences as variables for the infrastructure design research (Pagani et al., 2019). Prevailing charging infrastructure often fails to account for these divergent contexts of use, resulting in mis-location and under-managed. By incorporating such factors into simulation models, infrastructure can reflect the real humans’ behavior and be tailored to better align with human factors.
In practical sight, while technical improvements are essential, human factorial insights are also necessary to escape the Chasm, emphasizing the importance of contextual considerations in design. Until now, offering a uniform user interface (UI) and user experience (UX) regardless of users’ diverse characteristics and needs (Bae et al., 2024). Addressing this discrepancy is important to enhance the usability and effectiveness of charging infrastructure. In line with the user-centered design (UCD) methodology, the design could deal with the characteristics of the user, task, and environment (ISO, 1998). By acknowledging the diverse usage contexts of EV users, designers can tailor UI and UX elements to suit their specific requirements better. Again, in infrastructure problems, such disparities could yield divergent outcomes when optimizing travel routes, underscoring the necessity for personalized route optimization functionalities within navigation systems.
Interestingly, on average, the low MCF group drives less per month (M = 1424.1 km, SD = 572.0) than the high MCF group (3525.0 km, SD = 1605.6), but they charge more times per MCF. This means that the low MCF group charges more often than necessary for their use, which might be a kind of obsession. This could be disruptive to other EV users because, in some cases, chargers have characteristics of a sharing economy (Liu et al., 2017). In particular, in countries or regions with insufficient charging stations, charging may be less available and cause rivalry in consumption. This damaged usability may not lead to the repurchase of EVs. In addition, it is necessary to inform EV users about the appropriate frequency to charge along with their usage context, or it may cause conflicts among residents if the number of EVs increases in the future and competition arises.
While we tried to recruit as many participants as possible, a survey of about 100 people may not represent the total EV users. Also, most survey respondents are located in a few urban areas. Given the culture of South Korea, which is characterized by multiplex housing, such as apartments or office buildings, this may not be the case for single-family homes with individual EV chargers.
Conclusion
This study aims to identify variances in the EV charging experience, specifically regarding user characteristics. We conducted a comprehensive survey with 114 participants and created an MCF index, which divided groups to uncover their distinct features well. With statistical analysis, there were several differences between the low MCF and high MCF groups. Our findings give rise to the research need for a human factor aspect to design and optimize charging infrastructure and associated applications, acknowledging and accommodating EV users’ diverse needs and preferences. Such an approach ensures that charging solutions are functional and user-friendly, ultimately optimizing the overall EV charging experience for all users.
Footnotes
Declaration of Conflicting Interests
The author(s) declared no potential conflicts of interest with respect to the research, authorship, and/or publication of this article.
Funding
The author(s) disclosed receipt of the following financial support for the research, authorship, and/or publication of this article: This work was supported by the BK21 FOUR Program (Education and Research Center for Industrial Innovation Analytics) funded by the Ministry of Education, Korea (No. 4120240214912). And this research was supported by Basic Science Research Program through the National Research Foundation of Korea (NRF) funded by the Ministry of Education (RS-2023-00222172)