
Abstract
Tooth wear is one of the main reasons that lead to gear failure. The amount of wear is nonlinearly related to temperature, lubrication, load, and various random factors of materials, with obvious randomness and slow time-varying characteristics. Wear is a nonstationary random process, which has no accurate mathematical model or accurate reliability estimation method. This article proposes a reliability model of spur gears which works under a nonstationary random process that exceeds the limit, and the time-varying wear reliability is studied based on the level crossing analysis method. The wear at tooth root is revised in the calculation under the nonstationary random process, and the reliability curves are obtained afterwards. An experiment is carried out on the spur gear meshing test rig, and the reliability model and wear performance are verified and analyzed. Results obtained with the proposed tooth surface wear reliability model match well with the experimental results. Therefore, this model is applicable for situations under a nonstationary random process. The new method makes contribution to the assessment of gear running status and is of great significance in the prediction of wear life under a nonstationary random process.
Introduction
Gears are widely used in all kinds of engineering equipment and play an important role in industries such as aerospace, automobile, and machine tools. Wear affects the interaction of the gear, which may generate noise and cause uneven gear speed and meshing impact. Moreover, dynamic effect of gear increases and working efficiency decreases. And more seriously, gears may fail. Wear reliability studies on gear tooth contacts of rotating machines are very important so as to decrease the possible loss of products caused by wearing. The study by Lundvall and Klarbring 1 showed that slight wear of tooth surface can lead to changes of features and dimensions of gears. Tönshoff et al. 2 using micro-magnetic techniques to monitor the grinding process proved that wear has a great influence on the quality and reliability of components. So the wear reliability of the gears and other mechanical parts is always a very important subject.
The wear reliability assessment of gears has been investigated by many researchers. S Wang et al. 3 estimated the wear of tooth surface by experimental methods. This model establishes the quantitative relation among the rate of friction fatigue wear, loading, and lubrication. Many researchers studied the wear prediction model of gears or tools which was helpful to assess the wear reliability of gears.4–7 The Hertz contact model is often used to estimate the wear depth with contact pressure and sliding distance. However, this approach is only valid in the case of large clearance. Flodin and Andersson 8 calculated the contact pressure and sliding distance for two profiles based on the Winkler model. Then a wear prediction model of spur gears was established with the Archard 9 wear model. As a result, the wear depth of tooth profile was numerically simulated. Then this model was capable of predicting the wear depth of helical gears. The approach was extended by Tunalioğlu and Tuç, 10 where different motor speeds and torques were considered. And a method for fast prediction of wear depth along the meshing line was proposed for internal gears. Some researchers studied the wear of tooth with finite element (FE) method. Brauer and Andersson 11 used a mixed FE and analytical approach to simulate the wear of a spur gear pair with flank interference. In their study, the contact loads between the interacting gear teeth are determined by the FE method. Bajpai et al. 12 proposed a surface wear prediction methodology which employs an FE-based gear contact mechanics model in conjunction with the Archard wear formulation to predict the wear of contacting tooth surfaces. Dhanasekaran and Gnanamoorthy 13 proposed a wear prediction methodology for spur gears to investigate the influence of material properties on gear tooth wear under unlubricated conditions. The methodology predicts the tooth wear and wear pattern in spur gears with the Archard wear formulation, and the results show that wear is more in both addendum and dedendum tooth surfaces, and that the highest wear occurs at the dedendum of the tooth surface. The tooth wear depth also changed with the gear tooth modification. Fatih and Ekwaro-Osire 14 studied the influence of the pressure angle and tip relief on the wear of spur gears. It is shown that as the amount of the tip relief increases, the wear depth, particularly at the beginning and at the end of the mesh, decreases.
However, the physical law of material wear has not been completely uncovered, and there are various factors that affect the wear process. In addition, there is apparent randomness of tooth surface wear caused by contact pressure, temperature, lubrication, surface roughness, material performance, and other factors. Therefore, we believe that the distribution law of wear depth can be found by experimental analysis, and reliability can be calculated effectively.
Due to varying the time, the data of fatigue and wear display gradient characteristics.15–17 Reliability study on a particular point “t” is a static method in essence. So it is necessary to describe wear depth by adopting random process. WT Kwon 18 performed a research on the wear depth of cutting tools which were made by different materials and derived its random process curve and the fitting curve equation, which described the randomness of wear depth.
Gears may fail when the wear depth is beyond the allowable value, which can be attributed to the crossing problem. If wear depth remains unchanged with time, it could be regarded as a stationary process. There is a detailed description of the crossing analysis method of stationary process in articles written by Grigoriu, 19 Wen and Chen, 20 and Ditlevsen. 21 These documents are suitable to analyze dynamic reliability and vibration reliability. Nevertheless, the wear depth process is related to time, which cannot be described with a stationary process anymore. It is difficult to extract process feature and identify faults by traditional methods, so the result is always inaccurate.
Currently, a numerical method 22 and a simulation analysis method 23 are available when analyzing the crossing reliability at a nonstationary random process. But the wear depth which is time varying slowly exhibits a nonlinear correlation with some random factors such as temperature, lubrication, load, and material. So it is difficult to simulate the wear process accurately with software. This study aims at investigating the wear reliability for gear tooth surface which changes with time theoretically and experimentally.
This article is an attempt to describe the wear depth of gear tooth with a nonstationary random process and presents a crossing analysis method of nonstationary random processes to estimate the reliability. The wear prediction is made theoretically and the distribution of wear depth is estimated by small sample experimental statistics.
Simplified wear model for spur gears
There are rolling and sliding between the interacting gear teeth. The commonly used gear wear model is Archard’s 9 wear equation

where V is the volume of the worn away material, s is the distance of the slide, W is the applied normal load, H is the hardness of the gear surface, and K is the dimensionless wear coefficient for one point on the interacting surfaces. The equation can be expressed as
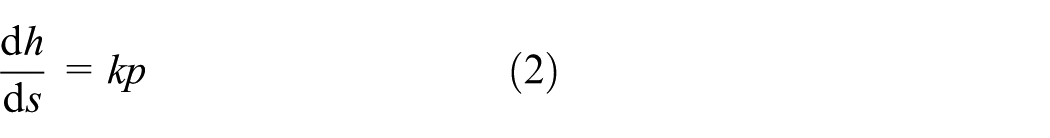
where h is the wear depth, k is the dimensionless coefficient, and p is the contact pressure. During the study of wear of spur gear surfaces, Flodin and Andersson 8 assumed that k and p are constant during a mesh. So the wear on a particular point can be calculated as

where hP,n is the wear depth at point P on the flank after n running intervals, hP,(n – 1) is the wear depth at the same point with the former running interval, pP,(n – 1) is the pressure of point P, and sP is the sliding distance of point P during one mesh. Based on this formula, Anders Flodin proposed the following wear depth for points on the pinion

and for points on the gear

where u1 and u2 are the peripheral velocities of the pinion and gear flanks, respectively, and can be expressed as

and
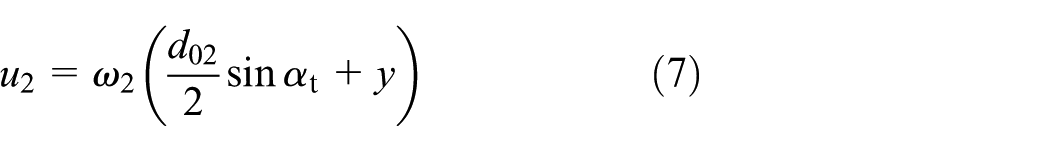
where αt is the pressure angle at the pitch surface, ω1 and ω2 are the angular velocity of the pinion and gear, respectively, y is the distance between the pitch point and the instantaneous point, d01 and d02 are the pitch diameters of the pinion and gear, respectively, and p is the surface pressure. According to Tunalioğlu and Tuç, 10 the surface pressure p can be expressed as

where yi is the distance from the center of the Hertz contact and Ft is the applied load. For spur gears, single-tooth meshing and double-tooth meshing occur alternately with the gear rotating. The surface pressure is different between the single-contact and double-contact zones because the load is transmitted by either one or two tooth pairs in contact. The distribution of the applied load along the line of action is as shown in Figure 1.

Applied load on the action line.
The points A and E are the start and end points of meshing, B and D are the beginning and ending points for the single meshing points, and C is the pitch point. In this case, applied load has the total tooth load value in the region RBD. In the regions RAB and RDE, the applied load is half the total tooth load. So the applied load Ft has the value of
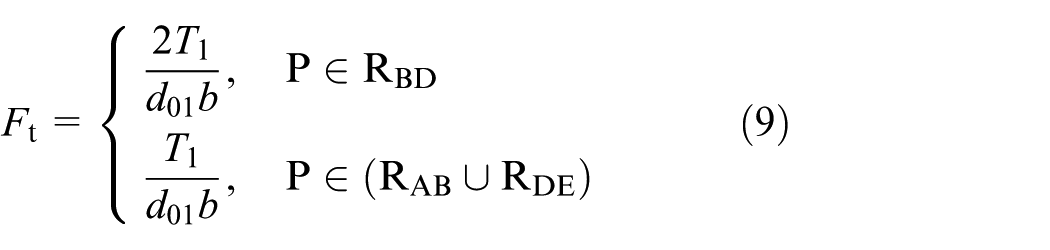
where T1 is the applied torque on the pinion, b is the tooth width, and αH is half the width of the contact zone and can be calculated as

where R is the equivalent curvature radius of the contacting surfaces and E is the equivalent elasticity modulus of materials and can be calculated as follows


Wear reliability model
When wear depth of the tooth surface is beyond the allowable value, wear failure will occur on gears. A stochastic system of wear is evolving, which means that its status is changing with time. Therefore, the wear depth in one point of gear is affected by many random factors. Under the condition of time t, wear depth is a random variable which has contingency character and enlarges over time. Hence, wear depth can be seen as a random phenomenon that increases over time. It needs to be described by a nonstationary random process. 24
In order to eliminate nonstationarity of the random process, the randomness and certainty should be separated. Randomness can be implied in a zero-mean stationary random process and a nonstationary random process can be implied in a deterministic function. Assume that the nonstationary random process h(t) is defined by the deterministic wear function hp(t) and the zero-mean stationary process Y(t), where hp(t) can be calculated by formulas (4) and (5)

Assuming that h(t) is a nonstationary random process, the event h(t) > B can be considered equal to event Y(t) > B – hp(t) of stationary condition; supposing Z(t) = B – hp(t), the event C is defined as Y(t) up across Z(t), under the conditions of Y(t) moving by positive slope and within the time period (t, t + dt), where B is the limit of the wear depth.
As shown in Figure 2, the probability is p = Pr(C). Since Y(t) can only go across Z(t) one time in a short interval, across time


Positive slope horizontal crossing.
We can take the interval length dt and, across rate p as a proportional relation, the ratio is

According to the Taylor series expansion

Across event {Y(t + dt) > Z(t)} can be derived as

When dt tends to 0 and the integral lower bound tends to the upper bound, we can estimate the integrand at the point of y = Z, substituting dy by the difference between the upper and lower bounds.

Hence

Replacing equation (21) into equation (17), we obtain

Y(t) is a normal random process, Y(t) and

Replacing equation (23) into equation (22), we obtain

When the actual wear extent is greater than the permissible wear extent, the mechanical part will be subject to wear failure, and the wear reliability of tooth surface can be defined as the probability that the number of crossings is zero during the run time T
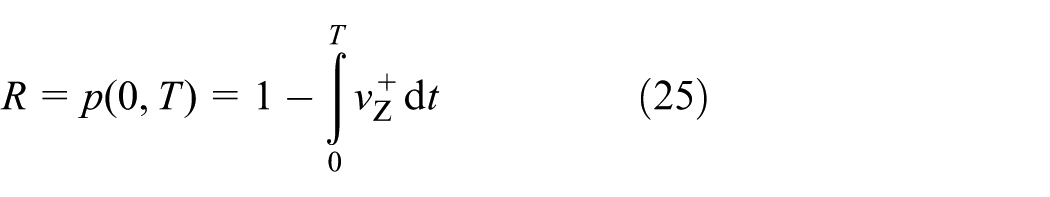
Plugging equation (24) into equation (25), we obtain

Plugging Z(t) = B – hp(t) into equation (26), we obtain

Formula (27) can be used to calculate the wear reliability of spur gears. It can be seen that the wear reliability is mainly related to the wear depth and wear depth distribution. Figure 3 shows the flowchart of the reliability calculation.
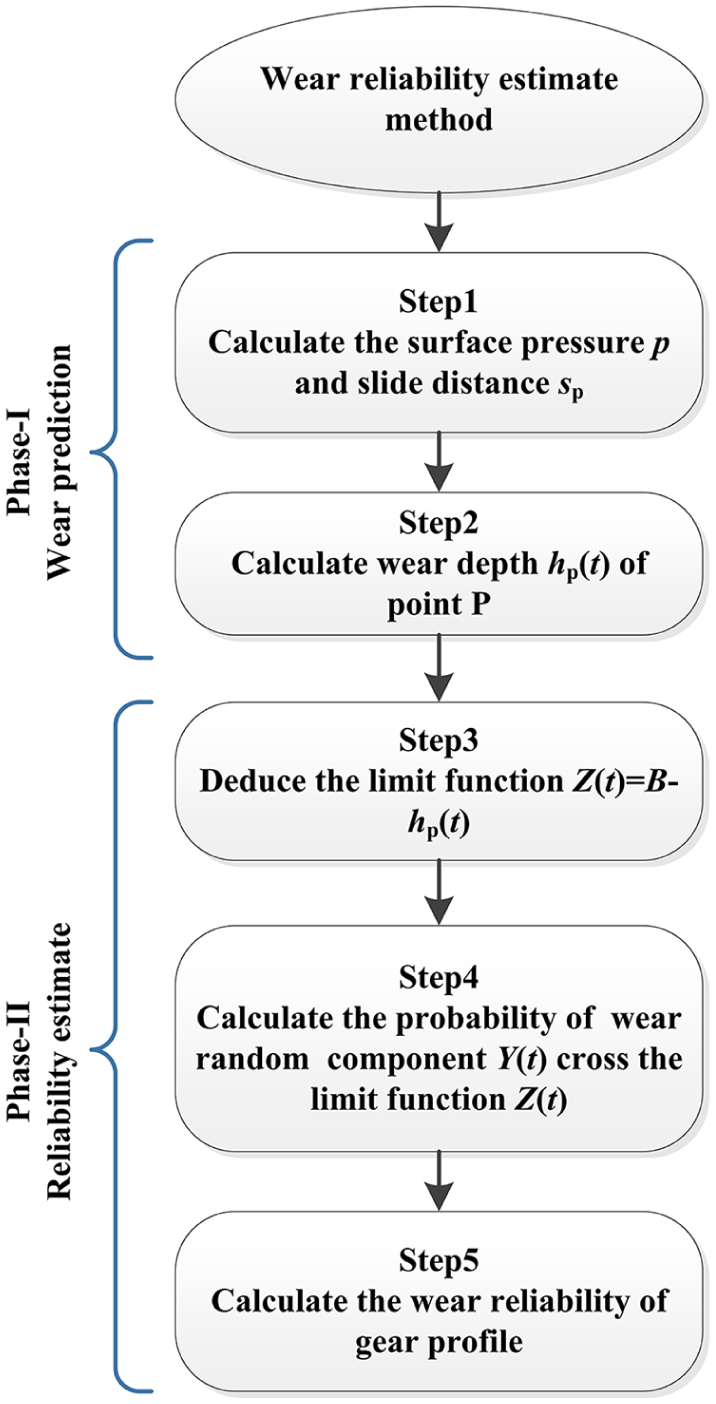
Flowchart of reliability calculation.
Wear simulation and distribution test of spur gear tooth
Parameters of gear testing
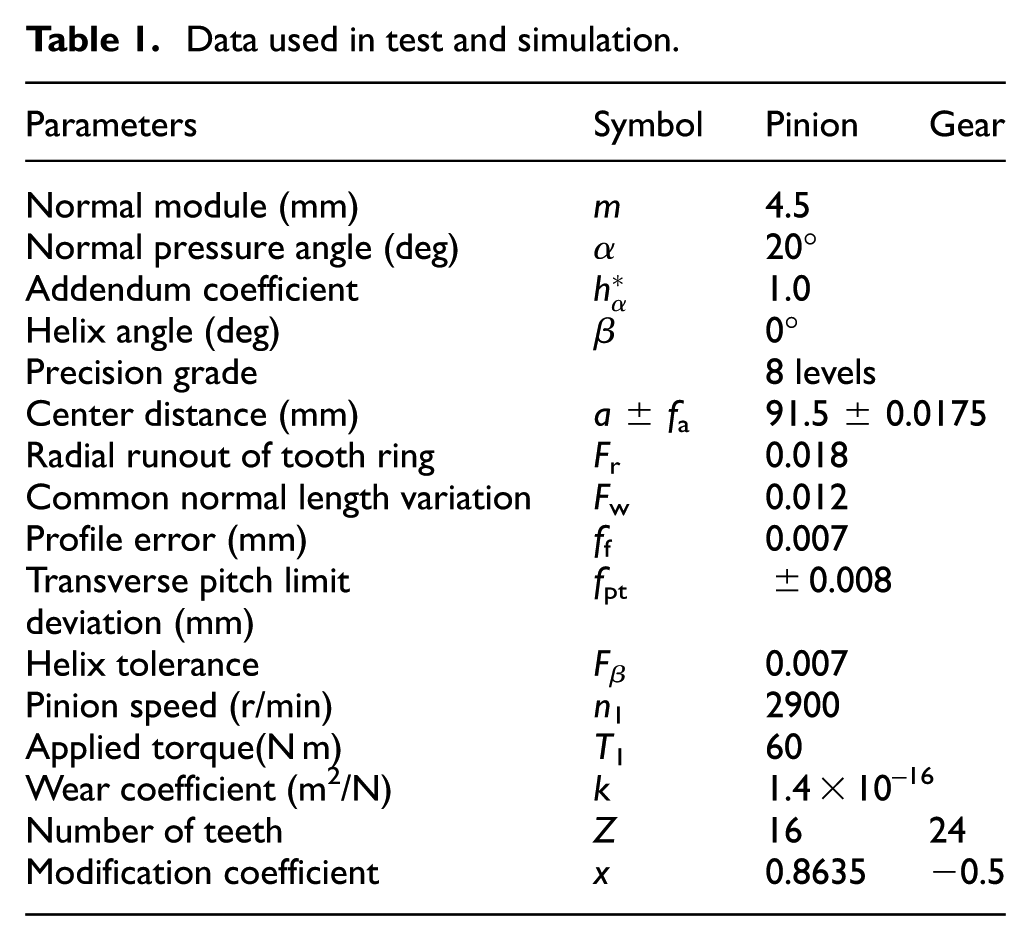
The data used in the test and simulation are summarized in Table 1.
Data used in test and simulation.
Wear simulation
The data used in the simulation are the same as those used in gear testing which are shown in Table 1. Each simulation running interval includes 1 × 10⁵ revolutions of the pinion. Topography changes are neglected because they only influence the contact conditions marginally. The wear depth of 10 points on the meshing profile is drawn. The first point is at the base diameter and the last point is at the top diameter. The simulated wears of the pinion and gear are presented in Figure 4.
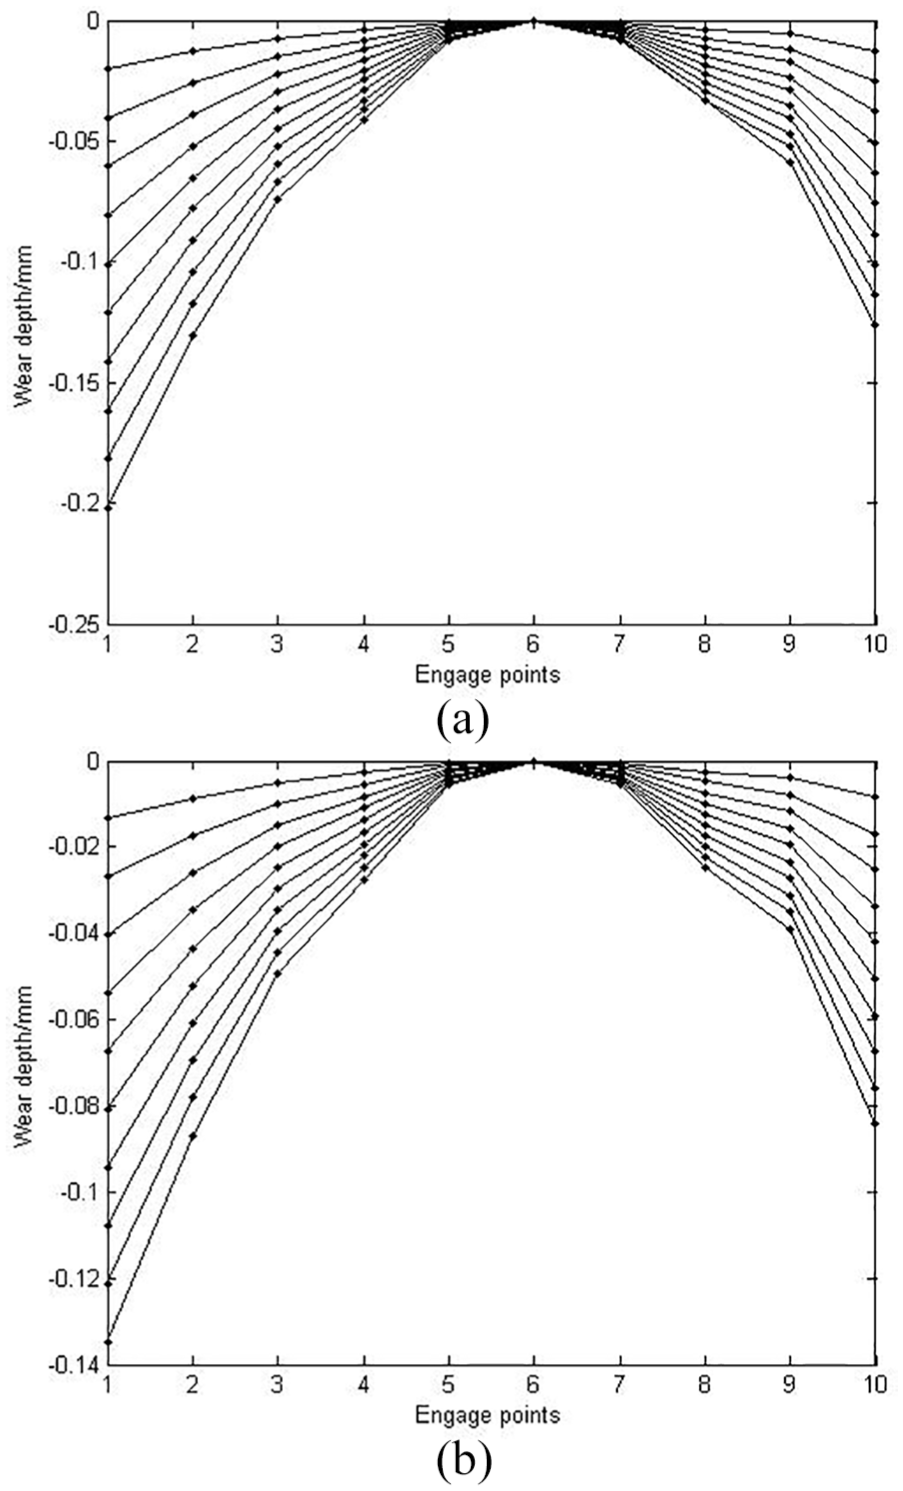
Theoretical wear development of (a) pinion and (b) gear.
It can be seen that both the pinion and gear have the biggest wear depth on the root and have the smallest wear depth near the pitch point. Since the simulation results cannot describe the distribution of the random process of wear, distribution experiments must be performed.
Test procedure
The main experimental determination methods to test wear depth of the tooth profile are the ferrographic analytic, tooth geometry size comparison, and weighing methods. Due to different relative motion speeds of the tooth profile, there are different wear extents at different parts. So the tooth geometry size comparison method is an available method. In order to obtain the distribution law of tooth wear, the wear experiment of 10 pairs of gears was made.
As shown in Figure 5(a), the wear test was performed on a CL-100 gear tester. The tester is a mechanical power enclosed type, the maximum torque of which is 1000 N m, while the loading level is divided into 12 degrees. For the sake of time saving, loading level 4th and torque 60 N m were chosen, which the maximum load allowable contact stress was.

(a) Tester of gear wear and (b) gear wear depth measurement.
Meanwhile, in order to obtain the distribution law of gear wear, 10 pairs of gears were tested. The wear depth of the gear was calculated by measuring the coordinates of the same point on the gear profile every 5 × 10⁵ rotations of the pinion. As shown in Figure 5(b), the three-dimensional (3D) coordinates of the 10 gears were measured on YXB-CMM201210 three-coordinate measuring instruments. Compared with the original coordinate, the space measured between gear profiles from the front to the back was the wear depth from the foot to the top. The process was continued until an arbitrary tooth surface generates pitting.
Test result
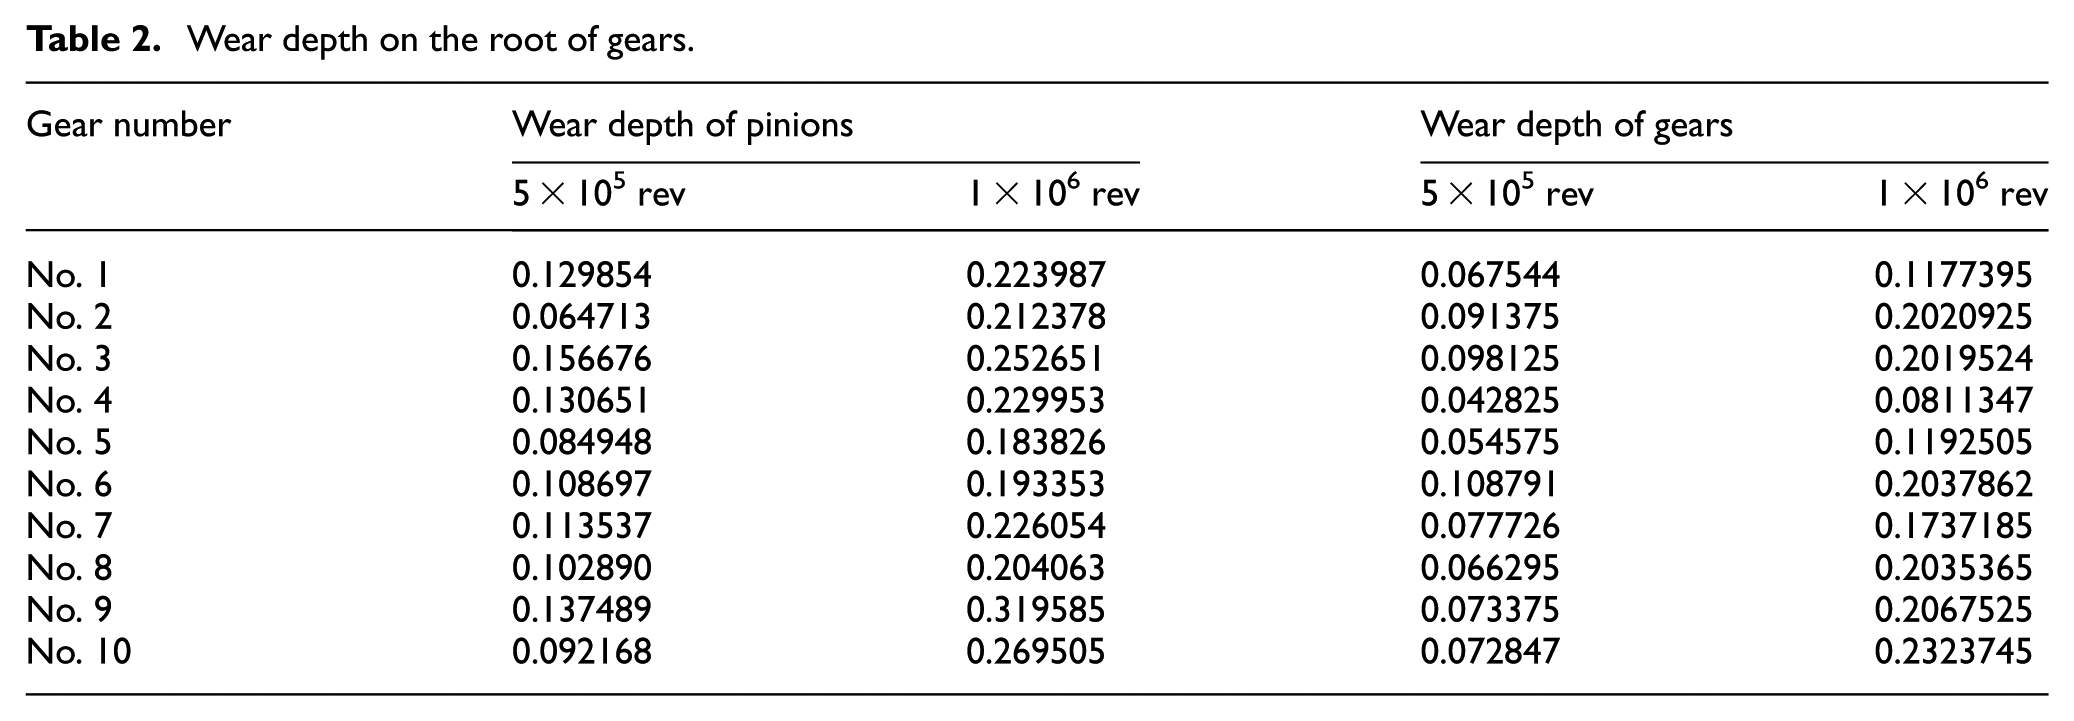
Test results show that the first pitting generation happens after 1.2 × 10⁶ revolutions among the 10 gears and wear depth can be measured twice in this period. Generally, tip and root of the gear have the biggest wear depth, and the root is likely to fail because of the stress concentration. Hence, the wear depth on the root of the gear should be analyzed. Table 2 shows the wear depth on the root of gears.
Wear depth on the root of gears.
Wear depth of the pinion is shown in Figure 6. It is clear that if wear depth is a random variable in a fixed time, it can be described as a random process. The random process of wear depth on the root of pinions is shown in Figure 7.
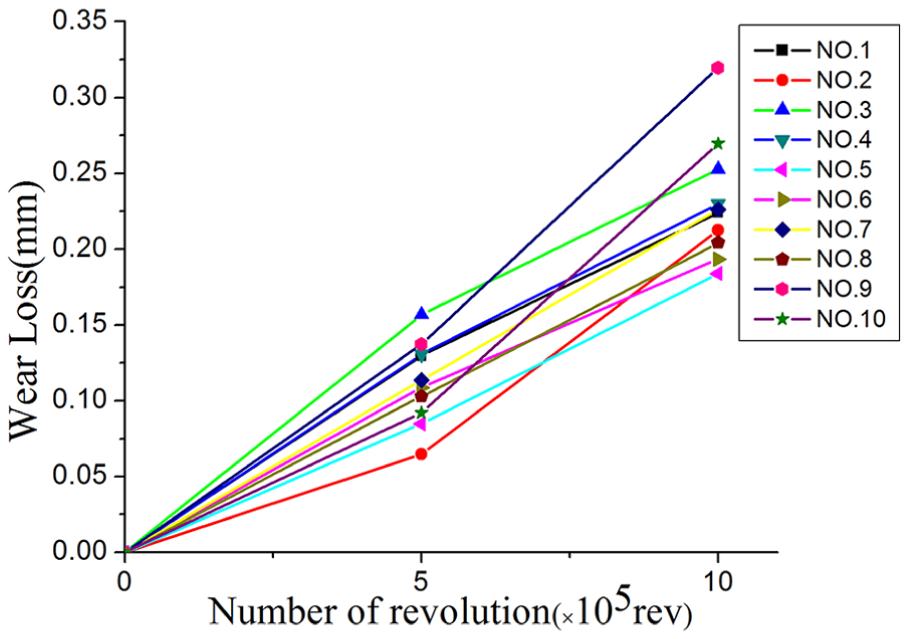
Wear depth on the root of pinions.

Random procedure curve of wear depth on the root of the pinion.
The wear depth curve of gears is shown in Figure 8, and the stochastic process curve of wear depth on the root of gears is shown in Figure 9.

Wear depth on the root of gears.

Random procedure curve of wear depth on the root of gears.
The simulated wear depths of pinions in Figure 4(a) are 0.105 mm at 5 × 10⁵ revolutions and 0.207 mm at 1.0 × 10⁶ revolutions which are close to the mean values of 0.115 and 0.237 mm from the test results in Figure 7 at 5 × 10⁵ and 1.0 × 10⁶ revolutions, respectively. Meanwhile, the wear depths of the gear in Figure 4(b) are 0.071 mm at 5 × 10⁵ revolutions and 0.137 mm at 1.0 × 10⁶ revolutions, which are close to the mean values of 0.076 and 0.176 mm from the test results in Figure 9 at 5 × 10⁵ and 1.0 × 10⁶ revolutions, respectively. The pinion has the biggest wear depth during both the simulation and the test because the meshing number of the pinion tooth is bigger than that of the gear. The experimental wear depth is larger than the simulated value, since according to the literature 25 the tooth surface pressure will increase continuously when the gear transmission error caused by wear increases. In this case, the wear amount will be greater.
Wear depth reliability calculation
The wear depth of the tooth increases with time and gears will fail when the wear depth exceeds 5% of unilateral tooth thickness of the gear tooth, so take B equal to 0.35. The wear depth can be calculated by formula (4), and the standard derivative can be estimated by the test data. By carrying out statistical analysis of the experimental data, the parameters are acquired as follows: standard deviation of pinions σy = 0.0043t + 0.0146, standard deviation of derivative

The curve of crossing rate

The curve of crossing rate
From the beginning period of the crossing rate curve, we get the cross rate of 0, which means that its reliability is 1. As time goes on, reliability gradually declines, while the crossing rate increases. According to formula (27), the wear reliability in working hours can be calculated as shown in Figure 12. Wear reliability of the gear is shown in Figure 13.
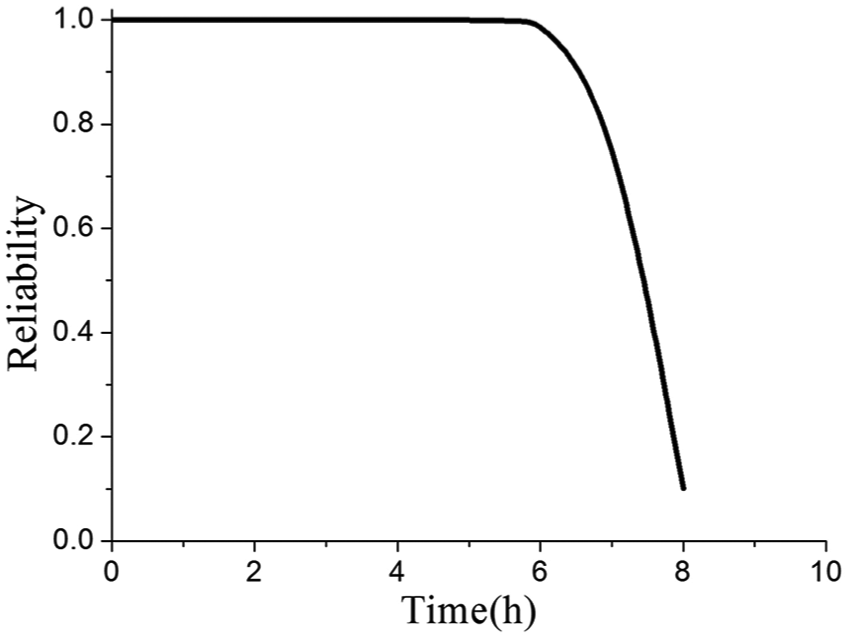
Wear reliability curve of pinions.

Wear reliability curve of gears.
The reliability of pinions begins to decline on the 6th hour, while that of gears begins to decline on the 4th hour, because the distribution of wear depth on gears is bigger than that of the pinions. The reliabilities of both pinions and gears have a sharp decline after the 7th hour. The reliability of pinions drops to 0 at the 8th hour, while that happens for gears at the 9th hour, which means that the gears have a longer life than the pinions.
Conclusion
This article describes the wear depth by a random process and proposes the wear reliability analysis method based on nonstationary random process theory and the wear reliability test of the spur gears was carried out. Conclusions are drawn as follows:
First, the wear curve obtained from the analysis of the tooth root wear of multiple pairs of gears obeyed the normal nonstationary stochastic process. It provided the basis for future engineering calculations of gear materials, wear, lubrication, vibration, and thermal analysis.
Second, based on the reliability theory, the cross-analysis method of a nonstationary random process was proposed. The predicted reliability results were reasonable compared with the test results. It provided new ideas and solutions for calculating the reliability of nonstationary random process data for engineering applications.
Finally, the predicted curve of wear depth increased linearly with time and the predicted results of wear were basically consistent with the experimental results. The results of the experiments and the curve of the reliability can well be used as a reference for other scholars in gear design, maintenance, and replacement.
Footnotes
Handling editor: Hui Ma
Declaration of conflicting interests
The author(s) declared no potential conflicts of interest with respect to the research, authorship, and/or publication of this article.
Funding
The author(s) disclosed receipt of the following financial support for the research, authorship, and/or publication of this article: This research was supported by the Liaoning Province Natural Science Foundation of China (Grant No. 20180550927) and the National Natural Science Foundation of China (Grant Nos 51675353 and 51705342).