
Abstract
Land use is a primary factor affecting the demand for public bicycle rentals. Demand for public bicycle rentals during different periods of time were predicted using the following procedures. First, walking distances from the rental stations where riders returned the public bicycles to the final destinations were obtained by field investigation, and the 85th percentile statistical values were used as the scopes of influence of those stations. Then, a relationship model among the rental demands for public bicycles and the features of land use inside the influence scope of the rental station was established based on a linear regression model. Finally, considering the public bicycle system in the old urban region of Zhenhai in Ningbo city, the newly established prediction model for rental demand was tested. Results show that the model can predict the daily rental demand, rental demand during the morning peak, returns during the morning peak, rental demands during the evening peak, and returns during the evening peak. The demand prediction model can provide a significant theoretical basis for preparing the layout stations, operation and management strategies, and vehicle scheduling in the public bicycle system.
Introduction
Since 2009, the public bicycle system has rapid development in China. As the conventional type, the public bicycle system has fixed rental stations. But since 2016, a large number of shared bicycles have appeared in many cities in China, namely, public bicycles without fixed rental stations based on the Internet, and related scholars have studied the operation of shared bicycles. However, the development prospects of shared bicycles in China are still unclear, and since 2018, the operation of the shared bicycle companies has become increasingly difficult, while the conventional public bicycle systems with fixed rental stations are operating well. Therefore, this article still only uses the conventional public bicycle system as the research object. As an important theoretical basis for carrying out scale analyses; identifying station locations; and operating, scheduling, and managing public bicycles; the rental demand studied in this work is primarily the demand for rental and return of bicycles during different periods of time at selected stations. Sufficient research relevant to public bicycle systems has not taken place due to short-time development in China. Available research about demand prediction mainly focuses on the prediction of demands related to the following three aspects: rental and return, vehicle scheduling, and transferring.
For predicting the demands in rental and return, Lu et al. 1 proposed a prediction model for rental and return demands at service points using a recurrent neural network in an long short-term memory (LSTM) element based on deep learning theory, which model was mainly used for the short-term prediction of rental and return demands in rental stations. Considering the share ratios of public bicycles, a prediction model of rental demands for public bicycles was established by Wu et al. 2 on the basis of future annual resident traveling OD by a multinomial logit model. Lin and Dou 3 proposed a prediction model based on network diagrams to predict the demand for public bicycle rentals at a certain station in the future. To predict the demands in vehicle scheduling, He et al. 4 combined the demand prediction model and scheduling model into a bi-level model with iterative feedback and then obtained the demand prediction model under an optimal dynamic scheduling scheme through computer simulation. Xu et al. 5 analyzed the behavior of the traffic surge in public bicycles during rush hour periods and correlated it with the land utilization patterns with respect to both time and space, and also established a prediction model for the dynamic scheduling demand. Hu et al. 6 built an optimal scheduling model for vehicles based on the disequilibrium in the demand for urban public bicycles during rush hour periods and then applied the Tabu search algorithm to solve the model. Regarding the prediction of demands in transferring, W Zhizhou et al. 7 established the binary transfer choice model for public bicycles by investigating the factors affecting transfer demand in public bicycles based on a disaggregate model. Y Zhaozhao 8 studied the transfer demand between rail transportation and public bicycles based on the concept of generalized cost and proposed a planning model for the site selection of the rental station. S Xiang 9 analyzed actual survey data and identified the factors affecting the choices in travel modes of travelers who transfer to rail transportation and also proposed a prediction model for the transfer demand using the multinomial logit model. Unlike in China, public bicycle systems developed earlier in several foreign countries; however, they had relatively smaller scales and were not deemed very significant in urban transportation development. Hence, the corpus of work by foreign authors regarding demand prediction of public bicycles is relatively small. F Inês and R Anabela 10 studied in detail the factors that influence the rental demand of public bicycles, as well as studied the case of Coimbra city in Portugal. W El-Assi et al. 11 studied the public bicycle system in Toronto and built a prediction model of rental demands for public bicycles based on the architectural environment and weather.
In general, previous research that focuses on the demand prediction for public bicycle transport systems is inadequate. There are different factors that influence the rental demand for public bicycles at the station, among which the attribution and intensity of development of the land surrounding the station are the predominant. Therefore, considering the insufficient availability of relevant studies, a prediction model of the rental demand for public bicycles based on land use was researched and established in this study, which lays a theoretical foundation for the planning, construction, operation and management of public bicycle systems.
Influence scope of demand of rental station
Determination of the influence scope of demand for a rental station is an important step in predicting the rental demand for public bicycles. The radiation range of the rental station can be expressed either by the walking distance after returning the bicycle or by the walking distance before renting the bicycle. The statistical results obtained by the two methods should be consistent. However, it is difficult to investigate the walking distance before renting a bicycle because the starting point before renting the bicycle is difficult to investigate. Therefore, for the ease of analysis and problem-solving, walking distances from the rental station where riders returned the rented public bicycles to their final destinations were considered as the radiation ranges of the rental station. These were also considered as influence scopes of rental station demands for public bicycles during the demand prediction.
In order to acquire accurately the actual distances from the rental station to the final destinations, the fixed-point tracking method was used in this study instead of traditional questionnaire surveys, so that the privacy of the riders was not compromised. The investigator objectively and accurately calculated the actual walking distances by tracking the walking routes of the riders using the Gudong application in mobile phones.
The public bicycle system in downtown area of the city of Ningbo was chosen for this study, and the walking distances from rental stations where the riders returned public bicycles to their final destinations were obtained by approximately 500 sets of effective route tracking data acquired from different types of rental stations in different districts during different time periods, including the rush hour period on workdays, ordinary period on workdays, and normal period during weekends. The survey day is good weather, suitable for cycling. And, the number of different locations and different types of rental stations selected is basically equal. Statistical analysis with an interval of 15 m was performed on the values of the actual distances that fall in this interval. The notation “15 m” means that the walking distance ranged from 0 to 15 m, while “30 m” indicates that the walking distance ranged from 15 to 30 m. Figure 1 shows the statistical results of walking distances from the rental stations where riders returned public bicycles to the final destinations.
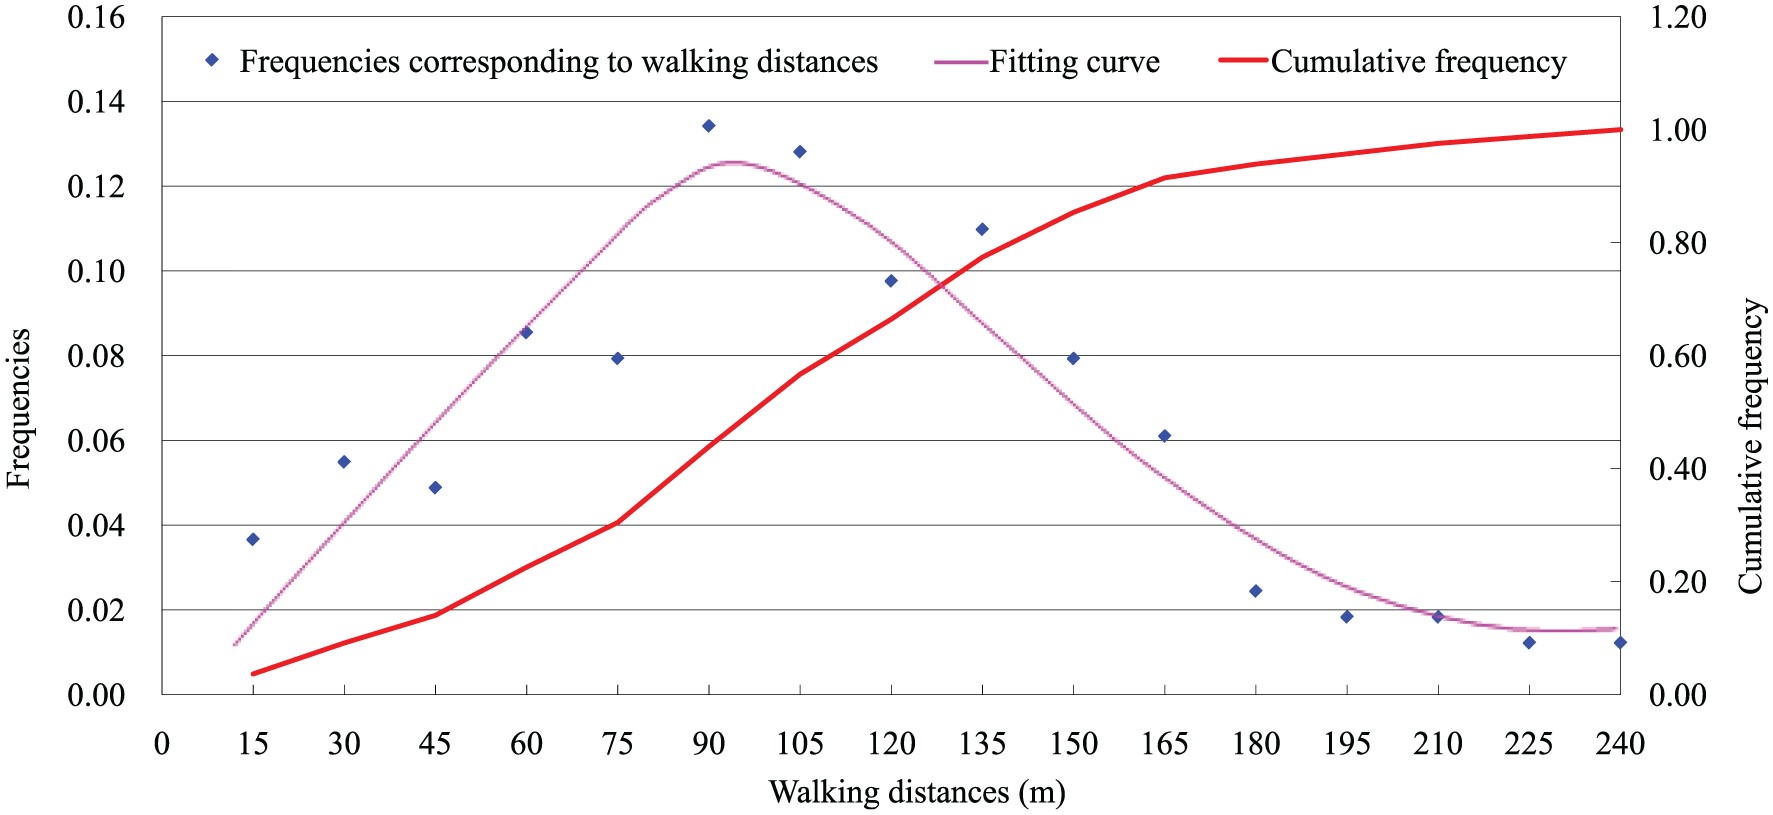
Statistical analysis of walking distances from rental stations to final destinations.
Figure 1 shows that the walking distance corresponding to the largest frequency ranged from 75 to 90 m. The statistics indicate that 85% of the riders walk less than 150 m, while few riders walked more than 240 m. For the purpose of this research, the demand influence scope was defined as the largest walking distance, corresponding to accumulative frequency of 85%. A similar conclusion was also obtained in Shinan et al., 12 which collected the walking distances from public bicycle stations to destinations in Beijing through questionnaire surveys. This similarity arises from the fact that in large- and medium-sized cities, the distribution densities of public bicycle rental stations are relatively higher and riders had considerable similarity in their acceptability of walking distances, which indicates that the demand influence scope of public bicycle station has a universal significance.
Establishment of prediction model for rental demands
Based on the above research results, the demand influence scope of a public bicycle rental station should be a circular range with a radius of 150 m and the station as the center. Because there are gaps between the circular boundaries, so some land will have no corresponding rental stations. But in fact, each land has a corresponding rental station. Therefore, considering the connection between the stations, the demand influence scope of a public bicycle rental station was considered to be a 300 m × 300 m square in order to avoid gaps between the influence scopes of rental station demand. Therefore, the demand influence scope of each rental station was computed as 9.0 (100 m) 2 , which was consistent with the densities of public bicycle stations in most cities.
If the distance between stations is larger than this scale range, then the scale range will be used as the actual analysis range. Otherwise, the range will be jointly divided, based on which actual analysis range of each station will be then determined (Figure 2).

Schematic diagram of divisions in analysis ranges of rental stations: (a) ideal state and (b) actual state.
As per the Code for Classification of Urban Land Use and Planning Standards of Development Land (GB 50137-2011), urban development land is divided into eight classes as follows: Residential land (R), Administration and Public Services land (A), Commercial and Business facilities land (B), Manufacturing land (M), Transportation land (S), Logistics and Warehouse land (W), Municipal Utilities land (U), and Green Space land (G). Considering that, in typical cities, the area demarcated as Logistics and warehouse land (W), Municipal utilities land (U), and Green space land (G) are small and the rental demands for public bicycles are not large, the designations for the above three types of land are uniformly replaced by Other land (H) for the convenience of analysis and calculation.
During the detailed analysis and calculation, the area and plot ratio of land use within the analysis range should be determined through the statistical analysis of the documents related to the land use patterns of the area where the public bicycle rental station is located. Based on the area and plot ratio obtained, the overall prevalence of every type of land use within the specific analysis ranges of the rental station can be calculated. Because the main influencing factors of the public bicycle rental demand are the population and the corresponding travel characteristics within the radiation range, which are determined by the land properties and its area and floor area ratio within the radiation range. According to the existing research results in the field of traffic engineering, the relationship between traffic demand and land use basically adopts a linear model. Therefore, this article uses a linear relationship model to study the relationship between public bicycle rental demand and land use. Based on the above analysis, a regression analysis model can be used to build the mathematical model of rental demands at public bicycle stations and total extents of exploitation of various types of land, as represented by the following equation

where
Model verification
In order to verify the feasibility of the mathematical model proposed in this article and to assign actual values to the model parameters, data pertaining to the old urban region of Zhenhai in Ningbo city was analyzed in this article. Zhenhai is located at the northeast corner of Ningbo city, has an area of about 5.0 km2, and has 52 public bicycle stations in total with approximately 1000 public bicycles. Due to geographical limitations, the distances between public bicycle stations inside and outside the old urban region of Zhenhai are all larger than 5 km, and therefore, they are seldom mutually connected. The public bicycle system inside the old urban region of Zhenhai is relatively independent, and its operation is steady, with an average daily rental amount of around 5.5 times. Since it is an old urban region, it had been built according to the previous, detailed regulatory plan. Hence, specific documents regarding land use in the detailed regulatory plan can be used to replace the documents that provide information about the current land use pattern.
According to the current layout of public bicycle stations in Zhenhai, the demand influence scopes of public bicycle stations were divided as shown in Figure 3 based on the radiation range of public bicycle stations.

Schematic diagram of layout of public bicycle stations in old urban region of Zhenhai.
The use of land in the old urban region is relatively simple, and the categorization is mainly as residential land, public land, and commercial land. Situations of the above three land use types were analyzed here. Equation (1) can be simplified as follows

Statistical analysis was performed on relevant data about the features of various types of land use within the demand influence scopes of rental stations, which data mainly include area and plot ratio of land use, and the total exploitation details obtained through multiplying the land area and the average plot ratio (see Table 1).
Data of features of land use within demand influence scopes of rental stations in old urban region of Zhenhai.

The daily rental amount was basically the same as the daily return amount, while the rental amount and return amount at each station during rush hour period were significantly different. Therefore, five rental demand amounts stated as follows were selected as testing variables for model verification and analysis: daily rental amount, rental amount during morning peak, return amount during morning peak, rental amount during evening peak, and return amount during evening peak. Here, the morning peak was from 7 a.m. to 9 a.m., and evening peak was from 4:30 p.m. to 6:30 p.m. In order to enhance the reliability of model verification, data of public bicycle rental in old urban region of Zhenhai during five workdays were selected, and average values of rental amounts and return amounts during various periods at all stations within these five workdays were obtained, which average values were used for model verification, as shown in Table 2.
Rental and return amounts during various periods at stations.

Based on the simplified model given by equation (2), regression analysis was performed on data listed in Table 2, which yielded functional relationships among the five predicted demands, the various manners of land use, and all parameters, as listed in Table 3. The five predicted demand values included the daily rental amount (times per day), rental amount during morning peak (times per 2 h), return amount during morning peak (times per 2 h), rental amount during evening peak (times per 2 h), and return amount during evening peak (times per 2 h).
Parameters corresponding with demand prediction amounts.
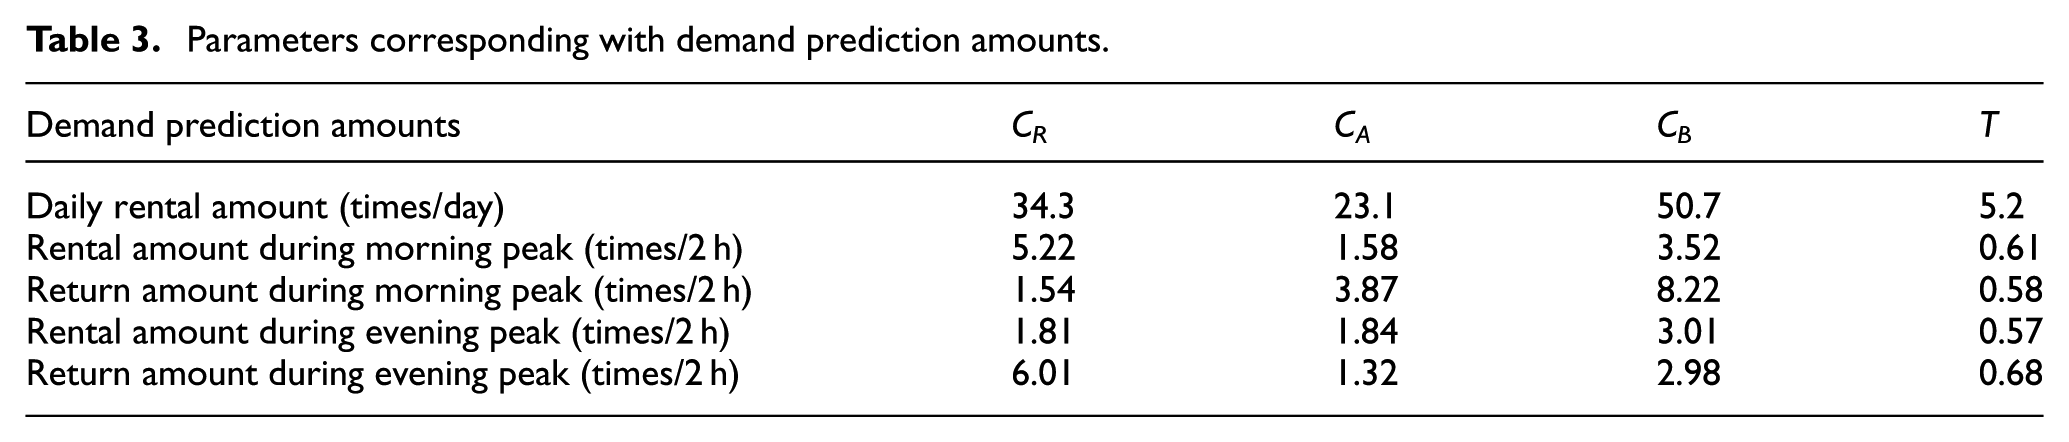
Through the test of the linear regression model, the specific parameter values of the rental demand model of each station in different time periods can be obtained. And, the results of the model verification show that the prediction model of rental demands for public bicycles based on land use can efficiently predict the rental and return demands for public bicycles during various periods, and can yield parameters that provide references for the demand prediction of public bicycle rentals in similarities.
Conclusion
Demand prediction for public bicycle rentals is an important component of the theoretical basis for the layout planning, operation, management, and vehicle scheduling of public bicycle systems. Land use is a primary factor affecting the rental demand for public bicycles. The demand influence scope of the rental station, which is an important premise for investigating and establishing relationships between the rental demands in public bicycle stations and land use, is needed to determine extent of the region whose land use pattern must be considered in order to correctly predict the demand for public bicycle rentals. In this study, walking distances from the rental station where riders returned public bicycles to the final destinations were obtained through field investigation, and the 85th percentile statistical values were used as the influence scopes of the respective rental stations, based on which the actual influence scopes of rental demands in stations were studied and determined according to topological relations among the stations.
During the investigation and establishment of the relationship model among rental demands for public bicycles and features of land use inside the influence scope of rental station, a demand prediction model was built using a linear regression model based on normal methods applied to predict traffic demands. In order to verify the accuracy and reliability of the established model, data pertaining to the public bicycle system in the old urban region of Zhenhai in Ningbo city were studied in this work, and the established prediction model of rental demand was verified. The results show that the model can predict accurately the five rental demand values, including the daily rental amount, rental amount during morning peak, return amount during morning peak, rental amount during evening peak, and return amount during evening peak.
Based on above details, the demand prediction model established in this article can well reflect the relationship between land use and rental demands for public bicycles and thus can provide significant theoretical support for the planning, construction, and management of public bicycle systems.
Footnotes
Handling Editor: Hai Xiang Lin
Declaration of conflicting interests
The author(s) declared no potential conflicts of interest with respect to the research, authorship, and/or publication of this article.
Funding
The author(s) disclosed receipt of the following financial support for the research, authorship, and/or publication of this article: This research was funded by the Natural Science Foundation of Zhejiang Province, China (LY17E080013); the Natural Science Foundation of Jiangsu Province, China (BK20171426); and the Philosophy and Social Science Program of Zhejiang Province, China (19NDJC119YB).