
Abstract
This work presents primary results of a parameter study for entrained flow gasification using a steady-flow reactor model. The influences of important parameters such as coal types, gasifier pressure, gas/coal feeding rate, and coal particle size were studied based on coal conversion and gas product species. The prediction results were compared and validated against those published previously. In particular, a relative importance of reaction stoichiometry, temperature, reaction time (kinetics), or residence time considered in this simulation work was evaluated to affect the gas composition produced from different coals. The optimal carbon monoxide concentration was observed at an oxygen-to-fuel ratio of 0.8, while a greatest carbon conversion was found at a steam-to-fuel ratio of 0.4. Coal particle size has a strong influence on carbon conversion. However, the coal feeding rate has no effect on carbon conversion despite differences in residence time.
Keywords
Introduction
In Korea, commercial operation of a newly constructed 300-MW integrated gasification combined cycle (IGCC) power station equipped with an oxygen-blown gasifier commenced in 2016. 1 Six other commercial IGCC power plants exist in Japan, Europe, and the United States.2,3 Coal gasification process occurs at relatively high pressure and temperature. It is of importance to improve a numerical model for designing these facilities because little experimental data have been documented on phenomena in hot pressurized gasifiers.
Many process parameters affect the composition and temperature of product gases, such as the oxygen/steam-to-fuel ratio, particle size, coal feeding rate, and injection velocity. Some of these parameters are related to particle residence time. In particular, particle size influences the residence time required to complete the gasification process.4,5 A smaller particle size enables a higher quality of gas product because of a longer residence time to accomplish more conversion of the coal. 6 Chen et al. 7 demonstrated that smaller particle sizes produced a higher amount of syngas. Similar findings were observed in a fluidized bed where a process is governed by the enhanced reaction kinetics for smaller particles. 8 In this condition, kinetic control is shifted to mass transfer control as the particle size increases.
The one-dimensional (1D) modeling work of Vamvuka et al.9,10 demonstrated the influence of coal feeding rate on carbon conversion, which is also relevant to residence time. The quantities of gaseous species and its velocity increase, which is due to increased coal feeding rate. As a result, the residence time decreases and coal conversion decreases. However, other factors, such as the number of particles within the reactor, become prevalent when the coal feeding rate increases. This change increases the gasification rate and thus overcomes the reduced conversion caused by reduced residence time. Therefore, controversy over the effect of the coal feeding rate still persisted.
In the equilibrium model work,11–14 product gas composition was evaluated and described in terms of gas feed rates such as oxygen and steam. However, the equilibrium model cannot give useful information on the effects of particle size and coal feeding rate relevant to residence time. The 1D reactor model 15 or a computational fluid dynamics (CFD)-based model 16 would be more suitable to predict the effects of these factors. Although the CFD models generally describe two- or three-dimensional features such as turbulence, recirculation, or particle tracking, they are too time-consuming to be used in parameter studies. Thus, the 1D reactor model is preferred for these applications.
There are different simplifications made for developing 1D reactor models.17–24 Some have neglected momentum balance while considering mass and energy balances.9,10,17 Some solved momentum balance to calculate particle velocity.18–21 Some used a linear variation of wall temperature,18,19,22 while wall temperature has been calculated together with gas/solid temperature.20,21 While a 1D reactor model was described to predict entrained flow gasifier performance along the reactor, 22 the scope of that study was limited to examining the influences of oxygen and steam supply rate on carbon conversion, gas composition, and temperature. Even with 1D models, most previous studies did not report the isolated influence of particle size and coal feeding rate except few studies,10,18 but both factors have considerable influence on the kinetics of the gasification process.
The previous work involving the 1D reactor model have studied with the same coal type. Although coal feed commonly changes in most gasification plants, the effect of coal feed has not been studied thoroughly except for the work of Kasule et al. 20 In their study, different coal types have been considered. Furthermore, the applicability of the equilibrium model to examine the response to coal change has not been studied. The comparative study between the 1D reactor model and the equilibrium model would be useful to highlight the limitation or applicability of the equilibrium model when different coals are used as feedstocks. Therefore, the significance of either kinetic effect from reaction or residence time effect from hydrodynamics considered in the 1D reactor model is determined for affecting the gas composition produced from different coals. Monaghan and Ghoniem 25 developed a dynamic reduced order model (ROM) for various entrained flow gasifiers. The ROM incorporates submodels for different feedstocks, mixing and recirculation, drying and devolatilization, reaction kinetics, heat transfer, and slagging behavior. They continued to validate their model (ROM) against steady-state simulation of four entrained flow gasifiers where experimental data are available. 26
In this work, a 1D reactor model was developed to investigate the influences of operational variables. The effects of important variables such as coal feed type, gasifier pressure, coal feeding rate, and particle size were studied based on coal conversion and product gas species. The prediction results were compared and validated against previously published results and equilibrium results if any.
Numerical model and solution
Chemical reactions
When a coal–water slurry is introduced into a gasifier, a number of thermochemical processes will take place inside the gasifier. The slurries are rapidly heated and the moisture content is vaporized, after which the volatile content is released and burned with oxygen. The remaining char particles are reacted with oxygen and further gasified with other reactants through char–gas reaction. This segment of the process is called char combustion and gasification. At the same time, the gaseous components produced from the solid–gas reaction react with other species according to either equilibrium theory or finite reaction rate theory. Some amount of heat is released or absorbed during the coal combustion and gasification period. One of the char–gas reactions is a char–oxygen reaction, that is, an exothermic heterogeneous reaction where coal particles produce carbon monoxide, carbon dioxide, and steam after reacting with oxygen

Once oxygen is completely consumed, more heterogeneous reactions occur where char particles react with steam and carbon dioxide. Among these reactions, the char–H2O reaction and char–CO2 gasification reaction (equation (3)) are endothermic, which are shown in reactions in equations (2) and (3). These reactions are supported by energy released from the char reaction with oxygen


The carbon reaction with hydrogen is exothermic and produces methane and steam
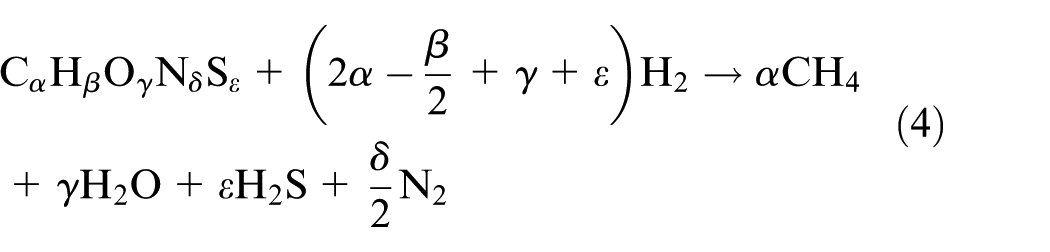
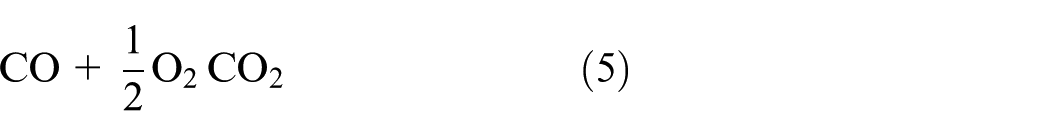
Besides the heterogeneous reactions described above, several gas reactions are also important to be considered. The reactions include the combustion of CO and H2, CH4 formation, and a water–gas shift (WGS) reaction (equations (5)–(8), respectively)


Model equations
Based on those chemical reactions, mathematical equations controlling the coal gasification were developed. These equations include mass balance, energy balance, and momentum balance. Those are time independent and 1D. A list of these equations is provided in Table 1. In equations (9)−(13), ms is the flow rate of the solid and Ng is the flow rate of the gas phase, Nv is the number of solid particles within a reactor, Vst is the terminal velocity of the solid, Vs is the velocity of the solid, Ts is the solid temperature, and Tg is the gas-phase temperature in the energy balance available in equations (11) and (13).
Details of mathematical equations used in this model.

In the mass balance of the solid component in equation (9), the coal flow rate was calculated by the reaction degree of the char reactions. The gas diffusion and chemical kinetics were considered in species balance of gaseous component for solid–gas reactions. The reaction degree of gas-phase reactions was calculated using four equilibrium relationships. The detailed expression of this model and rate expression can be found in a previous work. 22
An enthalpy of coal particles was changed by energy generated by the solid–gas reactions and convective/radiative heat transfer as shown in equation (11). An enthalpy of the gaseous components in the first term of equation (13) was influenced by convective/radiative heat transfer, energy generated by the gas reactions, and energy transfer toward wall. Particle velocity was calculated by equation (10) using Stokes’ law instead of by solving the momentum balance. This would work in a downdraft gasifier.
Wen and Chaung 18 simulated the experimental data of Robin 2 performed on the Texaco pilot plant gasifier. These simulation and measured data were used to validate the current model. Therefore, coal properties and feed input conditions are similar to those used in the experiment of Robin 2 as well as in the previous work of the authors. 22 The oxygen/fuel ratio was varied from 0.5 to 1, while the steam/fuel ratio ranged from 0 to 1. Furthermore, the coal feed rate ranged from 50 to 100 g/s. The baseline coal particle size was 40 μm, and this size was increased to a maximum of 160 μm. Finally, three different pressures from 2 to 4 MPa were used in the simulation to examine their effects on carbon conversion.
Solution methodology
Differential equations of the solid-phase particles were solved by a semi-implicit method with an adjustable length size scheme as used in a previous simulation. 22 The differential equation was solved from a smaller step size of the gasifier which was automatically increased before the exit of the gasifier is reached. A non-linear solver algorithm available in MATLAB software was used to solve algebraic equations of the gas-phase components. A detailed calculation procedure is found in the previous paper. 22 All simulations took less than 15 min on a desktop personal computer with a variable length scale used in the semi-implicit method. In contrast, a simulation using the fourth-order explicit Runge–Kutta method with a constant length step took 2 h on the same desktop computer.
Results and discussion
Model validation
Using the coal as previously discussed, the model results are first validated by comparing with the experimental data in Texaco pilot plant. Unlike the simulation for the parametric study, this validation run was carried out under the same fixed operating conditions. Those represent the feed conditions available in a Texoco pilot plant data available in Robin’s 2 experiment and Wen and Chaung’s 18 simulation. The validation result is shown in Figure 1. The comparison shows a reasonable resemblance of the gas composition results to the experimental data. Additional validation results with the Texaco pilot plant data are found elsewhere. 22 These include the gas composition and carbon conversion data compared for different stoichiometric conditions.

Comparison of the current model and experiment in terms of gas product.
The second validation was made using four different coal types available in Kasule et al.20,21 In their work, the effect of coal properties on the product species profile was numerically studied. Information on the proximate and elemental composition of coal is listed in Table 2. In the table, a lower heating value was predicted by Dulong’s formula where the elemental analysis values of various coal feeds are used. Figure 2 shows the current prediction results of product gas distributions when different coals are used under the same gas feed conditions. The same kinetic parameter was used for different coals. The results show a significant change in the gas products with different coals. As an example, the Powder River Basin (PRB) coal and lignite with lower carbon content and high oxygen content produce low amounts of CO and H2 when compared with high-rank coal. This is expected from the stoichiometry of the char–CO2 reaction in equation (2) and the char–H2O reaction in equation (3). Furthermore, a modest reduction in temperature is observed in Figure 3 probably due to a smaller lower heating value as coal types changed from high- to low-rank coal. This is another mechanism which is responsible for the low production of CO and H2 observed with low-rank coal. This response to coal type change is the same to simulation results of Kasule et al. where the same coals were used as shown in Figure 4.20,21. Again, these results exhibit that gasifier performance is dependent strongly on coal feed types (Table 2).
Properties of different coals used for the second validation.

PRB: Powder River Basin.

Product gas distribution of various coal feed types under gas feed conditions of O2/coal ratio = 0.8 and H2O/coal ratio = 0.4 from the current 1D reactor model.

Time-weighted average gas temperatures for different coal feed types.

Gas composition from Kasule et al.’s simulation and the current reactor model.
Finally, the gas composition was compared against those predicted by the equilibrium model in Figure 5. The open source software Cantera was used for equilibrium calculation where the in-house code was written in Python language. The calculation with the Cantera can provide a full equilibrium solution by minimizing the Gibbs free energy on a non-stoichiometric basis. Unlike the gas-phase calculation, coal in the solid phase was particularly accounted for the Cantera. More details about this software have been well documented in the literature.12–14 Comparison of the computed data in Figures 2 and 5 shows a good agreement of gas composition in response to coal change. For example, the PRB coal and lignite with lower carbon content and high oxygen content still produce low amounts of CO and H2 when compared with high-rank coal. This indicates the importance of stoichiometry and energy balance (temperature) considered in equilibrium calculation in controlling the product gas composition as the coal types change. In other words, a reaction time (kinetic) effect from reaction or residence time effect from hydrodynamics considered in the 1D reactor model may not be significant to affect the gas composition produced from different coals.

Product gas distribution of various coal feed types predicted by the equilibrium model under the same gas feed conditions used in the 1D model.
Effect of gas feed rate
After the validation, parameter analyses are done to obtain information on gasifier performance under several operating conditions using the same numerical model. The composition of coal used for parameter analyses is listed in Table 3. For this study, model results were first obtained for different oxygen/steam feed rates with all other parameters held constant. The average gas temperature was predicted at the gasifier exit using the energy balance equation based on both heat loss and heat generation. The gas temperatures at various steam/fuel and oxygen/fuel ratios are plotted in Figure 6. The results show decreasing temperature with a decreasing oxygen/fuel ratio, which is particularly prevalent at higher H2O/fuel ratios. Higher O2/coal ratios favor the exothermic reaction in equation (1), which causes high coal reactivity and results in a greater carbon conversion. The reactor temperature exceeds 1200 K under most conditions. In this range of high temperature, two reactions, that is, WGS and CH4 formation are thermodynamically inhibited to produce CO gas, as shown in Figure 7. Instead, solid–gas reactions are inferred to significantly affect CO concentration. 22
Properties of coal used for this parameter analysis (as-received basis).


Gas temperatures at various steam and oxygen feed rates.

Influence of O2/fuel on CO concentration at several H2O/fuel ratios.
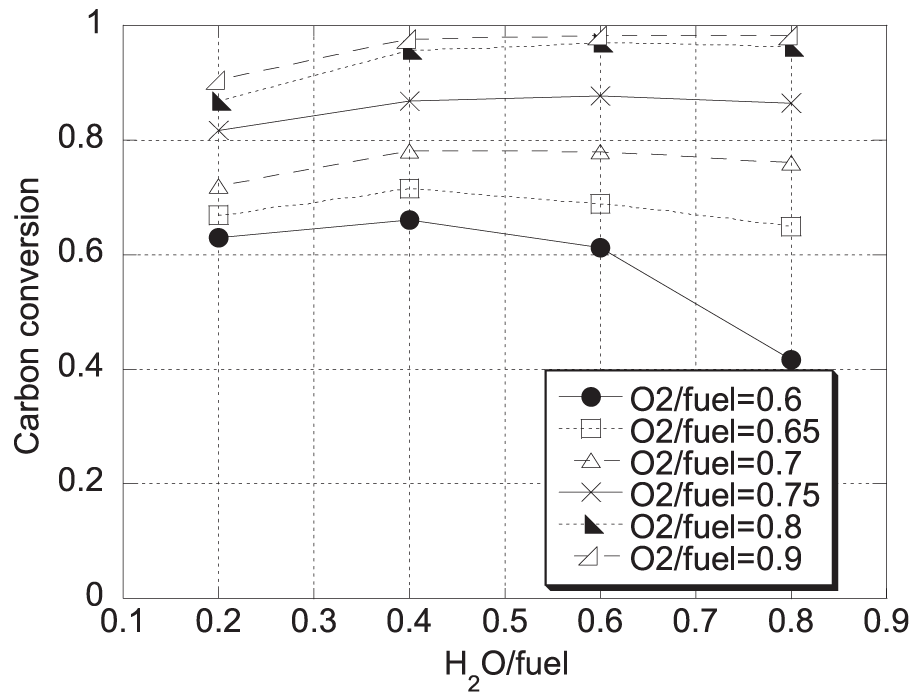
Figure 7 presents the influence of the O2-to-fuel ratio on CO concentration at different H2O-to-fuel ratios. With the increasing O2-to-fuel ratio, the CO concentration increases because of higher temperature. Consequently, this comes to situations where carbon conversion from the solid–gas reaction increases. When an O2/fuel ratio goes above 0.8, CO decreases because more available oxygen prefers CO2 formation from solid–gas combustion. These behaviors are consistent with those of Zainal et al. 27 However, the optimal O2/fuel ratio was reported to be 0.6 in the numerical simulation study of Seo et al. 28 When the H2O-to-fuel ratio increases, carbon monoxide is reduced as a result of lower temperature and the correspondingly reduced solid–gas reactions. The decreasing trend of CO concentration above the optimal O2/fuel ratio is not observed in the higher H2O/fuel ratio case where the temperature effect dominates the CO2 formation effect. This effect of the H2O/fuel ratio is more pronounced at lower O2/fuel ratios.
Figure 8 presents the influence of the H2O-to-fuel ratio on coal conversion under several O2-to-fuel ratios. A maximum carbon conversion was found at a steam-to-fuel ratio of 0.4 when the O2-to-fuel ratios of 0.6–0.7 are low. The increased amount of H2O stimulates the char–steam reaction and accordingly increases char conversion. Simultaneously, the WGS reaction produces the amounts of CO2, which accelerates the char–CO2 reaction, and increases char conversion. However, a char conversion begins to decline if the steam/fuel ratio increases excessively. This decline is ascribed to two effects of reaction temperature and steam/CO2 concentration as fully described in a previous work. 22 This behavior is found in the results of Wen and Chaung 18 This is also similar to the simulation results of Kasule et al. 20 where an optimum steam/fuel ratio exists around 0.3 and 0.4. The inflection behavior is not observed anymore as the oxygen-to-fuel ratio increases.
Influence of the H2O/fuel ratio on coal conversion under several O2/fuel ratios.
Effects of coal feeding rate and size
The current model was useful to investigate the efficiency of gasifier when the coal feed rate and size changed. The results were computed when the coal loading rates varied from 50 to 100 g/s. Coal sizes between 40 and 160 μm were used to examine its effect on the gasification extent at different coal feeding rates.
As discussed in the section “Introduction,” coal size strongly affects carbon conversion, as shown in Figure 9. Small particles have lower terminal velocities and therefore particle velocity, which result in high residence times. This increase in residence time is clearly shown on the right-hand side of the figure. This behavior is also seen in raw velocity data of Figure 10. Furthermore, small particles have higher specific contact areas for solid reaction, which was observed from Brunauer–Emmett–Teller (BET) surface area measurement. In addition, there is less diffusional resistance with smaller particles. These combined effects are responsible for the greater carbon conversion observed with smaller particles at a given coal feeding rate.

Effects of coal diameter on residence time and coal conversion at different coal feeding rates.

Axial variation of particle velocity for different coal particle sizes.
In the same figure, a coal feeding rate is shown to have no significant effect on carbon conversion despite the corresponding influences on residence time. The amount of gas products and the velocity increase, as the coal feeding rate increases. Consequently, the residence time decreases for a given gasifier length. Lower residence times with higher coal feeding rates may produce lower carbon conversion, but were not found to significantly affect carbon conversion. This finding may be attributed to an increase in the number of coal particles per a reactor volume with increased coal feeding rate, which increases the gasification rate and thus may overcome reduced conversion caused by reduced residence time. The less effect of coal feeding rate is in line with the findings of Wen and Chaung, 18 in which the contribution of initial particle velocity was found to be negligible compared with the effect of particle size. However, these results differ from those of Vamvuka et al., 10 which indicated that carbon conversion decreased significantly with the increase in coal feeding rate.
As shown in Figure 11, product gas composition was also affected greatly by particle size, but was not affected significantly by coal feeding rate. This trend is expected by the carbon conversion shown in Figure 9. A decreasing trend of CO and H2 with a larger particle size was also observed in the work of Hernández et al. 29 Chen et al. 30 also demonstrated that larger particle size was associated with shorter residence time and resulted in lower yields of gas product.

Effects of coal size on gas product on wet basis at different coal feeding rates.
Effect of operating pressure
The pressure was changed to investigate its effect on gasification behavior. Figure 12 presents the variation of carbon conversion with operating pressure. The reference pressure was 2 MPa, and this pressure was increased up to 4 MPa. Increasing the pressure increases carbon conversion, but the degree of increase is much pronounced especially at high H2O/fuel and O2/fuel ratios less than 0.8. These conditions correspond to low-temperature condition. The pressure effect is not significant at O2/fuel ratios exceeding 0.8. This behavior is identical to that reported by Wen and Chaung, 18 but differs from the results of Vamvuka et al. 10 Vamvuka et al.’s results showed that carbon conversion is strongly dependent on pressure changes at lower H2O/fuel ratios. This pressure dependence is expected by first-order kinetics in the rate expression of equation (9) where the reaction rate of the kth solid–gas reactions is proportional to pressure. This appears to be prevalent when temperature is low.

Effects of pressure on carbon conversion at several H2O/fuel and O2/fuel ratios (ms = 50 g/s, ds = 40 μm).
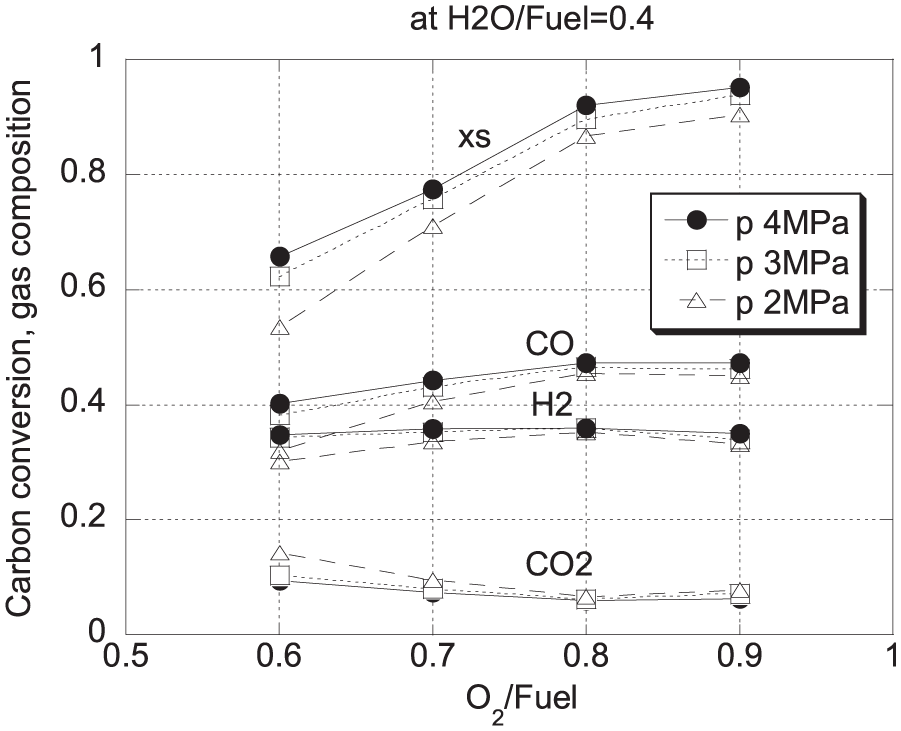
Under a constant O2-to-fuel ratio of 0.8, product gas composition is plotted against the H2O-to-fuel ratio with three pressure conditions in Figure 13. Increasing pressure slightly increases the CO and H2 concentrations in addition to carbon conversion, but decreases the CO2 concentration. This tendency is consistent with that reported by Ajilkumar et al. 23 As expected, this behavior caused by the pressure effect is more pronounced at higher H2O/fuel ratios.

Effects of pressure on gas product at several H2O/fuel ratios (ms = 50 g/s, ds = 40 μm, O2/fuel ratio = 0.8).
Figure 14 presents the results of gas product plotted against the O2-to-fuel ratio with a constant H2O-to-fuel ratio of 0.4. The change in gas composition associated with the pressure increase is more discernable when the O2/fuel ratio falls below 0.8. In contrast, increasing pressure does not effectively increase carbon conversion at O2/fuel ratios above 0.8. Increased conversion with increased pressure was reported in the simulation work of Lee et al. 31 As the operating pressure increases, carbon conversion increases because the reaction rate of the char–H2O and char–CO2 reactions increases. It is instructive to note that this pressure effect might not be significant when the prediction is made by the equilibrium model.
Effects of pressure on gas product at several O2/fuel ratios (ms = 50 g/s, ds = 40 μm, H2O/fuel ratio = 0.4).
Conclusion
This work presents some results of parameter studies using the developed simulation model. The effects of important parameters such as coal type, gas/coal feeding rate, gasifier pressure, and particle size were studied based on coal conversion and gas product. The prediction results were compared and validated against previously published results. The results show that the coal type strongly affects the product composition. The importance of stoichiometry and energy balance (temperature) in controlling the product gas composition was addressed as the coal types change. These results also show that the reduction of CO with decreasing O2-to-fuel ratio was caused by the reduced temperature and weaker solid reactions. A maximum carbon conversion was found at a steam-to-fuel ratio of 0.4, which is due to the concentration of steam/carbon dioxide and temperature. Coal particle size has a significant influence on carbon conversion where smaller particles yield greater carbon conversion for a given coal feeding rate. The coal feeding rate has no effect on carbon conversion despite differences in residence time. A pressure increase can intensify carbon conversion, which is predominant at high H2O-to-fuel ratios and at low O2-to-fuel ratios.
Footnotes
Appendix 1
Handling Editor: SA Shehzad
Declaration of conflicting interests
The author(s) declared no potential conflicts of interest with respect to the research, authorship, and/or publication of this article.
Funding
The author(s) disclosed receipt of the following financial support for the research, authorship, and/or publication of this article: We thank the Korean government (MEST) for their financial support (NRF-2017R1D1A1B03029138). This work was also supported by the Human Resources Development program (No. 20184030202060) of the Korea Institute of Energy Technology Evaluation and Planning (KETEP) grant funded by the Ministry of Trade, Industry and Energy of the Korean government.