
Abstract
Positioning error of the feed drive system has great influence of the machining quality. In order to guarantee the positioning accuracy, the linear grating scale is adopted to form a full-closed loop. However, due to the inner heat sources and environmental temperature variations, the linear grating scale could expand and the thermally induced positional deviation is generated. In this article, temperatures and positional deviations of the ball screw feed drive system and the linear motor feed drive system equipped with linear scales were tested. The factors that affect the positioning error were analyzed. Then, the temperatures and positioning coordinates were used as inputs to build the thermally induced positional deviation model of full closed-loop feed drive system. Based on the model, coordinate values of the machine tool were adjusted and the compensation was implemented. The testing results verified that after compensation, the positional deviations were greatly reduced.
Keywords
Introduction
As one important part of the machine tool, the performance of the feed drive system has great impact on the machining accuracy. When the machine tool is running, a lot of heat is generated in the bearings, the nut, and the linear motor for the ball screw and linear motor feed drive system, which may induce the positioning error and manufacturing error.
In the past few decades, the thermal characteristics of the semi-closed loop ball screw feed drive systems have been analyzed and tested. And the thermal error model has been established and used for further compensation to reduce the thermally induced positioning error. Shi et al. 1 assumed the ball screw feed drive system as one dimensional model, and analytically investigated the temperature of motor and bearings and the thermal elongation of the screw shaft. By using thermocouples and laser interferometer, temperatures and thermally induced positioning error of the semi-closed loop ball screw could be measured.2–4 According to the testing results, relationships between temperature rises and thermal error were mapped and then used for compensation.5,6 Jin et al. 7 proposed an optimized model for predicting temperature rises under operating conditions by integrating the wavelet neural network with feedback linearization autoregressive moving average. Based on the linear regression methods, H Shi et al. 8 and Zhang et al. 9 established the thermal error models of feed drive systems. And the prediction results were verified by experiments. By sending a feedback to the microprocessor, 10 axial positioning error of X-axis in a high-speed vertical machine center was reduced from 20 to 3 μm. By contrast, Li et al. 11 developed a real-time compensation system, and the positioning error of X-axis was compensated on the FANUC 31i Computer Numerical Control (CNC) system by shifting the external machine original coordinate. Besides, Xu et al.12,13 introduced an improved ball screw feed drive thermal error compensation system. Based on this system, the stroke input was calculated and modified by the controller of control unit and then the compensation was completed.
In recent years, instead of rotational encoder, linear grating scales are becoming more and more popular. They are widely used in both ball screw and linear motor feed drive system. By applying the linear grating scale, a full closed-loop is introduced. 14 It means that the position of moving component is directly determined by the linear scale. However, besides misalignment, lack of support rigidity, and vibration, temperature variation has great impact on the working accuracy of the linear grating scale. 15 This is because that when the temperature rises, the linear grating scale begins to elongate, which may lead to the positional deviation. Generally, the linear scale is made of glass or steel. When the temperature rises 1°C, the thermal growth of the linear scale may reach to 8 or 12 μm if its length is 1 m. In order to investigate this kind of error caused by the deformation of the linear grating scale, Alejandre and Artés16,17 placed a linear grating mounted on a steel structure in a thermal chamber and tested its thermal behavior. The effects of aluminum extrusion, glass scale, and the adhesive on the thermal elongation of the linear grating scale were examined. Sun et al. 18 presented a precision testing method called seven-sensor configuration method to measure the thermal errors of a horizontal machining center with linear optical grating scale. Based on testing and finite element analysis, Kim et al. 19 studied the thermal error induced by the thermal expansion of the linear grating scale in a horizontal machining center equipped with linear motors. The mutual effects of the machine tool thermal deformation, the associated movement, and the thermal elongation of the linear grating scale were analyzed.
However, few researches focus on the thermal error modeling and compensation of the full closed-loop feed drive systems. It may be because that the positioning accuracy of the feed drive system equipped with linear scale is considered good, and the thermally induced positional deviations of them are overlooked commonly. In this article, temperatures and positional deviations at different positions of a ball screw feed drive system and a linear motor system both equipped with linear scales were measured first. According to the experimental results, the factors such as the feed rate and ambient temperatures, which have influences on the positional deviations, were analyzed. Then, the thermally induced positional deviation model of the feed drive system was developed. Finally, by adjusting coordinate values at different positions, thermally induced positional deviations were compensated. The research and testing results help engineers know more about the thermal characteristics of the full closed-loop feed drive systems and provide a solution for reducing its thermally induced positional deviations.
Temperature and thermal error testing of feed drive system with linear scale
Temperature and thermal error testing of ball screw feed drive system
Testing set-up and working conditions
In this article, the temperatures and the thermal errors of Y-axis in DK-1200 gantry milling machine tool are measured. Y-axis feed drive system is driven by the ball crew and equipped with a linear grating scale (model: LS177, Heidenhain). The actual position of moving part is measured by Renishaw laser interferometer XL-80. During measurement, deadpath error may occur if the environment changes. In order to reduce this kind of error, the stationary and moving optic of Renishaw laser interferometer are abutted when the datum is set. In addition, XL-80 laser interferometer uses an XC-80 environmental compensation unit and several accurate sensors to compensate measurements for environmental effects. The configuration of the machine tool and testing set-up for thermal error testing is shown in Figure 1.

Thermal error testing set-up of the ball screw feed drive system.
Seven PT100 temperature sensors are used for testing the temperature changes of the feed drive system. Sensor 1 and Sensor 2 represent the temperature sensors which are installed close to the front and rear bearings at each end of the feed drive system, respectively. Temperature of the screw nut is measured by Sensor 3 temperature sensor. Sensor 4–Sensor 7 temperature sensors are used to test the ambient temperature around the linear grating scale. Locations of those temperature sensors are shown in Figure 2.

Locations of seven temperature sensors on Y-axis.
In this ball screw feed-drive system, bearings and nut are considered as the heat sources. Also, environmental temperature variations could lead to the thermal expansion of the linear grating scale and deviations of position. In order to analyze the factors which have more dominant impacts on the thermally induced positioning error of the ball screw feed drive system, temperatures and positional deviations at different points along Y-axis are measured under two kinds of working conditions as follows.
Y-axis is running at 6 m/min from y = 0 to y = 1400 mm (Figure 2) continuously, and the environmental temperature is rarely changed.
Ambient temperature is changed from 21.8°C to 26.0°C when the machine tool remains stationary. It assumes that the initial temperature of the machine tool equals to the room temperature.
Testing results of ball screw feed drive system with linear scale
Under working condition (a) mentioned above, the machine tool has been operated for about 4 h until it reaches to the thermal equilibrium state. Temperatures of different parts of the ball screw feed-drive system are shown in Figure 3, where environmental temperature is the average value of Sensor 4–Sensor 7. Because only Y-axis is moving, the thermal deformation of other parts is neglected.

Temperatures of different parts of ball screw feed-drive system.
From Figure 3, we clearly see that temperatures of bearings increase quickly when Y-axis is running. After 4 h, temperature rise of front and rear bearing is about 10°C and 7.6°C, respectively. When the nut is moving back and forth, a lot of heat is generated due to the friction. The temperature rise of nut after 4 h is about 6°C. In the process of testing, environmental temperature is only changed 0.4°C, which can be treated as constant. Although the temperatures of the bearings and nut are changed greatly, the maximum positional deviation only varies about 2.7 μm. It means that heat generated at the inner heat sources of the full closed-loop ball screw feed drive system (bearings and the nut) has little impact on the thermal deformation of grating scale or the position of moving part.
For the working condition (b), ambient temperatures are controlled by setting the temperature of air conditioning in the lab. When the environmental temperature changes, the positional deviations at different points along Y-axis in the range of L (L = 0–1400 mm, shown in Figure 2) are measured and the testing results are shown in Figures 4 and 5.
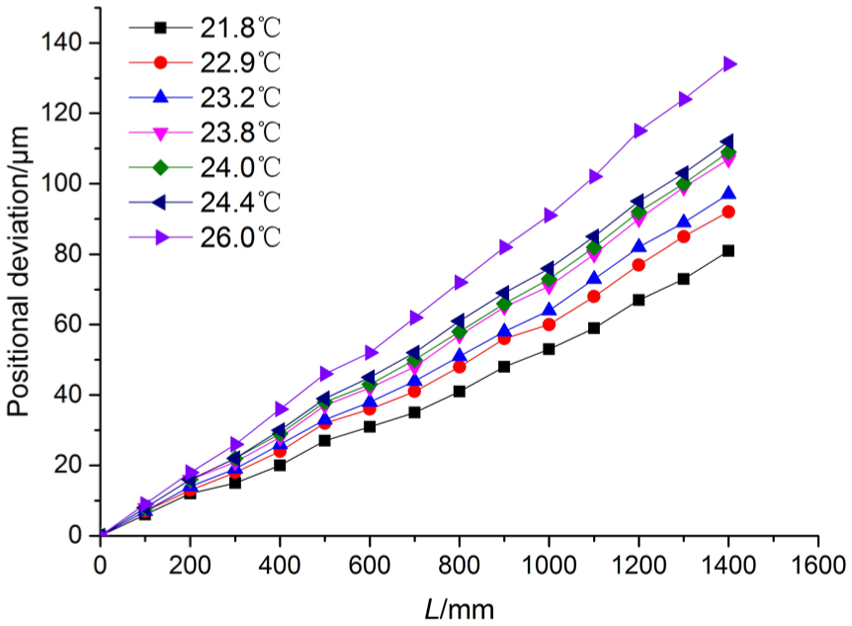
Positional deviations at different points along Y-axis at different ambient temperatures.

The maximum positional deviation of Y-axis at different ambient temperatures.
According to Figures 4 and 5, it can be seen that the positional deviations of Y-axis are getting bigger and bigger as the ambient temperature is rising. The change of the maximum positional deviation is over 44 μm when the environmental temperature varies from 21.8°C to 26.0°C. It is because that the variations of ambient temperature result in the thermal expansion of the linear grating scale which would further affect the positioning accuracy of full closed-loop ball screw feed drive system. Therefore, it is necessary to establish the thermal error model of the feed drive system and reduce the error due to the thermal deformation of the linear grating scale by compensation. The process of thermal error modeling and thermal error compensation would be introduced in “Thermal error modeling” and “Thermal error compensation” sections.
Temperature and thermal error testing of linear motor drive system with linear scale
Testing set-up and working conditions
Same with the test mentioned in “Temperature and thermal error testing of ball screw feed drive system” section, PT100 temperature sensors and Renishaw laser interferometer XL-80 are adopted to measure the temperature and the positions of the table in the feeding direction of a linear motor drive system. The linear motor feed drive system is equipped with a linear grating scale (model: LS177, Heidenhain). The testing set-up is shown in Figure 6.

Testing set-up of a linear motor feed drive system.
Four temperature sensors are placed evenly along the linear scale while another four temperature sensors are installed along the guide ways. Sensor 9 is attached to the testing bed to measure the ambient temperature. Locations of these nine temperature sensors are shown in Figure 7.

Locations of seven temperature sensors on linear motor feed drive system.
Similarly, two kinds of working conditions are selected and listed as follows. Temperatures and positioning errors of the linear motor drive system are tested under these working conditions.
Table is moving in the range of 0–1600 mm at 15, 20, and 30 m/min, respectively, for 8 h. The change of environmental temperature is controlled as small as possible.
The running speed of the linear motor feed drive system is set as zero. And ambient temperature is changed from 19.1°C to 23.8°C by adjusting the temperature of the air conditioner in the lab.
Testing results of linear motor drive system with linear scale
Under working condition (a), temperatures and positions of the table are measured at 0, 0.25, 0.5, 1, 2, …, 8 h. Testing results when table is moving at 30 m/min are shown in Figure 8. It can be known that when the table is moving, heat is generated due to electromagnetic loss in linear motor and the temperatures is slightly increased. The thermally induced positioning error is supposed as the positional deviations before and after the temperature rises. Its value could be calculated by subtracting the original position of the table measured at 0 h from the testing results at 0.25, 0.5, 1, 2, …, 8 h. And the original pitch errors are overlooked by subtractions. Therefore, it is assumed that when the table is at 0 mm, the thermally induced positional deviation is 0 μm. After 8 h of operation, the maximum positional deviation reaches to about 28 μm. Different with the ball screw system, the inner heat sources (electromagnetic loss in linear motor) may also lead to the positioning error.
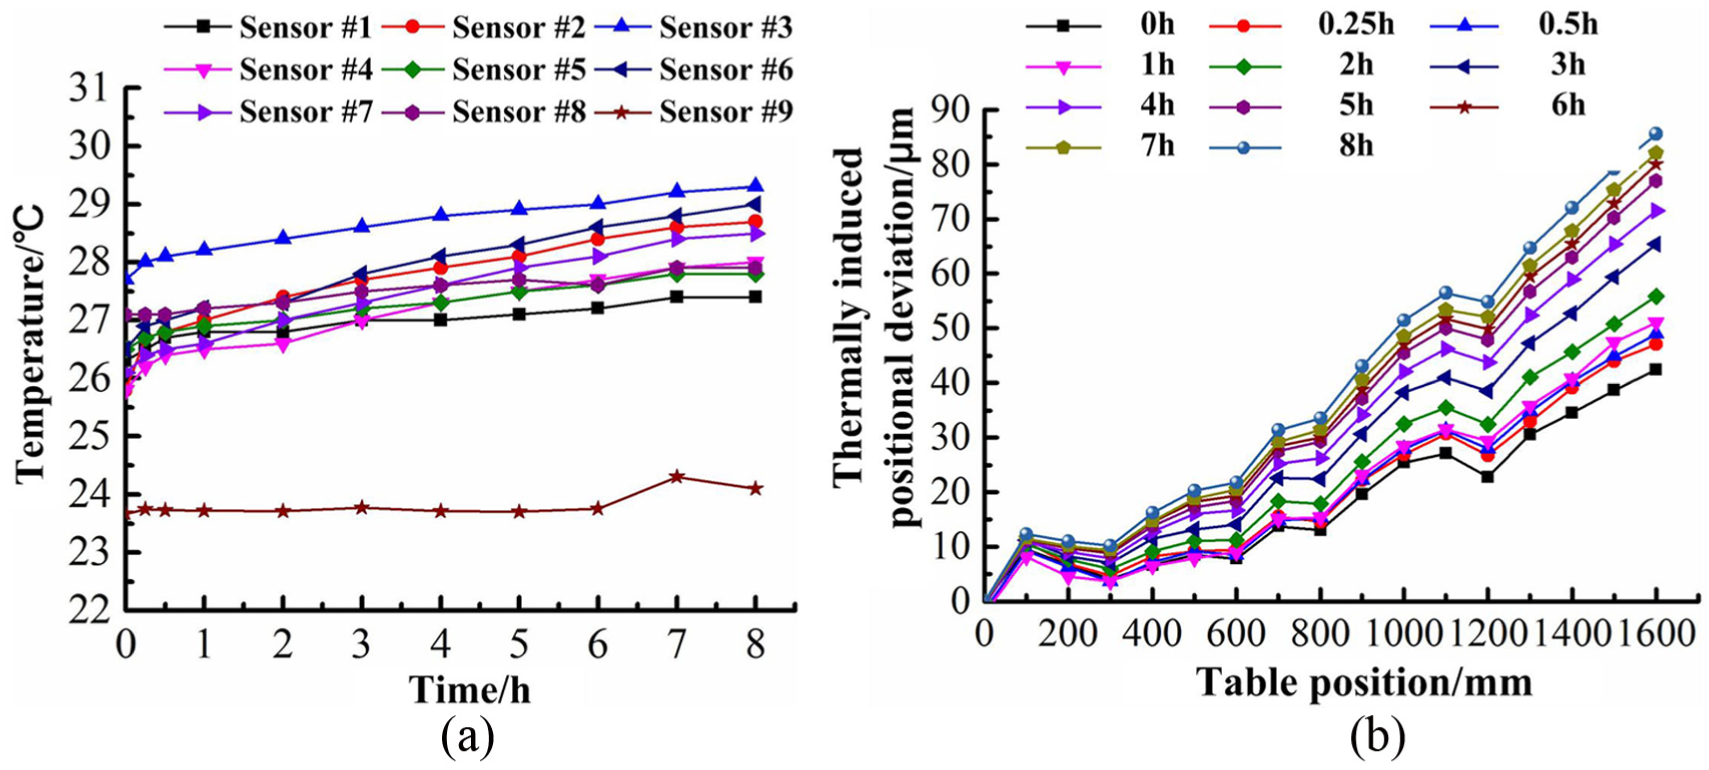
Testing results of a linear motor feed drive system at 30 m/min: (a) temperatures and (b) positional deviations at different points.
Testing results of a linear motor feed drive system at different ambient temperatures (working condition (b)) are shown in Figure 9. According to the figure, it can be seen that temperatures of the linear scale is changing with the ambient temperature linearly. And as the environmental temperature increases, the positional deviations become greater. When the variation of the ambient temperature is 4.7°C, the maximum thermally induced positional deviation of the linear motor feed drive system is about 30 μm. It means that besides the heat generated due to the electromagnetic loss, change of environmental temperature could lead to the thermal deformation of the linear scale in a linear motor feed drive system.

Testing results of a linear motor feed drive system at different ambient temperatures: (a) temperatures and (b) positional deviations at different points.
Thermal error modeling
Thermal error modeling of ball screw feed drive system with linear scale
According to Figure 4, it can be concluded that the positional deviations of Y-axis ball screw system is linearly dependent on the table’s position at different ambient temperatures. By curve fitting, the linear models of positional deviations as shown in equation (1) are established

where d is the positional deviations per, μm; y is the position of the table, mm; and k and b are the coefficients of the model. The values of these coefficients at different environmental temperatures are obtained by adopting curve fitting and shown in Table 1, in which RMSE stands for the root mean squared error. When RSME is small enough, it means that the accuracy of fitting is good.
Coefficients of linear positioning error model.

RMSE: root mean squared error.
Then, the linear relationships (shown in Figure 5) between the ambient temperature T and coefficients k and b are mapped and shown as follows


Taking equations (2) and (3) into equation (1), the thermally induced positional deviations at different points along Y-axis of the ball screw feed drive system equipped with linear scale can be computed

For example, when the ambient temperature is 25°C, the thermally induced positional deviations of Y-axis at y = 1000 mm is about 84 μm.
In order to verify the correctness of modeling, the positional deviations when the environmental temperature remains at 22.6°C are predicted according to equation (4) and compared with the measured position reached by the moving part of Y-axis. The comparison result is shown in Figure 10.

Comparison result of predicted positional deviations and measured data (ambient temperature: 22.6°C).
According to Figure 10, the errors between the predicted result obtained from the model and the measured data lie in the range of −2.7 to 5.4 μm, which means that the accuracy of the model showed in equation (4) is good.
Thermal error modeling of linear motor drive system with linear scale
For the full closed-loop linear motor system, the thermal error is influenced by both inner and outer heat sources. According to the testing results in “Temperature and thermal error testing of linear motor drive system with linear scale” section, temperature data collected from nine sensors should be used as the inputs for thermal error modeling. However, so many sensors would increase the cost of labor and other expense when testing temperatures, processing data, and building the thermal error models. So first, by using correlation analysis, we select the thermal key points whose temperatures are closely related to the thermal error. Second, based on the temperatures of these thermal key points, the thermal error model of linear motor drive system is established. Then, thermally induced positional deviations can be predicted and used for further compensation.
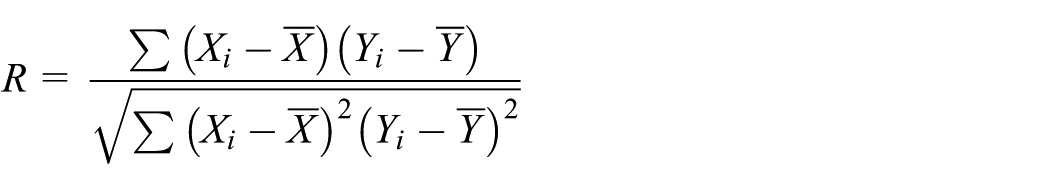
According to the equation shown below, the correlation coefficients R between temperatures and the maximum positional deviations of the full closed-loop linear motor feed drive system are calculated and listed in Tables 2 and 3
Correlation coefficients under working condition (a).

Correlation coefficients under working condition (b).

Taking the computed correlation coefficients under all working conditions into consideration, Sensors 2 and 4 are selected as the thermal key points. Based on equation (1), the model of thermally induced positional deviation for the linear motor feed drive system equipped with linear scale is developed as follows

where x is the position of the table, mm; d is the positional deviation of the linear motor system at different positions, μm; and T2 and T4 are the temperature rise of Sensor 2 and Sensor 4, °C.
Figure 11 shows the errors between the predicted positional deviation and measured data. We can see that the absolute values of residual errors are less than 10 μm, which indicates that the modeling accuracy is good.

Thermal error modeling results of the linear motor equipped with linear scale.
Thermal error compensation
Thermal error compensation of ball screw feed drive system with linear scale
According to equation (4), the positional deviation of ball screw system when the ambient temperature remains at 22.6°C is predicted. By changing the G-code in PA NC system of DK-1200, the coordinate values at different positions in Y-axis are adjusted. And the positional deviations caused by the ambient temperature variations are compensated. The interface of error compensation in PA NC system is shown in Figure 12. For example, in order to reduce the thermally induced positional deviation of Y-axis at 100 and 200 mm, the position coordinates are changed to 100.005 and 200.01 mm, respectively. The compensation result is shown in Figure 13.

Interface of positioning error compensation in PA NC system: (a) before compensation and (b) after compensation.

Compensation result of positional deviation in ball screw feed drive system.
Without implementing compensation, the maximum positional deviation reaches to about 92 μm. By contrast, the deviation at position y = 1400 mm drops to 17.4 μm after compensation. Namely, up to 81% positional deviation has been reduced. It means that thermally induced positioning error of the ball screw feed drive system equipped with linear scales could be greatly reduced and the manufacturing accuracy could be guaranteed by adopting the thermal error compensation.
Thermal error compensation of linear motor drive system with linear scale
In order to verify the effectiveness of compensation for the linear motor drive system, temperatures of the system when the table is moving at 25 m/min (ambient temperature is 21.36) are measured. The temperature testing results are shown in Table 4.
Temperature testing results at 25 m/min.

The tested temperatures are used to compute the compensation values based on equation (5). By changing the G-code in Siemens system of the linear motor feed drive system equipped with linear scale, the coordinate values at different positions are adjusted and the thermally induced positional deviation is compensated. The compensation result is shown in Figure 14.
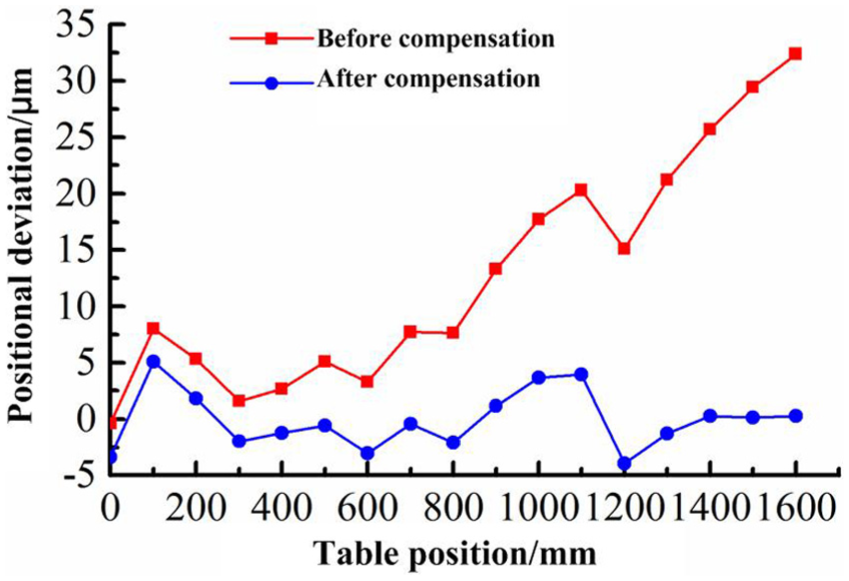
Compensation result of positional deviation in linear motor feed drive system.
From Figure 14, we know that after compensation, the deviations at different positions of the linear motor feed drive system lie in the range of −5 to +6 μm. The maximum thermally induced positional deviation is reduced from 32.4 to 5.1 μm. It means that after compensation, the position of moving component and manufacturing accuracy could be guaranteed.
Conclusion
In this article, thermal characteristics of feed drive systems equipped with linear scales were tested and investigated. According to the experimental results, it found out that ambient temperatures has great impact on the positional deviation of the full closed-loop ball screw systems. By contrast, both the heat generated in the motor and the variations of environment temperatures could bring in the deviation of position for the closed-loop linear motor feed drive system. In order to reduce the thermally induced positional deviation and guarantee the machining accuracy, the positional deviation models of the feed drive systems equipped with linear scales were established first. Then based on the model, the positional deviation at different positions were predicted and then used to implement compensation by adjusting coordinate values. According to the testing results, more than 80% thermally induced positional deviation can be reduced.
Footnotes
Handling Editor: Jining Sun
Declaration of conflicting interests
The author(s) declared no potential conflicts of interest with respect to the research, authorship, and/or publication of this article.
Funding
The author(s) disclosed receipt of the following financial support for the research, authorship, and/or publication of this article: This work was supported by the State Key Laboratory for Manufacturing System Engineering (China) and National Natural Science Foundation of China (51705402).