
Abstract
For a great influence on the fuel economy and exhaust, driving cycle recognition is becoming more and more widely used in hybrid electric vehicles. The purpose of this study is to develop a method to identify the type of driving cycle in real time with better accuracy and apply the driving cycle recognition to minimize the fuel consumption with dynamic equivalent fuel consumption minimization strategy. The support vector machine optimized by the particle swarm algorithm is created for building driving cycle recognition model. Furthermore,the influence of the two parameters of window width and window moving velocity on the accuracy is also analyzed in online application. A case study of driving cycle in a medium-sized city is introduced based on collecting four typical driving cycle data in real vehicle test. A series of characteristic parameters are defined and principal component analysis is used for data processing. Finally, the driving cycle recognition model is used for equivalent fuel consumption minimization strategy with a parallel hybrid electric vehicle. Simulation results show that the fuel economy can improve by 9.914% based on optimized support vector machine, and the fluctuations of battery state of charge are more stable so that system efficiency and batter life are substantially improved.
Keywords
Introduction
Hybrid electric vehicles (HEVs) are considered very effective vehicles in terms of fuel economy and exhaust emission. Many previous studies have been conducted on logic threshold control, fuzzy control, dynamic programming, and model predictive control, which have been developed and used in HEVs.1–5 These methods have higher control precision and make a positive contribution to fuel economy.
Driving cycles, also known as driving conditions, refers to a velocity sequence on the course of time of a certain type of vehicles (such as passenger cars, buses, commercial vehicles) in the specific conditions which are representative 6 (such as urban roads, suburban roads, freeways). Driving cycles in typical cities is the velocity and time curves reflecting the running state of vehicles, which are based on the investigation of the actual traffic flow and the data processing of a real car experimental test. It is well known that the effectiveness of energy management strategy (EMS) for HEVs is greatly influenced by the driving cycles. 7 So in the process of research and development of electric vehicles, driving cycle recognition (DCR) is becoming more and more widely used. For HEVs, the EMS should keep accordance with the features of current driving cycle and adjust control parameter values in real time. So different power sources can achieve optimal power distribution and further improve the vehicle fuel economy.8–16
DCR mainly collects and analyzes driving cycles information the by global positioning system(GPS) or the on-board sensors in predicting future driving cycles. However, no matter which method, a high-precision recognition algorithm is the key. The current recognition methods of driving cycle can be roughly divided into three categories: first, using DCR based on the neural network algorithms: J Wang et al. 17 applied a mathematical statistic’s method to select recognition parameters and proposed learning vector quantization (LVQ) neural network for DCR; SI Jeon et al. 18 described driving cycle by defining a series of characteristic parameters and adopted DCR with Hamming neural network; Y Ren et al. 19 applied extreme learning machine (ELM) to train and recognize driving cycles and extract control parameters from a database to distribute the torque engine and motor sensible; Q Zhu et al. 20 used artificial neural network (ANN) in the driving cycle model predictive control. The prediction accuracy is better than using the previous active set directly; second, adopting fuzzy controller as a DCR tool: S Zhang and R Xiong developed a driving pattern recognition method with the fuzzy logic controller and proposed an adaptive energy management method for a plug-in HEV. Simulation results indicate that DCR with fuzzy logic controller can make better fuel efficiency than the original and conventional dynamic programming–based control strategies 21 ; L Niu et al. presented an adaptive power matching controlling strategy of driving cycle fuzzy recognition. The simulation based on ADVISOR software shows that the newly designed controlling strategy with DCR could adapt driving cycles and enhance intellectualization of full vehicle 22 ; Y Tian et al. 23 recognize the arterial road and secondary main road of Guangzhou and Shanghai in China by optimized fuzzy controller; third, applying clustering theory in DCR: Z Lei et al. confirmed current driving cycle type by computing the Euclid distance of the characteristic parameters between standard driving cycle and current driving cycle. The simulation results show that compared with the original rule-based EMS, DCR can reduce the fuel consumption by 11.68% 24 ; J Wang et al. 25 also adopted DCR by computing the Euclid distance and used in equivalent consumption minimization strategy (ECMS) so as to realize an optimization of fuel economy; S Zhan et al. 10 applied K-means clustering method, which is optimized by genetic algorithm to conduct DCR in order to adjust the equivalent fuel consumption factor in real-time control.
These studies provide an important basis for the study of DCR. However, there is still room for further improvement in recognition accuracy. Uncertainty of the neuron number exists in hidden layer while applying a neural network algorithm, so it is difficult to obtain an optimal DCR model; for fuzzy recognition controller, membership functions are usually chosen according to experience, so the recognition accuracy can be improved only after many times debugging, which adds the developing workload and extends the period of vehicle development; for various clustering theories, the initial value of the clustering center has great effect on recognition results, which may lead to fall into local optimum, such as Euclid’s algorithm. Furthermore, clustering algorithms also are very sensitive to the number of input parameters.
Support vector machine (SVM) is a kind of machine learning theory aiming at limited samples, which is put forward based on Vapnik–Chervonenkis (VC) dimension theory and structural risk minimization principle from statistics learning theory. The algorithm does not involve probability measure and law of large numbers and avoids the traditional process from induction to deduction, so it effectively implements the transductive reasoning from training samples to texting samples and greatly simplifies the classification and regression problems. As a supervised learning theory, there is no problem of setting the initial clustering center of the clustering theory. Meanwhile, it avoids the problems of network structure selection, over learning and insufficient learning of ANN. However, SVM has not been applied to the study of DCR. The current paper presents a DCR method with SVM algorithm using the time window. In order to further improve the recognition accuracy, particle swarm optimization (PSO) algorithm and SVM algorithm are combined for building optimal off-line DCR model. Furthermore, the influence on the online recognition accuracy of window width and window moving velocity is also analyzed. Finally, the DCR model is applied in ECMS for a parallel HEV with P2 configuration. Simulation is carried on MATLAB/Simulink platform, and the results show that the fuel economy can improve by 9.914% with DCR based on optimized SVM algorithm and improve by 5.231% with DCR based on SVM without optimization, and the fluctuations of battery state of charge (SOC) are more stable in two cases so that system efficiency and batter life are substantially improved.
Control flow of dynamic ECMS based on the DCR
The driving cycle has a great influence on the fuel economy of HEVs. 6 Therefore, in order to further improve the fuel economy, the EMS should adjust the value of the control parameters in real time according to the characteristics of the current driving cycle, so as to realize the optimal power distribution to different power sources. ECMS has the advantages of simple structure, the small amount of calculation, and no need of prior knowledge. By introducing a penalty function, the strategy makes a good charging sustaining characteristic and is better suitable for charging sustaining period of the plug-in HEV, so it is widely studied.26–28
As shown in figure 1, the values of charging and discharging equivalent factor must be set well before calculating ECMS. At the same time, the values are related to the driving cycle type. That is, there is a couple of optimal charging and discharging equivalent factors under different driving cycles. Therefore, the control parameters whose values are adjusted according to driving cycle type are

where


where
Since the original ECMS could not maintain the SOC balance of the battery well, the penalty function is introduced to modify the equivalent fuel consumption to keep it near the target SOC. The penalty principle is that when the SOC of the battery is higher than the target SOC, the penalty coefficient is less than 1, so the equivalent fuel consumption of the motor is reduced by the penalty coefficient, which makes the control strategy more inclined to use electricity. The SOC of the battery is less than the target SOC and the penalty coefficient is greater than 1. By increasing the equivalent fuel consumption of the motor, the control strategy is more inclined to use fuel. The penalty function is as follows


where

Replacing the equivalent factors and considering the recovery power of braking, the modified equivalent fuel consumption equation of the motor is as follows

The calculation flow chart of ECMS is shown in Figure 1. As described above, ECMS should be well combined with DCR and dynamically regulates charging and discharging equivalent factors. Figure 2 shows the control block diagram of the dynamic ECMS based on the DCR. A library of optimal charging and discharging equivalent factor was built by the offline global optimization on different standard driving cycles. Once a certain type of driving cycle is identified, a pair of optimized charging and discharging equivalent factor will be selected.

Calculation flow chart of ECMS.

Control block diagram of dynamic ECMS based on the DCR.
The PSO-SVM recognition algorithm
Through the study of given sets of training samples to build the DCR model, SVM algorithm has been widely used in the control field of prediction and identification because of its simplicity and high accuracy. The basic idea of SVM algorithm is to map the input data of low dimensional space to high dimensional feature space through nonlinear mapping, making it linear separable and getting the optimal discrimination function in high dimensional space. Finally, the classification boundary can be gotten. The value of the penalty coefficient C and the width parameter g of the kernel function in the SVM algorithm are the main factors that affect the recognition performance. Therefore, the best C and g should be determined in order to guarantee the recognition accuracy. PSO algorithm is inspired from the behavior characteristics Δt of Δω the biological population and is used to solve the optimization problem. The PSO algorithm has the advantages of simple search mechanism, fast convergence speed, small computation, and so on and can avoid falling into the local optimal solution. Considering recognition accuracy as the fitness function, the parameters C and g as the optimization objects, PSO algorithm is used to optimize the SVM algorithm. The combination algorithm is defined as PSO-SVM and the optimal DCR model is established further. The PSO-SVM algorithm flow is shown in Figure 3.

PSO-SVM algorithm flow.
The steps of the PSO-SVM algorithm are described as follows:
Step 1: Set the particle number of swarm to be m, the maximum number of iteration to be M; set the range of particle position and particle velocity;
Step 2: The tth particle position is
Step 3: i is initialized to 1;
Step 4: Particle position
Step 5: Obtain the driving cycle type for each test sample using the trained model, the results stored in
Step 6: Calculation the result of the fitness function. The fitness function of PSO algorithm is defined as follows
where
Step 7: Update the individual optimal position
Step 8: If
Step 9: Update the global optimal position
Step 10: If
Step 11: Update the velocity and position of the each particle as follows


where

Step 12:
Step 13: Output individual optimal position
Step 14: Output best C and g corresponding to the
A case study for building and application DCR model
Database and processing for DCR
Data acquisition in real vehicle experiment
The first thing is to define the typical driving cycle and collect enough data for driving cycle database. Three typical driving cycles are classified in the previous studies on DCR, namely urban driving cycle, suburban driving cycle, and freeway driving cycle. 29 However, as the gradual formation of urban three-dimensional transportation network, the number of viaducts has gradually increased and the driving cycles of the viaduct road are different from the above three types of driving cycles. Therefore, four types of driving cycles are defined in this article and the characteristics of each driving cycle are shown in Table 1.
Typical driving cycle.

Taking the typical medium-sized city of Hefei as an example, representative urban roads, suburban roads, viaduct and freeway were selected to carry out real vehicle experiment. Part of the experimental route is shown in Figure 4 in red line. The data-acquisition system was developed to store the real-time data of the experimental vehicle. The composition of the data-acquisition system is shown in Figure 5.
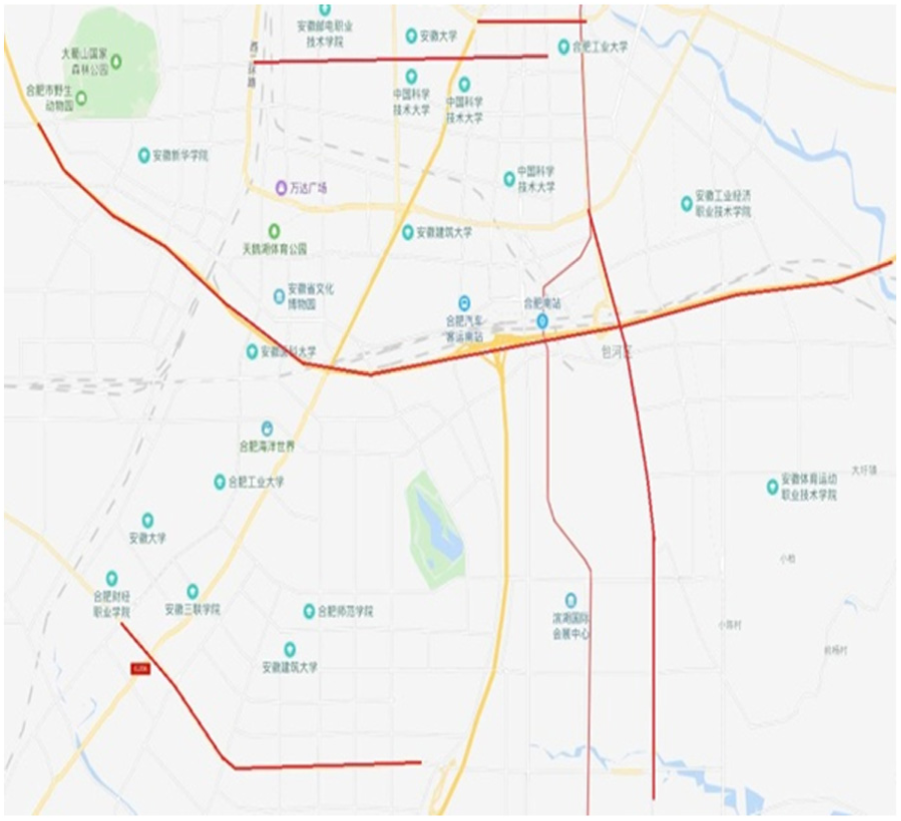
Road route of real vehicle experiment.
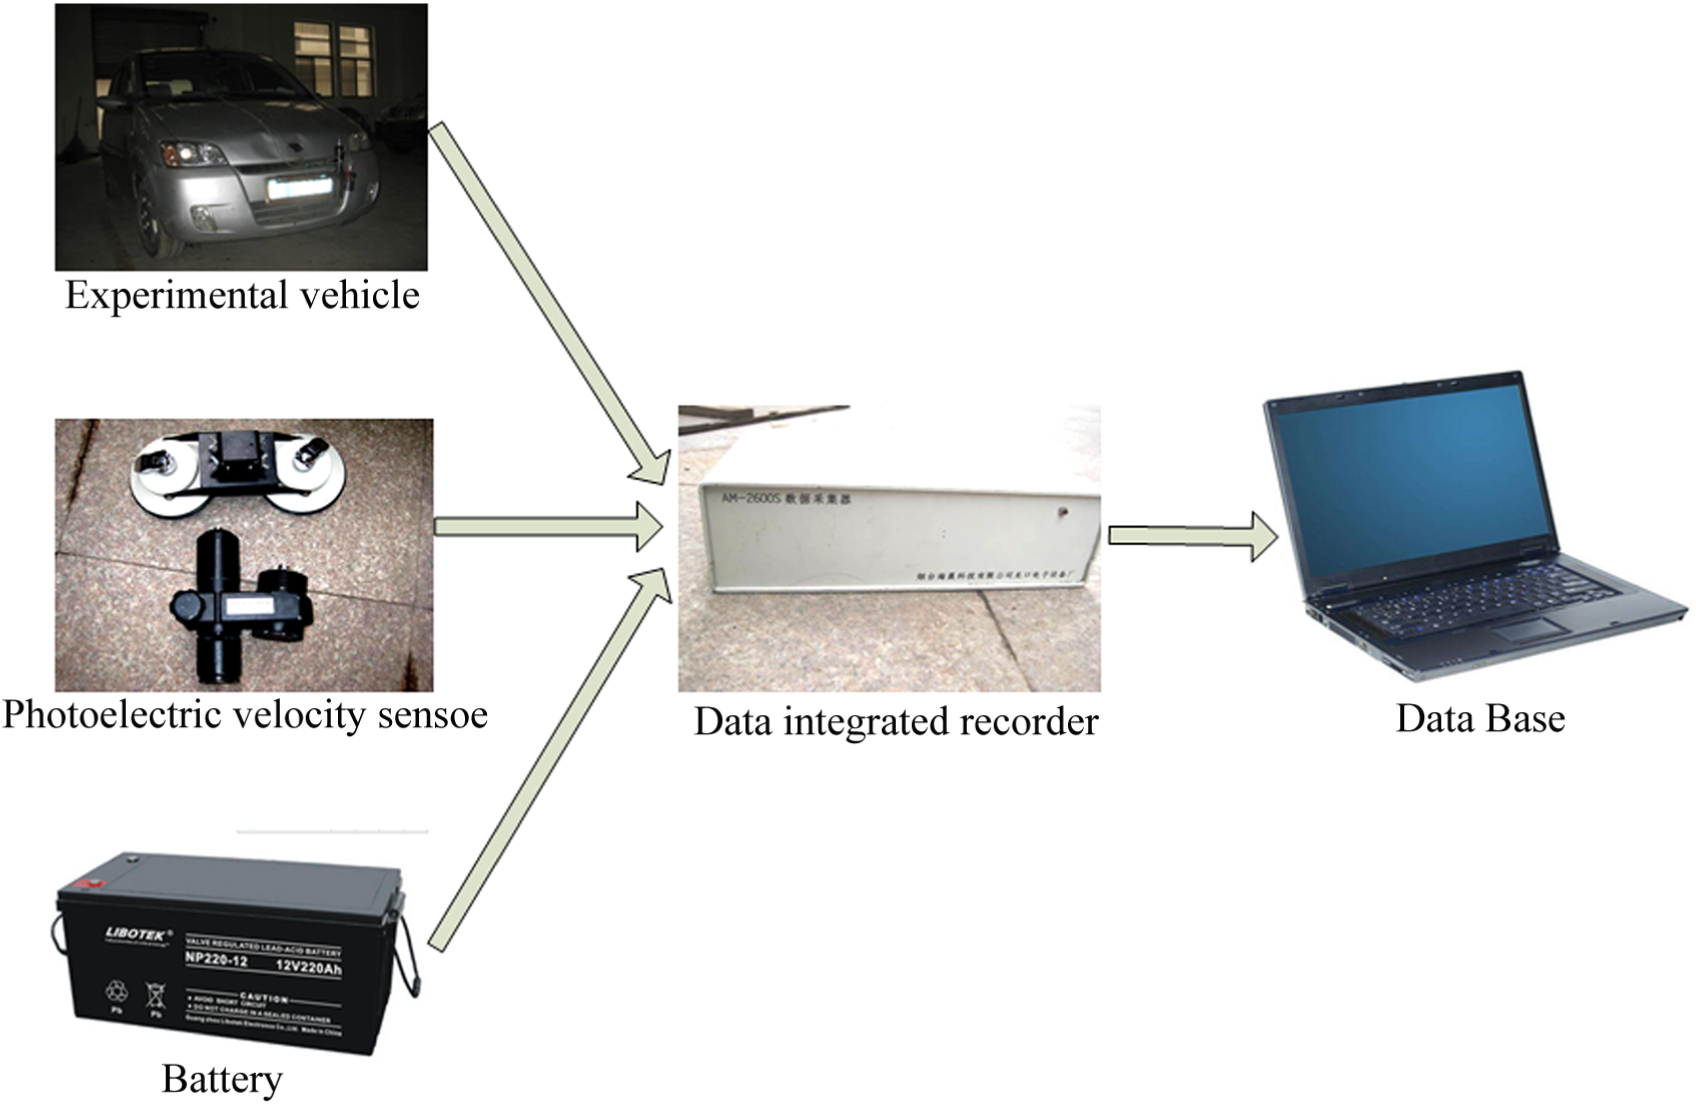
Data acquisition system.
In total, 6000 sets of data were collected for each type of driving cycle and further were preprocessed using the interpolation method to complete individual missing data and removing the singular values generated. The total driving cycle data processed is shown in Figure 6.
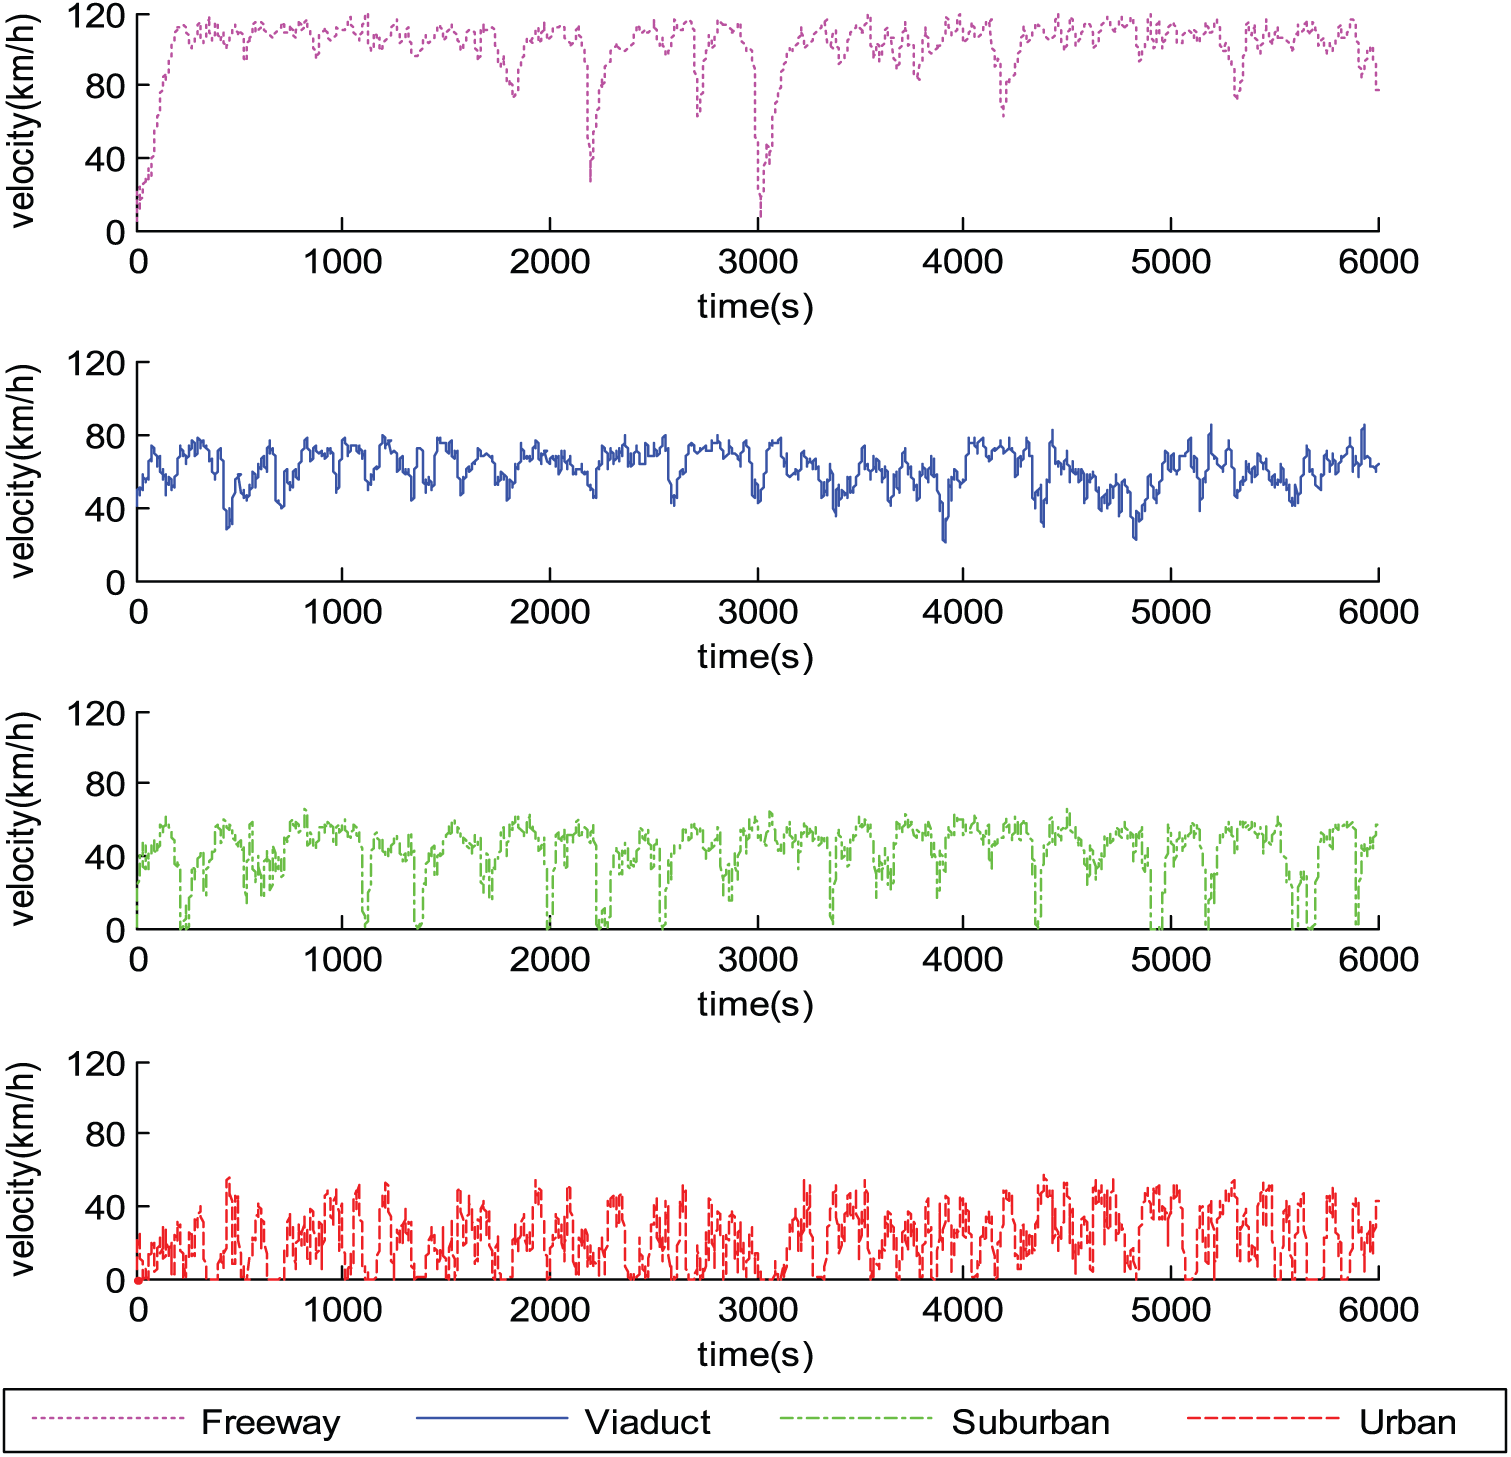
Experimental data of the typical driving cycle.
Extraction of driving cycle samples
For guaranteeing the model recognition accuracy, a randomly generated driving cycle sample method was proposed to obtain enough parameter samples from the four standard driving cycles. Figure 7 shows the randomly generated sample method.

Random samples extraction.
In Figure 7,

The proposed method randomly extracted 400 samples for each type of driving cycle. Window width is set to 80 as an example, that is, the recognition period is 80 s. The best value of the window width will be discussed later.
Processing of driving cycle samples
Sufficient and effective input parameters must be determined to ensure the accuracy of online DCR. Especially in the urban area, the velocity fluctuates greatly, start and stop situation frequently happens. Therefore, the selected characteristic parameters should reflect not only the velocity characteristics, but also the fluctuation characteristics. According to the literature,7,30,31 14 characteristic parameters are defined to describe each DCR sample, such as Table 2.
Characteristic parameters.

The characteristic parameters’ values of each sample are calculated by programming. Furthermore, the matrix with the number of samples (row) and characteristic parameters (column) is obtained based on a normalization process, which is expressed as
where
The correlation between the 14 characteristic parameters will cause negative interference to the recognition model and reduce the recognition accuracy. Principal component analysis (PCA) algorithm can effectively overcome the correlation among parameters and convert a number of indexes into several comprehensive indexes. Based on this, PCA is applied to the characteristic parameters, and 14 principal components are finally obtained, which are expressed as
The contribution rate and cumulative contribution rate.


The scores of the first three principal components.
Build of optimal off-line DCR model
The DCR model based on PSO-SVM algorithm is shown in Figure 9. The extracted velocity sample data are first used to calculate 14 characteristic parameter values. Then, the score values of these 14 characteristic parameters on the first three principal components were calculated. The scores of the above three principal components are used as the input feature parameter vectors of the PSO-SVM recognition model. Furthermore, 80% samples were randomly chosen from the 1600 samples as training samples to train the DCR model. The remaining 20% is used as test samples to verify the accuracy of the DCR model. The population size of PSO is set to 100, and the maximum iteration number is 100.

DCR model.
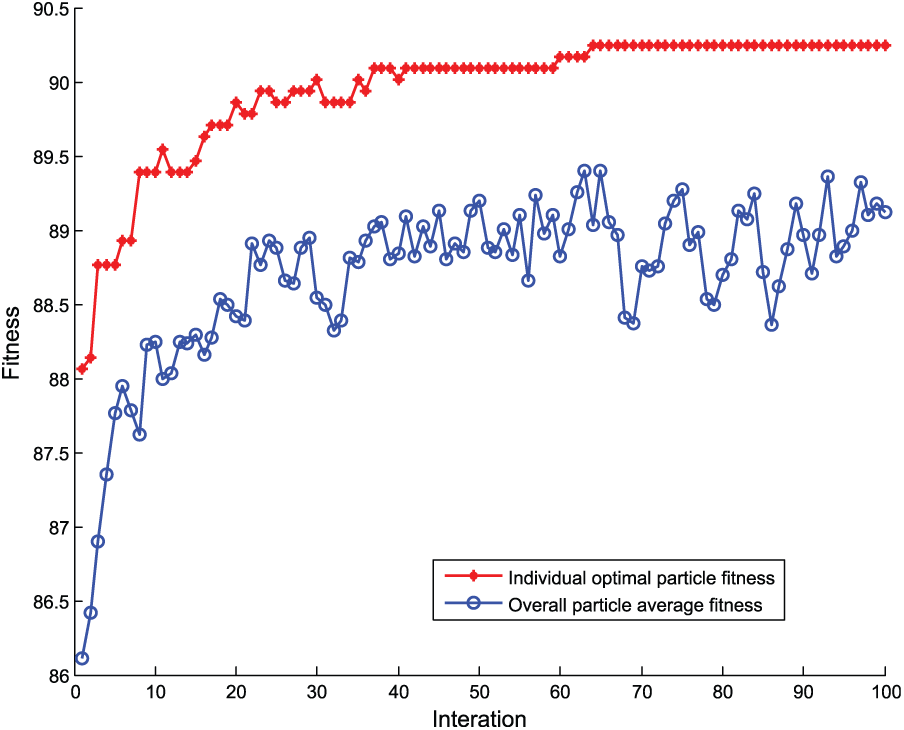
The iteration process of PSO-SVM algorithm.
Figure 10 shows

The mean squared of error of the BP neural network training process.
Figure 12 shows the recognition results of 320 test samples when selecting the optimal particle. It can be seen that the identification error rate of the freeway driving cycle sample is the lowest, primarily due to the high-velocity level and the better stability. In contrast, the error rate of suburban samples is the highest, mainly because of the wide range of velocity fluctuation. However, the overall recognition precision is high, which meets the demand of online recognition. Figure 13 shows the test samples’ confusion matrix for the recognition results of BP neural network. In the confusion matrix, the diagonal data in the green grid are the correct number and percentage of test samples under four typical driving cycles. Same as PSO-SVM algorithm, the error rates of suburban and viaduct samples are higher. In contrast, the recognition accuracy of BP neural network is 82.5%, which is lower than that of the PSO-SVM algorithm.

Training results of PSO-SVM algorithm.
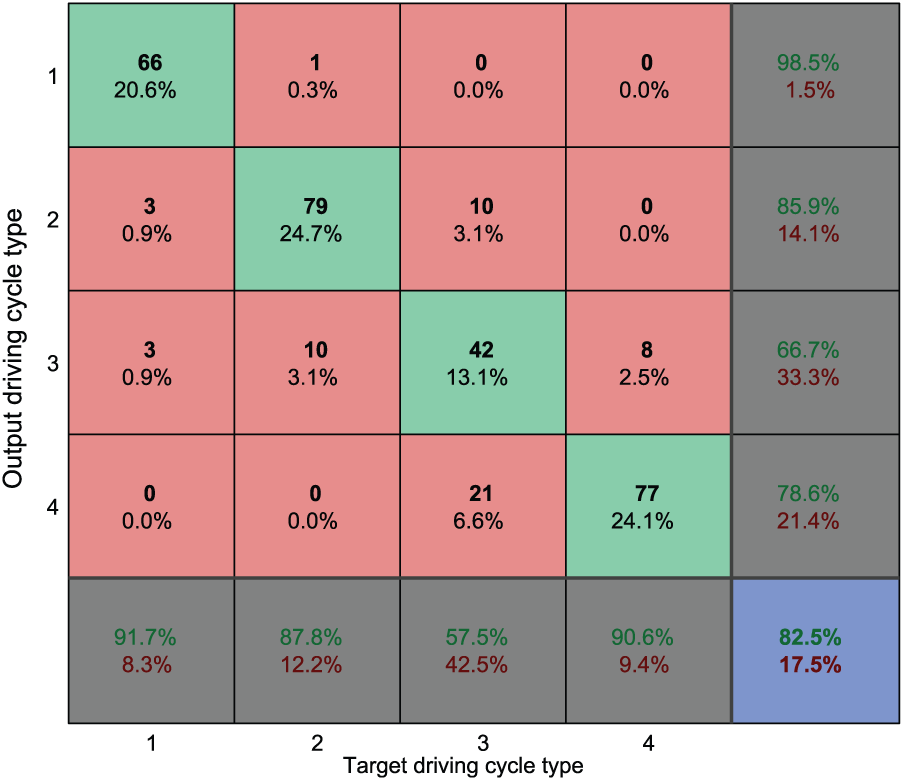
Test samples’ confusion matrix of BP neural network.
Analysis of the influence of
and
on the accuracy of online recognition
In the process of building offline DCR model and online application, there is uncertainty in the value of window width

Random driving cycle.

Online recognition results.
According to equation (9), the results of online recognition are counted. The accuracy of the algorithm at

Cross-validation results.
It can be seen that when
Optimal charging and discharging equivalent factors for dynamic ECMS
In order to find the optimal charging and discharging equivalent factors under different driving cycles, a parallel HEV with P2 configuration is taken as the research object, as shown in Figure 17. The physical models of vehicle and dynamic ECMS based on MATLAB/Simulink platform were built for finding the optimal charging and discharging equivalent factors, which corresponding to the best fuel economy. The main parameters of the vehicle and powertrain parameters are shown in Table 4.

A parallel hybrid electric vehicle with P2 configuration.
Vehicle and powertrain parameters.

By setting
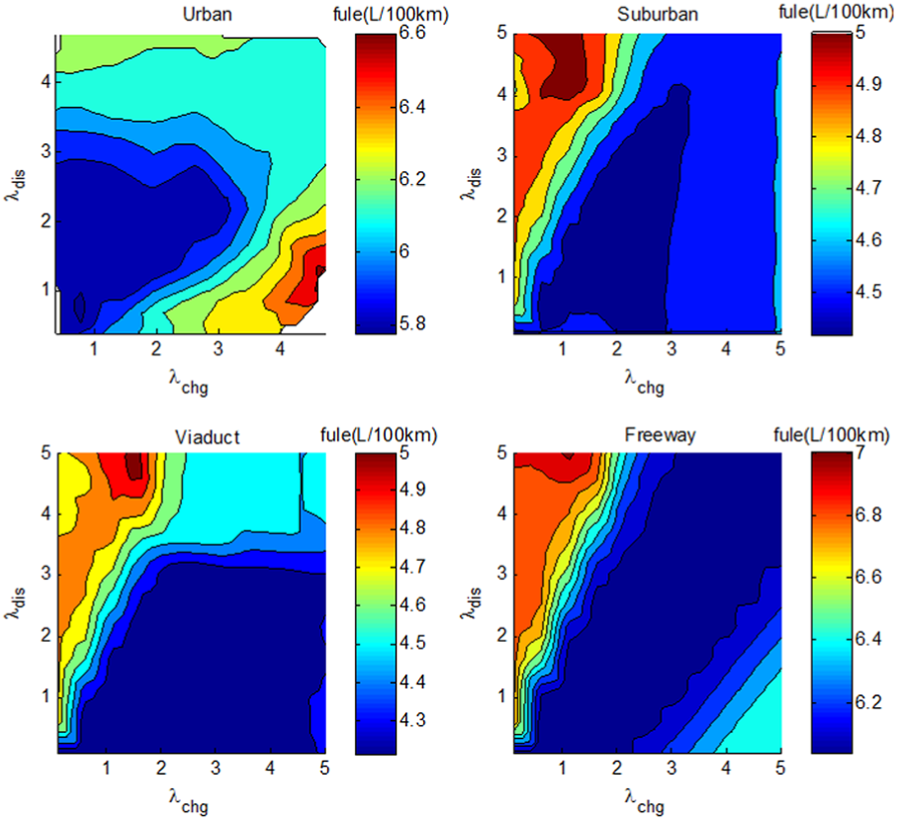
Relation between equivalent factors and fuel consumption.

Relation between equivalent factors and
The optimal equivalent factors under the typical driving cycles.

Simulation and validation
Simulation experiment of ECMS was carried out under three cases for comparison analysis. Three cases are, the ECMS without DCR, the ECMS with DCR based on traditional SVM algorithm and the ECMS with DCR based on PSO-SVM algorithm, which are called mode 1, mode 2, and mode 3, respectively. The initial SOC is set to 0.24, and the upper and lower limits of the battery SOC are 0.3 and 0.2, respectively. In order to get good charge sustaining performance, the value of parameter

Velocity following condition.
Figure 21 shows charging and discharging equivalent factors changing with results of the DCR under mode 2 and mode 3. ECMS algorithm can update equivalent factors in real-time relative to DCR results to achieve better vehicle fuel economy.

Charging and discharging equivalent factors charging curve.
Figures 22 and 23 show the comparison curves of fuel consumption and the battery SOC, respectively. The cumulative fuel consumption of mode 1 is 727.218 g, and the fuel consumption of 100 km is 5.322 L. The corresponding fuel consumption under model 2 is 685.230 g, the fuel consumption of 100 km is 5.015 L, and the fuel economy is increased by 5.774%. The cumulative fuel consumption is 647.772 g and 4.733 L at mode 3, which is raised by 10.925% compared with model 1 and 5.466% compared with model 2.

Cumulative fuel consumption.
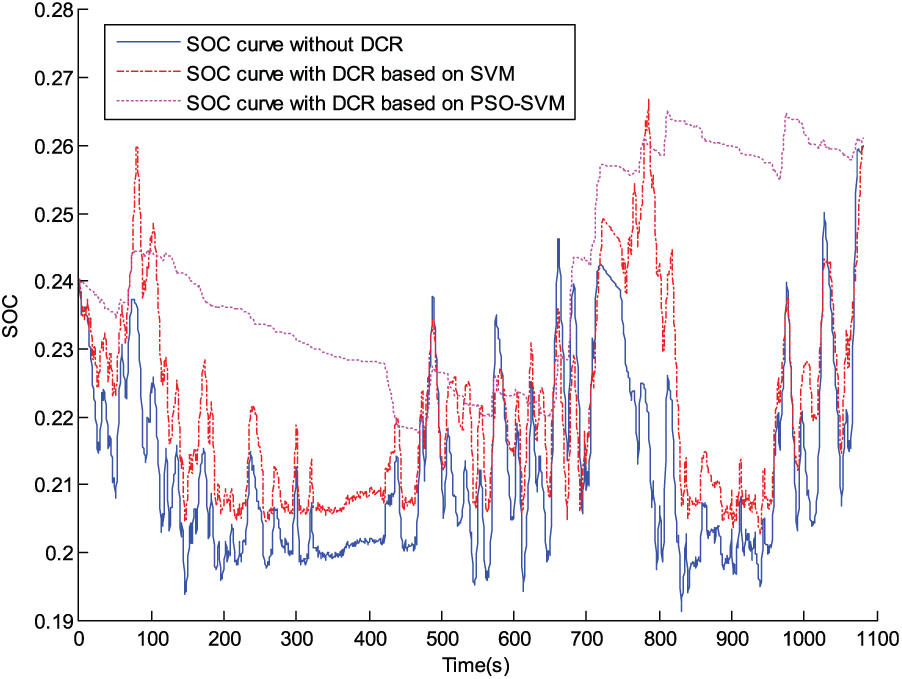
The curves of SOC.
Table 6 shows the target SOC, final value of batter SOC, and the errors under three cases. It can be seen that the errors are all within 5% under three cases. So the strategy has good charge sustaining performance. However, as shown in Figure 23, the SOC of mode 1 has a large fluctuation, and the charging and discharging times are more. The fluctuation of mode 2 decreases, but it is still larger than that of mode 3. The SOC is the most stable under mode 3, and the charging and discharging times further reduced compared with mode 2, which is conducive to improving the system efficiency and battery life.
Final SOC under three conditions.
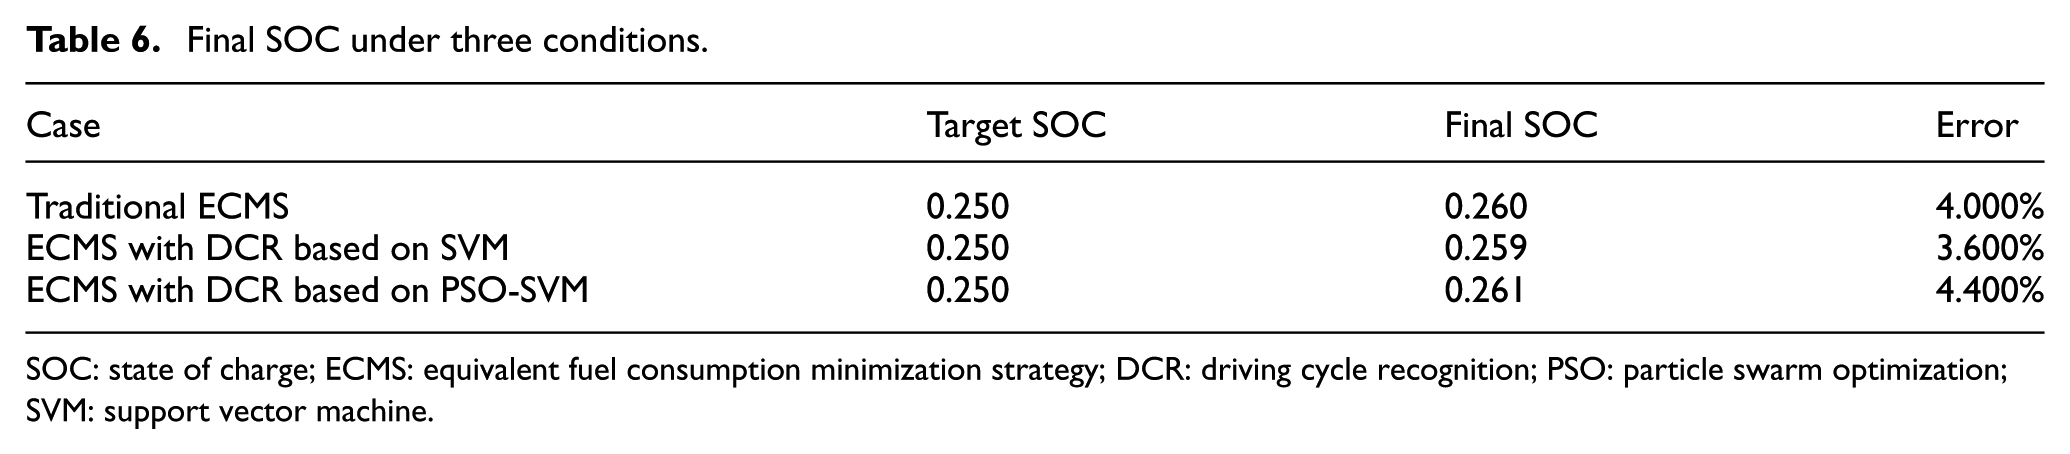
SOC: state of charge; ECMS: equivalent fuel consumption minimization strategy; DCR: driving cycle recognition; PSO: particle swarm optimization; SVM: support vector machine.
Conclusion
In this article, the traffic characteristics of a medium-sized city (Hefei) are analyzed, and the actual vehicle experiments are carried out on typical roads, which representing four standard driving cycles for collecting enough driving cycle data. Fourteen parameters describing the characteristics of driving cycle are defined, and the data are processed by multivariate statistical theory for extracting the final parameters which were used as the input of DCR model.
The proposed PSO-SVM algorithm was used for building DCR model. The calculation results show that the recognition accuracy of PSO-SVM is high enough for online DCR. The effect of window width and window moving velocity on recognition accuracy is further discussed. The results show that when
The DCR technology is applied to the ECMS of a parallel HEV with P2 configuration. The simulation results show that the fuel economy with PSO-SVM algorithm is further improved compared to the strategy without DCR and the strategy with traditional SVM algorithm, and the fluctuations of battery SOC are more stable in two cases so that system efficiency and batter life are substantially improved.
In future research work, real vehicle experiments can be carried out to verify the effect of the DCR method.
Footnotes
Handling Editor: Zhixiong Li
Declaration of conflicting interests
The author(s) declared no potential conflicts of interest with respect to the research, authorship, and/or publication of this article.
Funding
The author(s) disclosed receipt of the following financial support for the research, authorship, and/or publication of this article: The authors would like to thank the School of Automotive and Transportation Engineering, Hefei University of Technology, Hefei, Anhui, P.R. China as well as the National Natural Science Foundation of China (grant no. 71431003) and the Research Project of University Natural Science of Anhui province (grant no. KJ2018A0782).