
Abstract
Parts must be measured to evaluate the manufacturing accuracy in order to check whether their dimension is in expected tolerance. In engineering, parts with free-form surfaces are generally measured by high-precision coordinate-measuring machines. The measurement accuracy is usually improved by increasing the density of measurement points, which is time-consuming and costly. In this article, a novel sampling method of measurement points for free-form surface inspection is proposed. First, surface inspection is simplified into the inspection of a number of section curves of the surface. Second, B-spline curves constructed with an iterative method are employed to approximate these section curves. Subsequently, data points necessary to construct the B-spline curves are taken as the measurement points. Finally, the proposed method is compared with other two sampling methods. The results indicate that the proposed method greatly reduced the number of measurement points without decreasing the precision of surface modeling.
Keywords
Introduction
With the rapid development of computer-aided design/computer-aided manufacturing (CAD/CAM) technology, free-form surfaces are widely used in the field of industry, especially in the area of aviation, aerospace, shipbuilding, and automobile. In pursuit of a better performance, such as optical performance and aerodynamic performance, the geometric shape of free-form surface parts is becoming ever more complicated. This is more demanding not only for manufacturing technology but also for inspection technology.
Inspection is the foundation of quality control of free-form surface parts 1 and plays an important role in the process of industrial production. 2 At present, the general inspection device for free-form surfaces includes coordinate-measuring machines (CMM), optical scanner, and computed tomography (CT) scanner.3–5 Optical scanning technique and CT have been developing rapidly in recent years. However, due to the effect of many factors such as surface roughness or light condition, the application of these techniques is relatively limited. 6 In fact, due to its high accuracy and flexibility, CMM is still the most commonly used device in industrial application. 7
Generally, inspecting a free-form surface with a CMM involves comparing a certain amount of measurement points with the nominal CAD model. 8 Since the surfaces are measured point by point, the inspection time and costs are directly proportional to the number of measurement points. However, people always choose increasing the number of measurement points to improve the inspection accuracy, 9 which leads to an increase in inspection time and costs. To solve this problem, scholars have devoted their efforts in this field. According to whether the number of measurement points is determined or not in advance, these researches can be roughly classified into two major categories. In the first category, the number and positions of measurement points are planned in real time during the measurement process. In this aspect, Edgeworth and Wilhelm 10 proposed an adaptive inspection method based on an error surface model which interpolated by the measurement points. Then, measurement points can be estimated by the error surface model. Obeidat and Raman 11 developed three algorithms for the inspection of free-form surfaces at a patch scale. Extreme points of curvature are sampled as most critical points. Then, optimum measurement points can be predicted by comparing the surface reconstructed by measured points with the designed surface. Ascione et al. 12 established a kriging model by measured points to predict the location of the next measurement point. Dumas et al. 13 established another surface inspection method based on kriging model for large aircraft structural parts. Poniatowska 14 superimposed a machining pattern model for inspection of free-form surfaces. Yu et al. 2 developed a form error model for free-form surface inspection. Hsu et al. 15 proposed a two-step measurement method composed with a rough measurement and a fine measurement aiming at improving the blade measurement accuracy.
In the second category of the previous researches, the position and number of measurement points are determined based on the nominal CAD model. In this aspect, ElKott and Veldhuis 16 developed a sampling method aiming to inspection of trimmed sculptured features. Ren et al. 17 presented a bidirectional curve network–based sampling (BCNBS) method in measuring ultra-precision free-form surfaces. Jiang et al. 18 proposed a measurement point sampling method for complex blades. The leading edge curve and trailing edge curve were supposed to represent the twisted and bended information of blades. Thus, the section curves to be measured are determined based on this information. Measurement points of the section curves were sampled with equal chord error. Mansour 19 developed another inspection method for blade. A number of third-degree polynomial curves were utilized to approximate the blade section curves. Then, the points required to determine these polynomial curves were sampled as blade measurement points.
In addition, there are some researches on surface inspection from other aspects. Moroni and Petro 20 proposed an overall inspection cost model based on the uncertainty evaluation. Zhou et al. 21 applied an automatic sweep scan path planning method for free-form surface inspection using a five-axis CMM. Their method has the advantage on the scanning efficiency. Chang and Lin 22 focused on the inspection of turbine disks using a three-axis coordinate measurement machine, together with a dividing head with two rotational axes.
Actually, a free-form surface can be represented as interpolation of a series of section curves with different heights. Thus, measurement points from the surface of the part should be beneficial to the construction of the section curves. In order to improve the measurement efficiency, a sampling method for free-form surface inspection is proposed in this study. The measurement points are distributed on the different sectional curves. Then, by taking full advantage of the design information of the nominal CAD model of the part, the section curves and the parametric surfaces of the part can be easily constructed.
The article is organized as follows. Section “Analysis of free-form surface inspection” discusses the problem of free-form surface inspection. The sampling method and the related algorithms are given in section “Measurement point sampling method.” Case studies are presented in section “Case study.” Finally, conclusions are given in section “Conclusion.”
Analysis of free-form surface inspection
Unlike regular geometric features, free-form surfaces are commonly modeled by composing a set of section curves. The design process of a free-form surface can be divided into three major steps, as shown in Figure 1. First, a series of point sets along different sections need to be given. Then, a series of sectional curves should be generated by utilizing these point sets. Finally, the target surface can be easily constructed by interpolating these sectional curves.
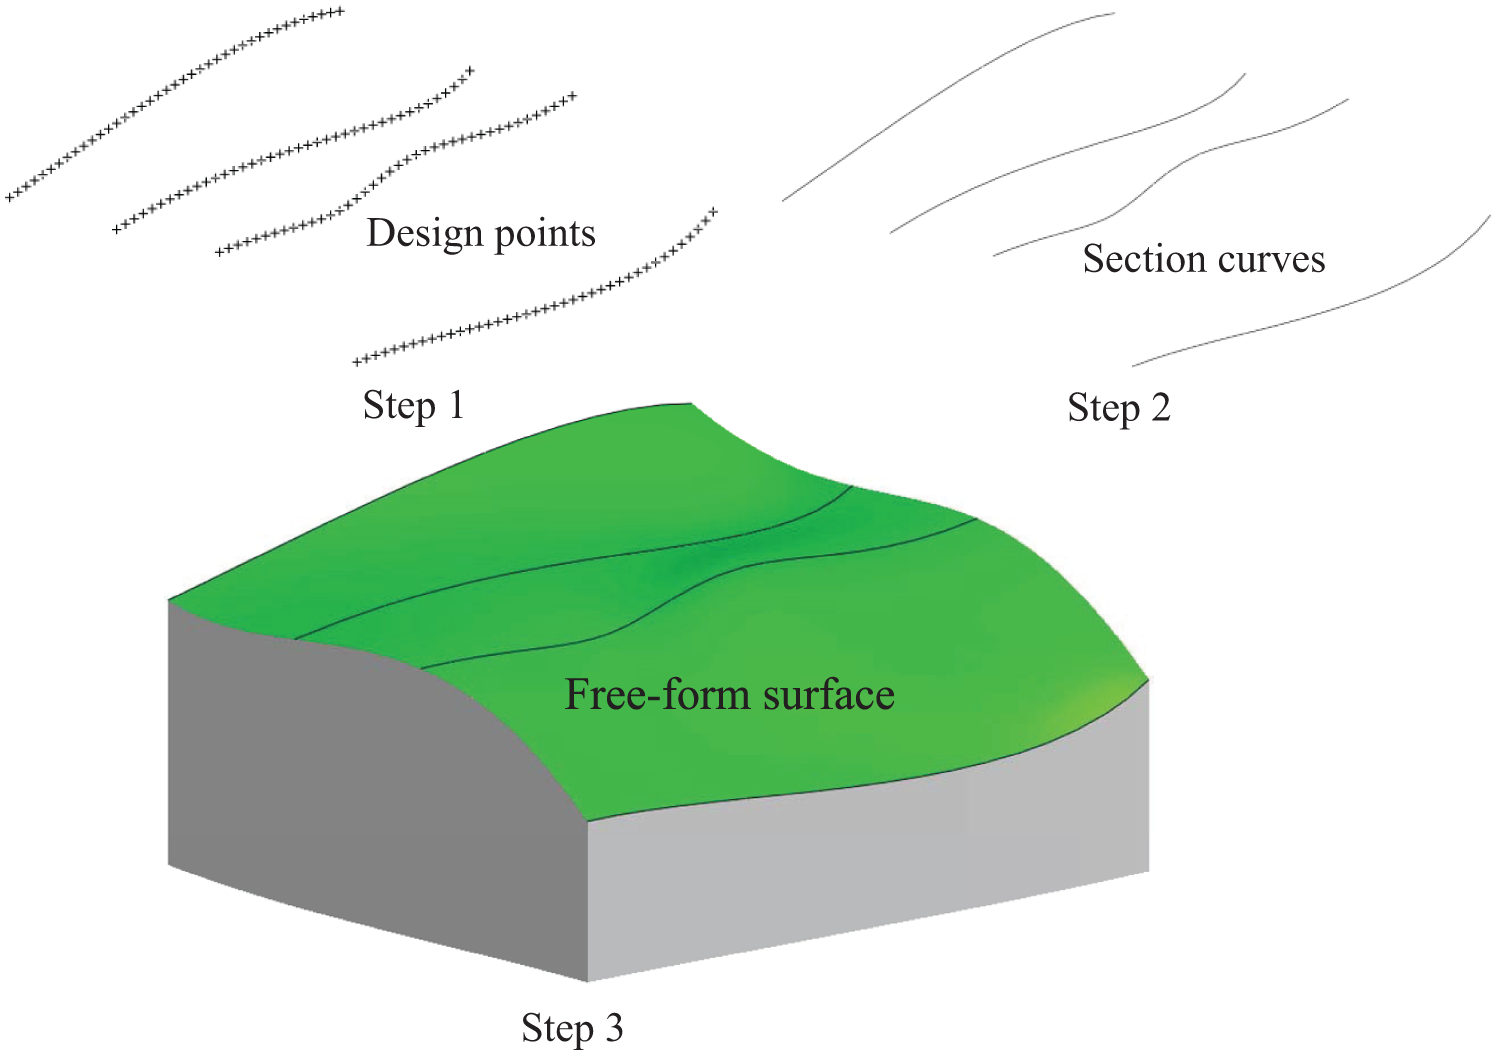
Design steps of free-form surface.
Actually, one of the principal purposes of surface inspection is to reconstruct the three-dimensional surface of the target part. Corresponding to the free-form surface design process, the surface inspection can be simplified as the inspection of the section curves. Commonly, considering the similarity between the actual surface and the design surface, design points of the section curves can be designated as measurement points, as shown in Figure 2. However, the density of design points is commonly very high. It must be very inefficient if the measurement of the section curves is conducted directly by the design points. The best way is to sample a minimum number of points that can reconstruct the section curves within a certain allowable error.

Measurement points of free-form surface part.
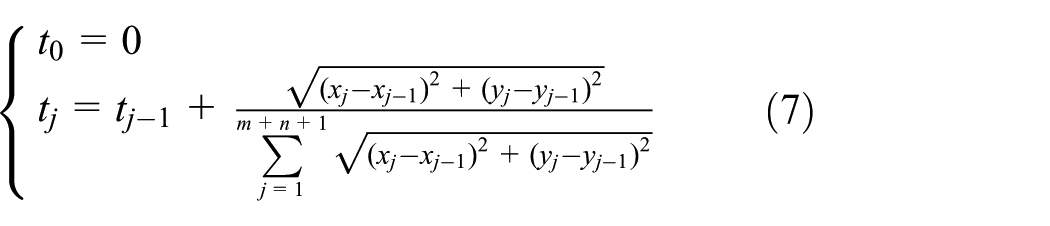
Thus, measurement point sampling for free-form surface inspection can be described as the mathematical model in equation (1)

where
From the above analysis, the key issue of the free-form surface inspection can be considered as how to reconstruct section curves
B-spline curve, which is widely used in CAD system, 23 has the powerful ability on describing free-form curves. It can approach a curve with arbitrary shape. Accordingly, B-spline curves are employed to approximate the section curves of the free-form surface in this study. In addition, data points necessary for construction of the B-spline curve are taken as the measurement points.
Measurement point sampling method
Proposed methodology
As shown in Figure 3, the red solid line is a B-spline curve of order
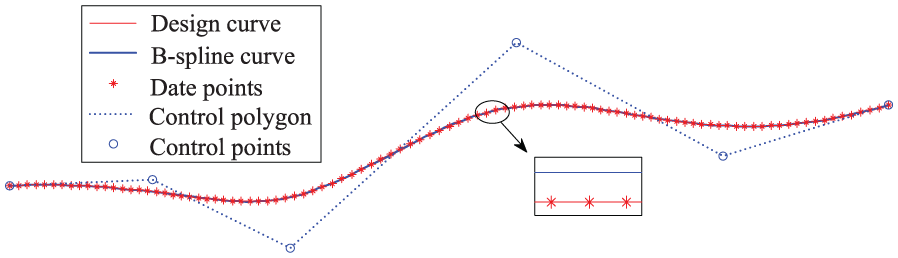
Diagrammatic sketch of B-spline curve approximating free-form curve.
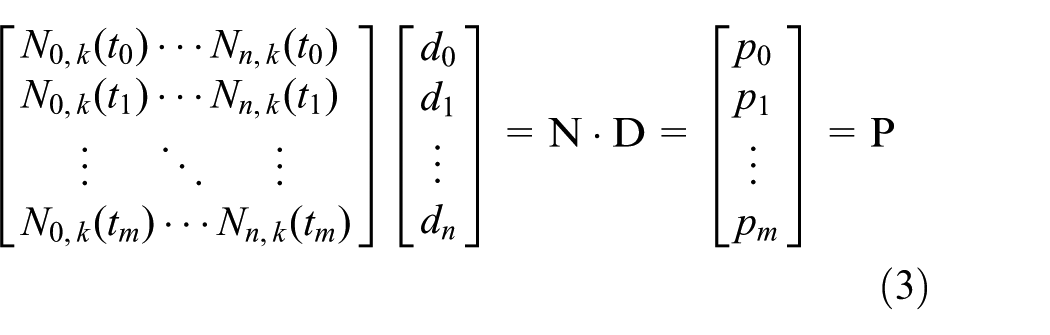
By definition, it has the following representation

where
Apparently, B-spline curves are determined by three factors: control points
Supposing that
If

where
From equation (4), all of the
Important strategies of the proposed methodology
Generally, the construction process of a B-spline curve involves two steps:
Calculate the knot vector and parameters of data points based on their coordinate information. Data points are generally parameterized by the accumulated chord length parameterization method.
Calculate the control points by substituting the knot vector, coordinates, and parameters of the data points into equation (4). And then obtain the parametric function of the B-spline curve.
Different from the method mentioned above, the proposed method gives the knot vector and parameters based on the shape information of the section curves. And two strategies are given as follows to acquire a better approximation of surface section curves with the B-spline curves.
1. Criterion for determining the knot position of a B-spline curve
Essentially, B-spline curve is a piecewise polynomial curve and the end points of the piecewise curves correspond to the knot position. Knot position is a prerequisite for calculating the knot vector in the proposed method. However, knot position is difficult to ascertain. According to its geometric meaning, equal chord error method can be used to determine the knot position. Thus, more pieces of the polynomial curves can be allocated to the part of the section curve with larger curvature to ensure the approximation accuracy.
As shown in Figure 4, there is a chord between two adjacent points on a curve. The chordal error is defined as the largest distance between the chord and the curve.

Chord error of curve.
According to the definition of chord error,
18
the parameter
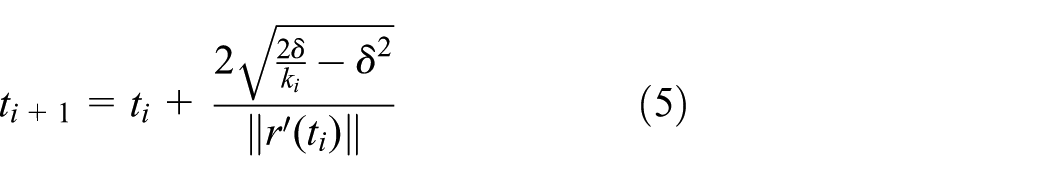
where

2. Calculation method for parameters of a B-spline curve
Parameterization greatly affects the shape of a B-spline curve. 24 The interpolating results of some well-known parameterization methods, such as the uniform, centripetal, chord length, Foley, and universal methods, do not necessarily satisfy all data features. 25 Theoretically, the polynomial curve is not able to take its own arc length as parameter. 26 However, the nearly arc-length parameter is still encouraged for it can reflect the intrinsic nature of the curve. 27
Since the design sectional curves are given, parameters of the B-spline curve can be parameterized with nearly arc-length parameters of the section curves. Thus, the constructed B-spine has better approximation capacity.
The specific steps for calculating the parameters of a B-spline curve are as follows:
Suppose the allowable approximation error is
Suppose
where
Suppose the order of the point set

Determination of measurement points
Definition 1
Points at knot positions are defined as knot points of a B-spline curve. As shown in Figure 5, the black points are the knot points.
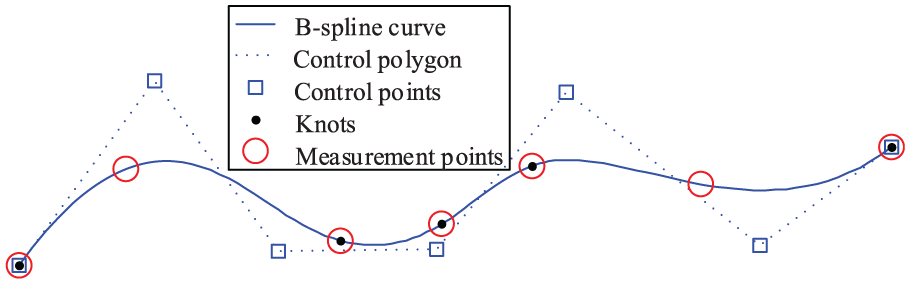
Measurement points for a cubic B-spline curve.
Supposing
The number of control points of
The parameters of the point set

The end points of all of the curve pieces together with the midpoint of the first and last pieces, total of

A cubic B-spline curve consisting of four curve pieces is taken as an example to describe the sampling strategy. As shown in Figure 5, the red points can be sampled as measurement points to recalculate the control points of the B-spline curve.
It should be noted that the optimal value of the chord error
Extract the design section curves from the target free-form surface.
Determine the knot points of the B-spline curve by equal chord error method. The initial value of the chord error
Calculate the knot vector of the B-spline curve by equation (9).
Sample the data points serving for reverse calculation of the control points by equation (10).
Calculate the control points of the B-spline curve by equation (4).
Compare the B-spline curve and the section curve. If the approximation error does not reach the requirement, go to step 2 and adjust the chord error. If the approximation error reaches the requirement, determine the measurement points by calculating the data points according to equation (10).
Repeat the above steps for each section curve. And then, the measurement points for the free-form surface inspection can be obtained.
The flow chart of the proposed method is shown in Figure 6.

Main process of the measurement point sampling method.
It should be noted that
Case study
In this section, two free-form curves and a section curve of a blade are used as examples to perform the comparison test between the proposed method and the other two methods (referred as equal chord error sampling method 21 and polynomial sampling method 22 ). The approximation errors of the curves constructed by these three methods are compared and discussed. In addition, two blades with complex free-form surfaces are used to demonstrate the performance of the proposed method.
Case I
An open free-form curve with no constraint at both ends is shown in Figure 7. Its curvature changes dramatically. The comparison method is as follows. First, construct three curves by these three methods, respectively. Then, divide the three curves into 200 points by equal arc length. Finally, deviations between the 200 points and original curve are regarded as the approximation errors in this study.

Free-form curve.
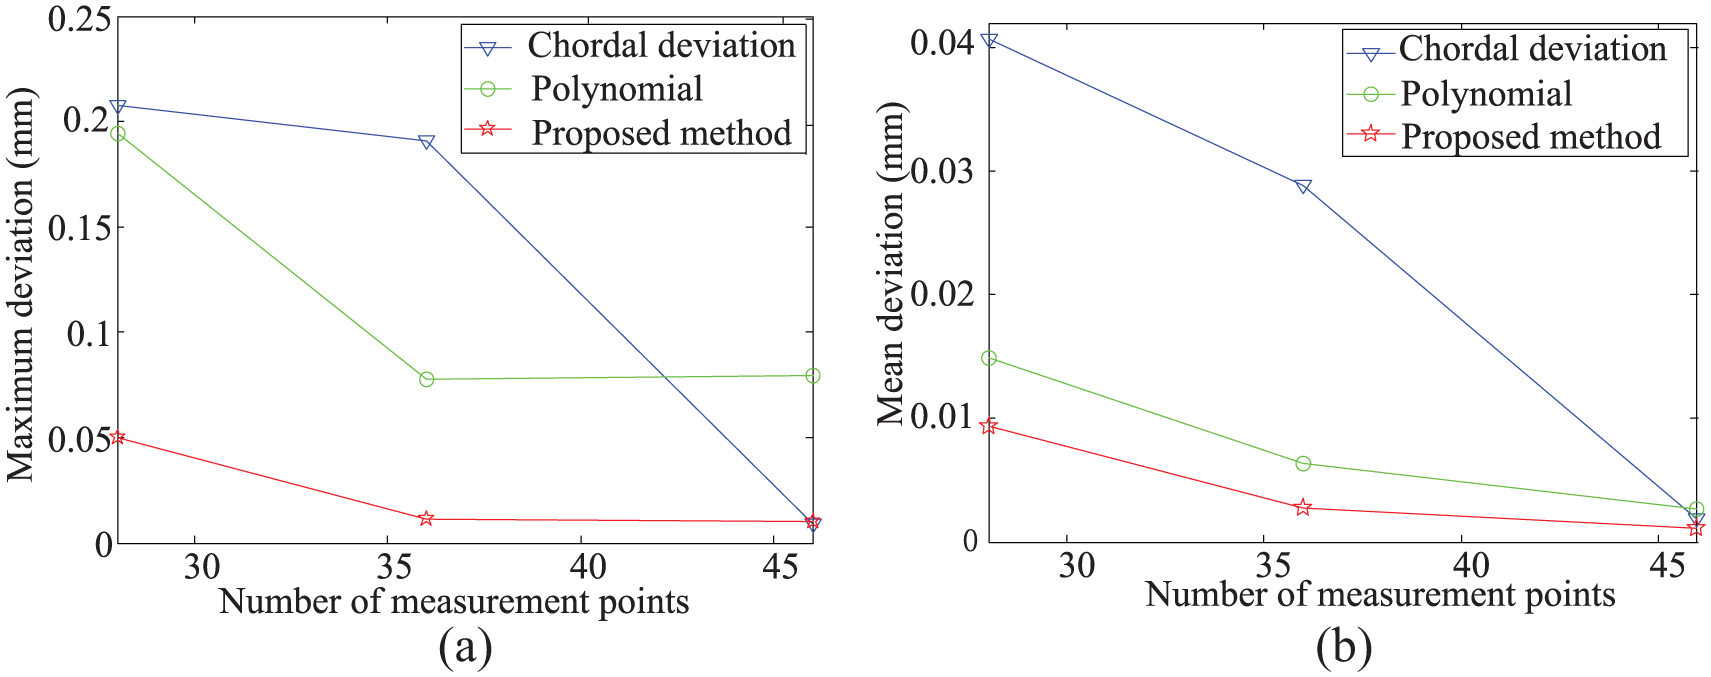
Maximum deviation and mean deviation of the three methods with different number of measurement points are shown in Figure 8, from which we can see that the deviations of the three methods have different degrees of improvement when the number of measurement points keeps increasing. The proposed method has the highest accuracy. Deviation of equal chord error sampling method decreases most rapidly with the increase in the number of the measurement points. Deviation of equal chord error sampling method is bigger than that of polynomial sampling method when the number of measurement points is fewer than about 42. This situation is reversed as the number of measurement points increased. In conclusion, the proposed method can construct a more accurate curve compared with the other two methods. This is especially notable under the condition of fewer measurement points.
Approximation error of sampling methods of the free-form curve: (a) maximum deviation and (b) mean deviation.
Case II
Figure 9 shows a dolphin picture. Its contour curve is a closed free-form curve with only a continuous position at the terminal point. Hence, it can be regarded as an open curve.

Dolphin picture and its contour curve: (a) dolphin picture and (b) contour curve of dolphin.
Based on the above three methods, the same number of measurement points are sampled from the contour curve, and the deviations of the fitted curves are then calculated. The maximum deviation and mean deviation of the three fitted curves are shown in Figure 10.

Approximation error of sampling methods of the dolphin curve: (a) maximum deviation and (b) mean deviation.
It can be clearly seen from Figure 10 that the deviations of the proposed method is still the smallest. Deviations and the tendency of the equal chord error sampling method are very similar to that of the proposed method. Deviations of the three methods improved significantly and get closer with the increase in the number of measurement points.
Case III
A compressor blade with length 72 mm, width 23 mm, and height 89 mm is illustrated in Figure 11. It was generated by sweeping section curves along the staking axis. The section curves consisted of leading edge, trailing edge, suction side, and pressure side, as shown in Figure 12. The curvature change shows a certain regularity, including larger curvature at the leading edge and trailing edge, and smaller curvature at suction side and pressure side.

Compressor blade.

Section curve of compressor blade.
The maximum and mean deviation of the section curves constructed with the above three methods are shown in Figure 13. As shown in Figure 13, the maximum and mean deviation of the equal chord error sampling method is bigger than that of the other two methods on the whole. However, it is an exception for the maximum deviation at 24 measurement points. Deviations of all the three methods reduced significantly by increasing the number of measurement points. The proposed method still has the highest accuracy.

Approximation error of sampling methods for blade section curve: (a) maximum deviation and (b) mean deviation.
Deviation distribution map of the three methods is shown in Figure 14. It can be observed that all the deviations of the three methods decrease gradually as the number of measurement points increases. Deviations of the proposed method are smallest among the three methods.

Approximation error of three methods for blade section curve.
Measurement points sampled with the proposed method are shown in Figure 15. There are only about 45 measurement points on each section curve. By comparison, it needs about 200 measurement points on each section curve for the conventional method. The conventional method selects measurement points depending on the curvature and dimension of the blade.

Measurement points for compressor blade.
The number of measurement points and the deviations of the reconstructed blades are shown in Table 1.
Results of different sampling methods for blade I.

It can be seen from Table 1 that the deviation of the proposed method is slightly larger than that of the conventional method. However, the number of measurement points can be reduced about 75%. This will greatly enhance the efficiency of blade inspection.
Case IV
A more complex compressor blade, with length 72 mm, width 23 mm, and height 89 mm, is shown in Figure 16(a). The measurement points sampled with the proposed method are presented in Figure 16(b).

(a) Compressor blade II and (b) its measurement points.
The inspection process of the blade is shown in Figure 17. The curvature change of its section curves is more severe than that of the first blade. So, more measurement points are needed. Based on the proposed method, 50 points are needed for the middle part of the blade, and 61 points are needed for the tip and root section curves. By comparison, it needs about 230 measurement points on each section curve for the conventional method.

Blade surface inspection.
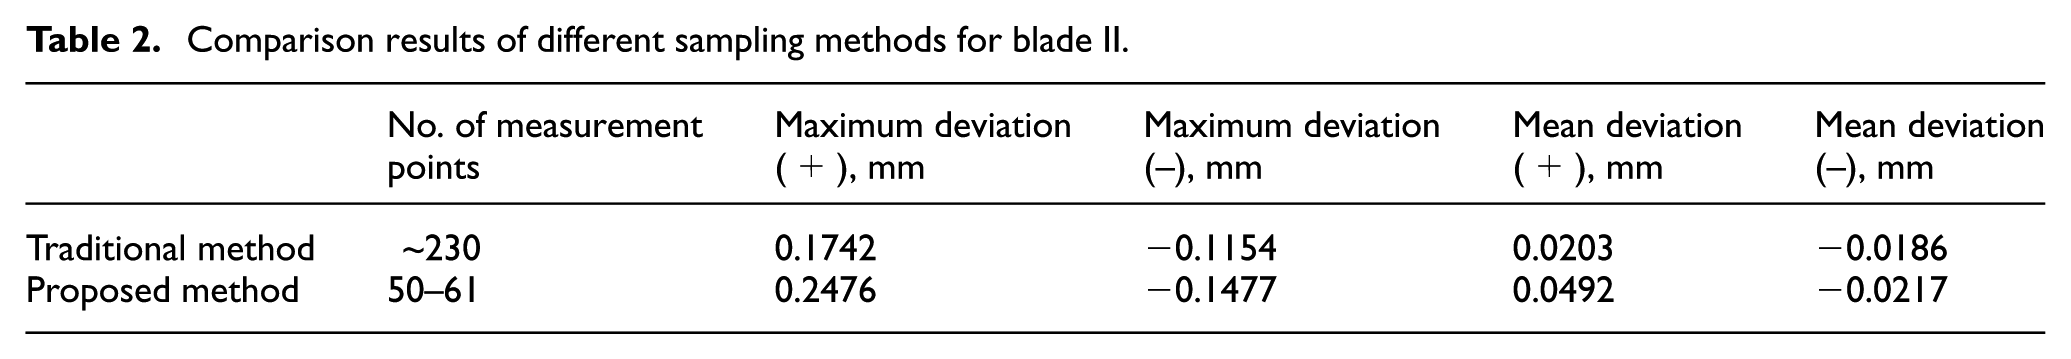
Modeling error of the proposed method and the traditional method and their number of measurement points are shown in Table 2. It can be seen from Table 2 that deviations of the proposed method are slightly larger than that of the traditional method. However, the number of measurement points can be reduced about 75% by the proposed method.
Comparison results of different sampling methods for blade II.
Conclusion
In order to improve the inspection efficiency of the free-form surfaces, a novel measurement point sampling method is proposed in this article. The main conclusions are summarized as follows:
B-spline curves are adopted to approximate the section curves of the inspected free-form surface. They are iteratively constructed under the constraint of a certain allowable approximation error based on the shape information of the section curves. Data points needed for constructing the B-spline curves are taken as the measurement points.
Two strategies are proposed to acquire the better approximation of surface section curves with the B-spline curves. Knot positions of the B-spline curve are determined by equal chord error, and curve parameters are parameterized by nearly arc-length parameters. Knot vector and curve parameters are calculated based on the shape information of the section curves.
The proposed method can improve the inspection efficiency compared with the other two published methods. This is especially notable under the condition of fewer measurement points.
Measurement points of two compressor blades are sampled by the proposed method. Modeling error of the proposed method is slightly larger than that of the traditional method. However, the number of measurement points is reduced about 75% on the premise of ensuring surface modeling accuracy.
Footnotes
Handling Editor: Michal Kuciej
Declaration of conflicting interests
The author(s) declared no potential conflicts of interest with respect to the research, authorship, and/or publication of this article.
Funding
The author(s) disclosed receipt of the following financial support for the research, authorship, and/or publication of this article: This study was financially supported by the National Natural Science Foundation of China (grant no. 51475374).