
Abstract
The selection of appropriate sample size and point distribution on the measuring surface has been a fundamental problem in the contemporary coordinate metrology. It is usually resolved by the users depending on their instinct or prior experience. As a result, inspection results have to be compromised between accuracy and measurement time. However, to deliver quality products in minimum time, effort, and cost, a reliable and an efficient sampling plan is mandatory. Although there have been a remarkable progress due to the development of various procedures for computing the sample size and selecting the appropriate point distribution, still users are inconversant with the characteristics and applications of the available sampling methods due to the absence of a proper review. Accordingly, a systematic review, giving insight into the various strategies available for the sample size and the point distribution, is presented. In this article, different algorithms and their application in the estimation of sample size and point distribution have been reviewed comprehensively. The classification of sampling methods and the importance of adaptive sampling have also been described. It has been concluded that the effectiveness of inspection process or the performance of coordinate measuring machine can be escalated through the application of a suitable sampling strategy. Therefore, the metrologists should either develop an effective method for defining sampling strategy or select the most suitable method from the available resources before carrying out the inspection process.
Sampling strategy and its purpose
Coordinate measuring machines (CMMs), due to their high precision and accuracy, have been a vital cog in the inspection activities. 1 To meet the varying market needs and higher production throughput, the inspection process has to be well-defined and planned in order to perform effectively and efficiently. 2 However, CMM inspection planning is a complicated procedure, which comprises many constituents such as appropriate part set up, proper probe selection, optimum sampling of points, measurement sequence, and measurement speed.3,4 The complete process of inspection using CMM commences with the information accumulated through computer-aided design (CAD). The data from CAD are used to create computer-aided inspection planning (CAIP), which provides an integration link between CAD and CMM. The inspection plan can be transferred to CMM through Dimensional Measuring Interface Standard (DMIS) for the final measurement. 5 Meanwhile, the rise in complex part designs and the growing demands of tighter tolerances have led to the requirements of an established and an effective plan for inspection process on CMMs. According to previous studies,6–8 there can be many factors as shown in Figure 1, which contribute to the measurement uncertainty of CMM results. These factors include sampling strategy, workpiece position and orientation, surface conditions, sensor type and configuration, and environment conditions. As discussed by Moroni and Petrò 9 and Li et al., 10 sampling strategy (or the measurement plan) is one of the main factors which can escalate the measurement uncertainty.
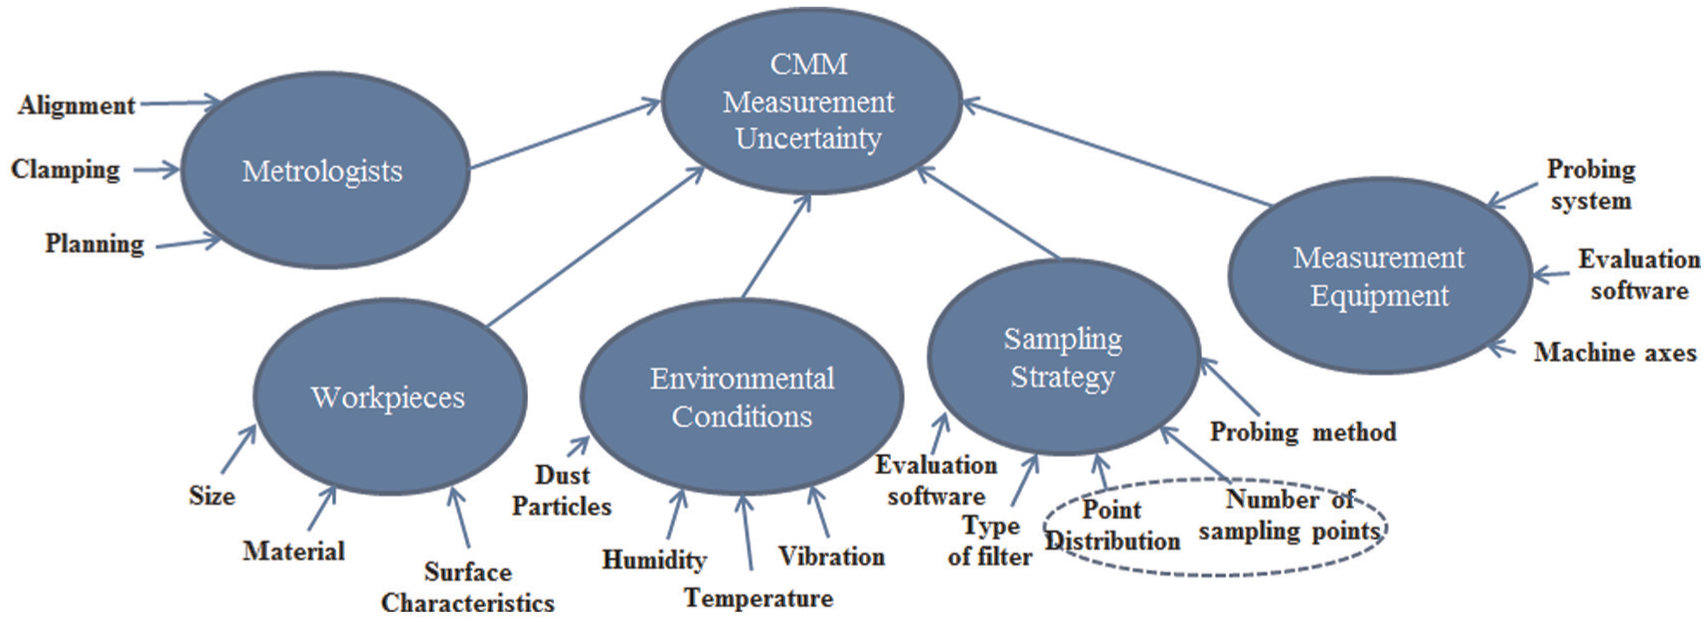
Factors responsible for measurement uncertainties in the CMM. 7
The measurement output from CMM consists of a number of surface points. 11 Each of these, data points provides a substantial amount of information regarding the geometry of the workpiece. 12 In fact, this information is utilized to extract details about the surface variation and different geometries on the part. The quality and quantity of this information depend on the density and location of measuring points. The sampling strategy involves the decisions regarding the number of points to be probed and their assignment (or distribution) on the measuring surface. 13 According to Colosimo et al., 14 the measurement strategy comprises two basic tasks: the selection of sample size and allotment of these measuring points. Although measurement error decreases with an increase in sampling points, it also increases the inspection time, which increases the measurement cost and hence the overall manufacturing cost. Therefore, it is of utmost importance to carry out the measurement task using an appropriate number of measurement points (or the sample size). 15 In fact, evaluation of the form error using a lesser (or just sufficient) data points has been the focus area to both researchers and practitioners. 16 However, smaller sample size necessitates the proper location of measuring points. 14 Actually, the appropriate distribution of measurement points on the inspecting surface is very crucial to generate an accurate feature. 17
Significance of sampling in the inspection process
A decision-making process which determines the sample size and location of sampling points on the measuring feature is known as sampling strategy.9,14,18,19 The accurate evaluation of dimensional and geometrical characteristics depends on many factors, including the sample strategy. 20 Ramaswami et al. 21 also emphasized the importance of sampling strategy in the inspection planning. They identified different factors, such as accessibility, convenience, simplicity, and cost, which should be considered while choosing a sampling method. As a result, any sampling method, which is useful, convenient, and adaptable in a certain situation, should be used if the measurement precision is inessential. However, if precision and accuracy are imperative, suitable sampling method should be devised depending on the application.
The sampling strategy can be perceived as one of the leading sources in the inspection uncertainty22–25 and a critical parameter to precisely evaluate the tolerance information. 26 The importance of sampling strategy in inspection can be realized from the fact that inappropriate sampling may lead to either the acceptance of defective items or the rejection of accurate parts. 13 Moreover, it significantly contributes toward the uncertainty and accuracy in the evaluation of form error.27–29 Literally, the contemporary manufacturing environments with lower production volumes, higher part variety, close tolerances, high-quality products, and so on, demand for a well-defined inspection planning.
It has been a known fact that measurement accuracy increases with an increase in the number of sampling points, but this also increases the computational cost. It is a known fact that the influence of sample size on the measurement uncertainty becomes constant after a certain value. 30 This suggests that neither the lesser number of sampling points is sufficient nor the large number of data points improves the accuracy. 31 According to Barari and Mordo, 27 inspection results are inaccurate when sampling points are insufficient or their distribution is inaccurate. They observed an uncertainty of 36% in the inspection results caused by the different point locations. Moreover, different geometric features on any given component are produced through various production parameters and operations to achieve their desired functionality. This leads to variation in dimensional accuracy and surface quality of different regions on the manufactured product. 12 Therefore, a standard sampling strategy is critical for different part features manufactured using different process parameters.
The identification of a suitable sampling strategy for improved CMM performance is a serious challenge and a daunting task. Although there have been many methods for defining the sampling strategy, still they are limited by part complexity, object shape, surface-fitting algorithms, rigid nature, error between manufactured parts and CAD, and so on. It follows that more efforts are needed to work out the sampling strategies, which can be employed to inspect production parts effectively and efficiently. 32 According to Bosch, 33 sampling strategy is both incomplete and scattered throughout the literature.
Factors affecting the sampling performance
The sampling strategy, filters, and evaluation methods should consider workpiece shape for computing the accurate value of geometric deviations. 34 For example, selection of appropriate sampling method for free-form surfaces depends on surface complexity, surface curvature, patch sizes, and so on.2,35 It is very important to assess the significance of reliable information against the economic considerations before devising a sampling strategy. Henceforth, researchers and metrologists have been exploring the effect of different parameters on the performance of sampling strategy. 13 For example, Neumann 36 and BS7172 37 suggested minimum possible points and assumed their uniform distribution along the entire surface for the precise evaluation of geometric elements. As mentioned by Odi, 38 the measurement uncertainty can be reduced significantly with uniform distribution of measurement points along the entire surface in a symmetric pattern. Moreover, it is very easy to maneuver a CMM in symmetrical patterns such as uniform spacing or angular positions, as compared to irregular intervals. According to Phillips, 39 the angular separation between measurement points can have a substantial effect on the measurement outcome of circular features. They observed accurate and precise results (radius and center coordinates) when three points were located 120° apart from each other. They also observed a significant variation in the measurement outcome, when the angular separation between the measurement points was reduced. Similarly, Chan et al. 13 studied the effect of sample size and starting position on the measurement accuracy. They noticed a reduction in the variation of calculated diameter values and a confined distribution of measurement points as the sample size was increased (from 3 to 20). They also concluded that the starting position became irrelevant after the number of sampling points reached to a certain level. Zhang et al. 40 also identified the machining process, feature size, tolerance specifications, confidence level, and so on, as the important factors in the selection of suitable sample size.
The choice of sample size to a significant extent also depend on the surface quality of the part. As reported by Raghunandan and Rao, 41 the sample size increases with an increase in the surface roughness, that is, poor quality surface needs more number of measurement points as compared to finely finished surface. As a matter of fact, a variation of more than 100 points can be expected in the measurement points between rough and smooth surfaces. The importance of metrological aspects was also emphasized by the authors. For example, the sampling points should not be located on or near the edges because edge measurement results cannot be trusted and are most often unreliable. 42 The primary factors, according to Álvarez et al., 43 are part characteristics, process capability, and equipment accuracy. As stated in Barari and Mordo, 27 measuring part’s characteristics, inspection equipment, type of form tolerance, nature of the geometric deviations, the knowledge of fitting criteria, and so on, define important criteria that may influence the performance of sampling strategy.
Sample size
The inspection cost can be associated with measurement points and the possibility of inspection errors.44,45 The large sample size would not necessarily result in accurate evaluation of measurement error. Actually, measurement error (or the measurement uncertainty) decreases with an increase in the sample size only up to a certain value. 46 There have been several techniques or methods in the last few decades that can be used to attain the appropriate sample size. The statistical method developed by Menq et al. 47 represents one such example. In this method, statistical concepts such as standard deviation and hypothesis testing were employed to compute suitable sample size and so on. Adaptive sampling (AS) usually begins with a few predetermined points and iteratively increase the number of points until a desired accuracy is achieved. It also depends on the surface characteristics, its shape and profile. This notion of AS was used by Edgeworth and Wilhelm 48 to find the appropriate sample size. The idea behind the development of proposed technique was the analogy between the sample size and part quality. Since the sample size was proportional to the part quality, highly accurate parts required lesser number of sample points as compared to low-quality parts. It was an iterative process which computed interpolating curve between sampled points using surface normals. This process was repeated until the measurement points converged to a complete and accurate evaluation of the surface. For the same number of measurement points, this method would require greater inspection time as compared to uniform sampling (US) pattern. However, required sampling points would be fewer in this method as compared to the US for an equivalent measurement task. Correspondingly, Jiang and Chiu 49 employed a statistical method to calculate the sample size for the inspection of two-dimensional (2D) rotational part features. The application of this feature-based approach required metrologist to input a pre-planned decision criterion in terms of an error amount. The regression and least square (LS) methods were used to validate whether the computed sample size satisfied the requirement. The fuzzy logic which provides a simple tool to solve problems with imprecise and incomplete information has also been used by several researchers. For instance, Lee et al., 50 Cho et al., 51 and Cho et al. 52 proposed a fuzzy system to optimize the sample size for measurement tasks. The area of measuring surface, design tolerance, volumetric error of the machine tool, and so on, were utilized as input parameters. To locate these points on the target surface, Hammersley’s (HM) algorithm was utilized. Similarly, an artificial intelligence–based modeling scheme based on fuzzy logic methodology was developed by Bulutsuz et al. 53 to select suitable procedure parameters, including the number of probing points. Apart from statistical and fuzzy concepts in sample-size determination, the applications of meta-heuristics (such as genetic algorithm (GA) and simulated annealing (SA)) can also be pointed out. For example, GA methodology proposed by Meo et al. 46 can be used to decide the appropriate number of inspection points and search area. In this methodology, center coordinates represented individuals in the GA population, while search space (rectangular) represented area enclosed by the roundness profile. The different parameter values included population size 70, selection (elitist selection), crossover probability 0.7, mutation probability 0.07, encoding scheme (floating point). Based on investigation, the optimum results were obtained with medium-sized search spaces (1–2 mm) and data sets of 100–500 points. The average error was about 0.062–0.063 mm. Simultaneously, Moroni and Petrò 44 developed an inspection cost model (based on the minimization of the inspection cost) to obtain an optimized sampling plan. They considered the influence of sampling strategy on the measurement performance as well as inspection error cost. Indeed, the SA algorithm was used to minimize the overall inspection cost and thus obtain an optimal sampling plan.
A search-based sampling procedure introduced by Badar et al. 54 can also be used to attain the appropriate sample size. In this procedure, initial set of data points was selected randomly, and the techniques of determining subsequent points varied according to the form tolerance. For example, region-elimination search method was employed for straightness evaluation, while tabu search and hybrid search (coordinate search, Hooke–Jeeves pattern search, and tabu search) were exercised for flatness evaluation. Additionally, other powerful techniques such as design of experiment (DOE) can also be used to obtain suitable sample size for any given application. Feng et al. 24 also suggested and adopted DOE to get appropriate sample size for the evaluation of hole dimensions. As noted by Raghunandan and Rao, 55 part information can have a significant influence on the performance of sample-size planning. A dynamic method known as progressive approach was used to reduce sample size for the evaluation of flatness. This technique was based on the comprehensive measurement of first part and subsequently, utilizing the gathered data information in sample reduction. This procedure was actually carried out in the following steps: part machining and inspection of first specimen, data analysis and application of algorithm to reduce the sample size, and finally, the assessment of subsequent specimens. Using the similar concept of incorporating basic part information, Pedone and Romano 56 developed a statistical approach and reduced the sample size. The technique initiated with the collection of information (usually the large point data set) for one or more parts in the lot. This was accomplished through the development of a regression model fitted to the large set of points. This method was found better than other renowned sampling techniques such as random sampling and Latin hypercube sampling.
Sampling techniques
The different sampling techniques include US, random sampling, and stratified sampling.13,27 In case of random sampling, the points are irregularly (haphazardly) distributed on the entire measuring surface and generally provides a non-realistic representation of the geometric feature. Contrarily, in US, the points are consistently distributed along the entire surface. The first point is selected randomly, while the remaining points are arranged at equal intervals along the entire surface. The US has been the most common technique used in the distribution of sampling points. Although this method is simple, it may cause inaccurate results in surfaces where sharp curvature variation exists and also often results in more unnecessary sampling points on the flat surfaces. 42 The stratified sampling, however, is a technique where complete point set is divided into subsets (also called as strata).28,57 For example, grid sampling is a kind of stratified sampling method, where the surface is segregated in sampling grids of identical area. The grid count is equivalent to sampling size, and each grid provides a randomly selected point during the distribution. The stratified sampling is one of the most commonly used sampling techniques. To investigate the performance of stratified sampling model, Fang et al. 58 introduced a linear model for stratified-sampling scheme. They noticed stratified sampling more effective as compared to random sampling.
Sampling algorithms can further be classified into surface feature–based and optimal sampling (such as GA). 2 The surface feature–based sampling techniques include equi-parametric sampling, surface patch size–based sampling, surface patch mean curvature–based procedure, and a hybrid approach. Inspection data points are uniformly distributed on the surface throughout the parametric space in case of equi-parametric sampling. Since it includes a large approximation, it cannot be used for surfaces which involve patches with great size variations. EIMaraghy et al. 59 used an equi-parametric sampling method, to distribute sample points in the parametric space of B-spline surface (u–v space). However, patch-based sampling involves the division of a surface into patches. The patches are sorted depending on their sizes and then, sample points are distributed with large patch getting more points. It provides a good option when surface complexity is primarily dependent on the variation of surface patch sizes. Therefore, with this technique, surfaces with large curvature variation require larger sample sizes to achieve higher accuracy. The patch mean Gaussian curvature–based method is quite similar to patch-based sampling. The difference is that it arranges patches based on their mean Gaussian curvature. It is actually a useful technique for surfaces with sharp curvature changes. However, larger patches do not get enough points when curvature variation is mainly prevailing within the smaller surface patches. The hybrid sampling combines previous two methods, and weights are assigned to each of the two methods to carry out sampling. All of the above-mentioned methods have their benefits and limitations. For example, equi-parametric sampling is easy to implement, but inappropriate for surfaces with sharp curvature and variable surface patch size. However, it provides a good alternative for flat and smooth surfaces with little or no curvature changes. Similarly, patch-based sampling is an inaccurate sampling plan for surfaces with sharp curvature changes, especially when sharp curvature exists on the smaller patches. In case of the patch mean Gaussian curvature–based sampling, there is a possibility that large patches can be represented with lesser number of sampling points, resulting in an inefficient sampling plan. The selection of weights in case of hybrid sampling problem is a serious issue and solely depends on user’s skills. The above algorithms provide better options for allocation of sampling points on complicated surfaces. 2
The appropriate determination of measurement data points and their distribution on part surface have always been a challenging task for metrologists. Moreover, the non-existence of a standard procedure or guidelines makes this exercise even tougher for inspection engineers. 27 However, there have been lots of work taking place in this direction. For example, the three measurement point distribution methods (uniform, curvature-dependent, and hybrid) proposed by Pahk et al. 60 represent one of the pioneer works on the board. Lately, Vrba et al. 61 identified three different sampling strategies, including circumferential section method, generatrix method, and helix path method as shown in Figure 2(a)–(c), respectively. Among the three methods, they found circumferential section method is independent of the evaluation method. However, for generatrix and helix path method, the least cylindricity error was obtained with maximum circumscribed circle (MCC) as evaluation method. Moreover, helix path method resulted into least accuracy due to the combined effect of positioning errors and stylus position in the direction of all three axes. Similarly, the spiral sampling method proposed by Guan et al. 62 can be utilized for flatness measurement. Since spiral movement is a combination of linear and circular movement, spiral generation can be governed by two movements. So, the speed of these two movements is a key parameter in spiral sampling. The US points’ positions can be obtained by setting reasonable parameter values and their optimization.
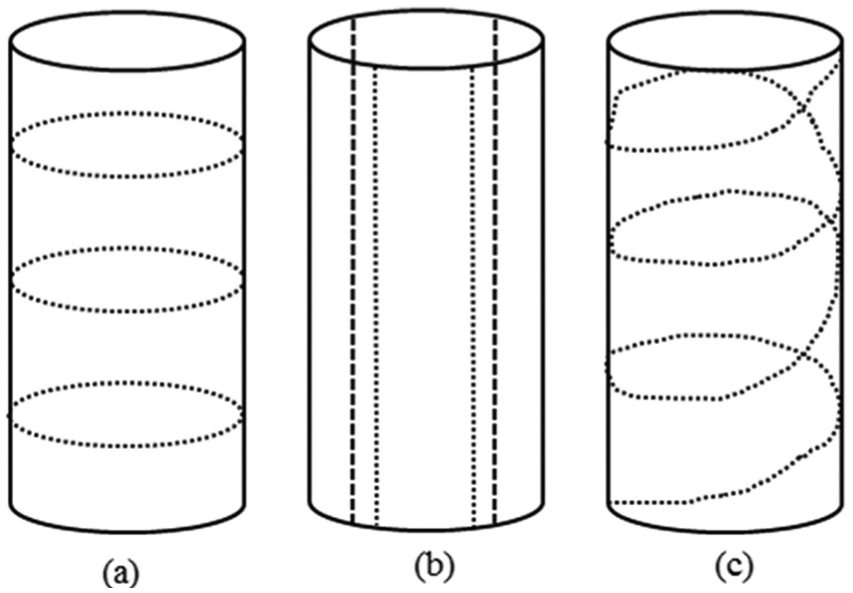
(a) Circumferential section method, (b) generatrix method, and (c) helix path method. 61
The sampling strategies can also be classified as blind sampling 63 and AS 32 as shown in Figure 3. The blind sampling strategies do not depend on object shape, part complexity, or surface characteristics. They do not take into account the deviations originated from manufacturing, rather consider the rules depending on the nominal geometry of a given feature. 64 They include sampling techniques such as uniform, random, HM, Halton–Zaremba (HZ), and stratified sampling. They are also easy to implement. 32 In an attempt to compare blind sampling strategies, Woo et al. 65 studied three different procedures which included standard sampling techniques, that is, US, HM, and HZ sequences. They concluded that US is not as efficient and effective as the other two due to surpassing sample size and error approximation. They explained that HZ sequence can only be defined in 2D, while HM sequence is more general in its applications. The number of HZ samples must be a power of 2 (2, 4, 8, 16, etc.) which is it’s another limitation. Moreover, HM or HZ should be preferred over US while inspecting cylindrical components. 28 The HM point sets are more consistently distributed as compared to HZ points. 66 Furthermore, HM sequence results in a quadratic reduction of measurement points, in contrast to US.12,67 It can also be pointed out that HM sequence is more accurate than a random distribution, for the same sample size. In fact, stratified HM sampling is a more robust technique than stratified random and stratified US techniques. Correspondingly, Colosimo et al. 14 compared three proposed sampling techniques extended-zone (EZ) method, principal component variables (PCV), extreme points selection (EPS) with each other and with HM sequence and polar grid (International Organization for Standardization (ISO)) techniques. They observed that proposed techniques, distributed data points mainly at the center or at the periphery of the surface being measured. They used the difference between reference form error (including the entire data set) and computed error (for the specified subset), as a performance indicator. They concluded that EPS technique outperformed all other methods. They also found in their particular case that the ISO procedure should be adopted over HM sequence.
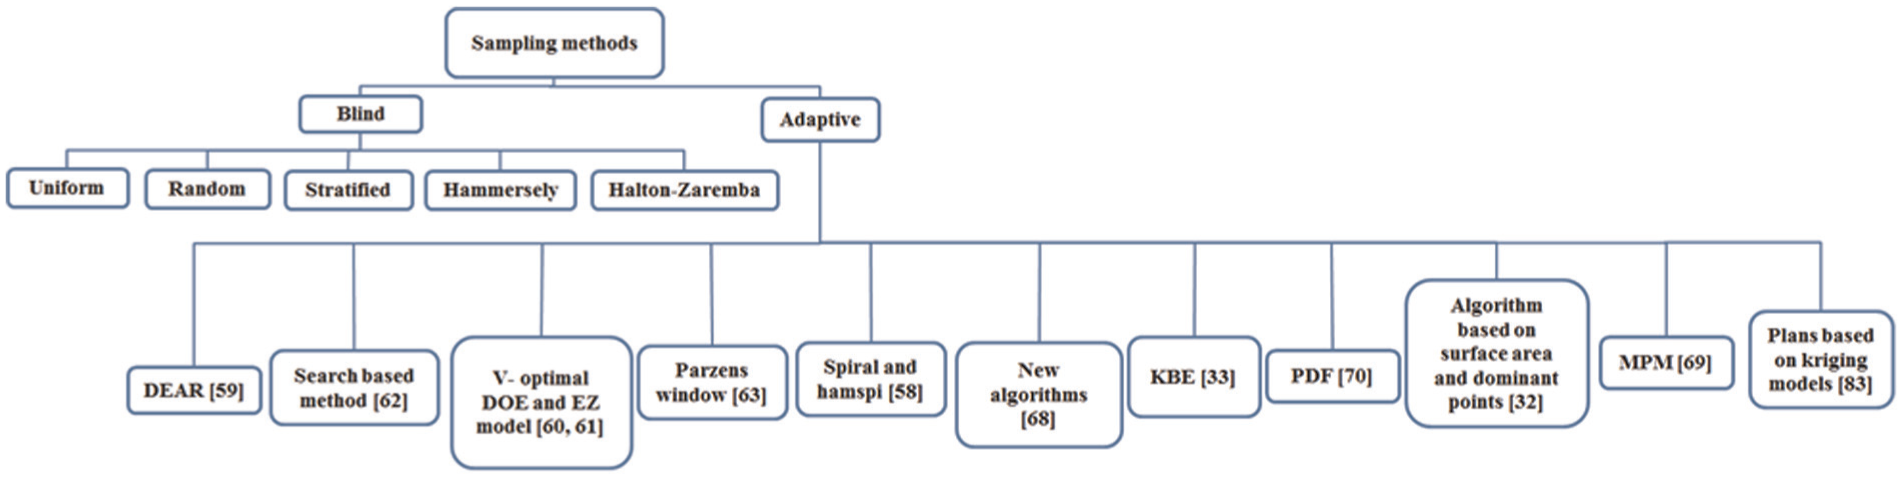
Different sampling methods.
Literally, selection of appropriate sampling method depending on the application requirement is a demanding task which requires a pragmatic approach. For instance, the idea of priority coefficient was used by Kim and Raman 68 to determine the sampling method. They compared four sampling methods, including HM sequence, HZ sequence, aligned systematic, and systematic random sampling, each of sample sizes 4, 8, 16, 32, and 64. They found that systematic random sampling and HZ sequence resulted in highest accuracy. Moreover, aligned systematic sampling method was found to be least accurate among four sampling methods. The aligned systematic and systematic random sampling methods produced shorter routes as compared to HM and HZ sequences. It was also observed that HZ and systematic random sampling were most efficient at greater values of priority coefficient, while aligned systematic and systematic random sampling were good at lower ranges of priority coefficient. According to Rossi and Lanzetta, 69 an optimal value for sample size and search space, which provides highest accuracy and lowest computation time, always exist. It is very important to identify an appropriate sampling strategy before any technique can be applied to get minimum-zone (MZ) form error. It is always a good idea to find a proper balance among sample size, accuracy, and computation time.
AS
The machining or the manufacturing process often produces a particular pattern on the surface of the workpiece.70,71 Therefore, it is critical for the sampling strategy to take surface characteristics, patterns, and so on, into their consideration. Actually, AS strategies (Figure 3) depend on its surface curvature, complexity, shape, and so on. In AS, sample size and point distribution vary depending on the complexity and curvature of the measuring surface. This suggests that complex portions of the surface would contain more number of sampling points, while simpler regions would include the lesser number of points. 32 According to Barari and Mordo, 27 AS has always been the most suitable option when assessing the form tolerance using the MZ method. This is because, it is a dynamic approach which adapts depending on the real geometry and its profile. 64
The deviation-based sampling technique by Rossi 72 followed adaptive procedure to minimize inspection time in the measurement of roundness. It was actually a three-phase sampling procedure and known as the deviation-based assessment of roundness (DEAR). The working steps for this methodology can be defined as follows: it commenced with defining an initial sampling based on linear distribution and evaluation of form error. The computed error was then used in two-peak test to determine whether the deviation was cyclic or non-cyclic. For cyclic deviation, second pre-sampling procedure based on exponential distribution (including exponential spaced points) was adopted. Then, two-point filter procedure was utilized to compute peak to valley distance. Finally, distribution was defined for peak and valley locations and the form error was computed. They evaluated the proposed system’s performance through evaluation of holes manufactured using boring process. They found satisfactory results in terms of accuracy and inspection time. Similarly, Elkott et al. 2 proposed a tool, which can be employed to select a particular sampling algorithm required in the measurement of free-form surface. This tool was based on an algorithm which investigated surface complexity, curvature and patch size, and so on. To optimize sampling procedure, GA-based methodology was implemented. This algorithm was especially useful while inspecting free-form surfaces using tactile CMM. In this algorithm, GA optimized the coordinates of sample points through minimization of maximum deviation between generated geometry and ideal part. The criterion used for comparison of different sampling algorithms was defined as follows
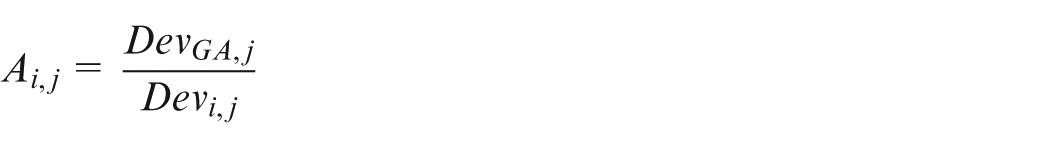
where Ai,j is the accuracy of ith algorithm when applied to jth surface, DevGA,j is the maximum deviation between substitute geometry and CAD surface when GA sampling was applied to sample the jth surface, and Devi,j is the maximum deviation between substitute geometry and CAD surface when ith algorithm was applied to sample the jth surface.
Meanwhile, Summerhays et al. 73 proposed a criterion based on V-optimal DOE to choose the location of sampling points. In this work, EZ model 74 was employed to optimize the sample pattern. It required the generation of a compact, uniform 2D point sampling pattern on the part feature. The induced pattern was then used (as a complete set of sampling locations) to subsequently select the sparse subsets. The sampling density actually depended on the frequency and magnitude of surface irregularities. It had been found that accomplished sampling patterns and proposed analysis methods produced better results as compared to US and conventional analysis algorithms. Although this method was developed for full internal cylindrical surfaces, it can be applied to other nominal feature geometry. According to Badar et al., 75 the incorporation of manufacturing errors induced during the manufacturing process is critical to sampling strategy. Therefore, they utilized an AS methodology, considering the surface error, to obtain the appropriate sample size. In fact, the idea was to determine the point of maximum deviation at the earliest using a search-based method. The selection of the initial sampling plan was based on surface patterns or error model. Actually, the structure of primitive sample points was directed by the part geometry and its manufacturing conditions. The main thrust of this work was the quantification of surface profile and minimization of sampling data, maintaining the same accuracy. An AS method developed by Barari et al. 76 distributed points iteratively depending on the measuring surface. This method was based on the development of a probability density function (PDF). The Parzen-window technique was used to estimate density function for the evaluation of surface error patterns. This density function was in turn used to locate critical portions on the surface. The density function was estimated using critical points and the surface error was evaluated using MZ method. The process was iterated until the desired accuracy was attained. They adopted a stratified procedure for initial sampling and uniformly divided the surface in 16 elements of identical parametric area. This method can be used for evaluating the geometric deviations induced by systematic and non-systematic errors. The spiral and Hamspi sampling methods introduced by Collins et al. 70 can be used for the inspection of flat and revolved surfaces. In fact, spiral method focused around the center area and used the Archimedean spiral, while Hamspi combined both spiral and randomized HM to compute points in the middle as well as the periphery of workpiece. The spiral and Hamspi methods had similar point distributions as that of HM sequence, but they emphasized more at the origin of workpiece. The beginning and ending cutting zones are very crucial while devising a sampling process for machining surfaces. ElKott and Veldhuis 77 developed a strategy to handle CAD objects made up of multiple surfaces. They developed a sampling method for the sculptured surfaces involving trimmed and composite surface features. The determination of sampling point locations in this technique was based on three main parameters: surface curvature, deviation between substitute geometry and CAD model, and significance of the trimmed portion of the surface.
The knowledge of patterns (or the manufacturing signatures) generated by the particular manufacturing process while designing a sampling strategy can minimize the measurement uncertainty.78,79 Colosimo and Moroni 80 developed a strategy which focused on distributing more points in regions which deviated the most according to signature model. It meant that any modification in signature needed a change in the sampling strategy. The proposed methodology was based on two phases. First phase (also called as learning phase) used dense and US strategy. This phase was aimed to identify critical points (points that actually affected the computation of form error). To accomplish this task, they employed a strategy based on the computation of tolerance intervals in regression. It signified that tolerance interval had to be tight in zones (i.e. more sampling points should be concentrated) where feature deviation from the ideal feature was higher. The more sampling points were concentrated in critical areas. The SA algorithm had been employed to optimize nonlinear problems. Three algorithms developed by Obeidat and Raman 81 can also be used to calculate sample size and choose suitable point distribution in the inspection of free-form surfaces. These algorithms were adaptive in nature and defined sampling strategies based on surface curvature. For example, first algorithm divided the surface in patches and distributed points based on their curvature. This procedure commenced with distribution of critical points (i.e. points of maximum Gauss curvature, mean Gauss curvature, and point using the average of mean Gauss curvature and minimum Gauss curvature) in different patches followed by computation of deviation between substitute geometry and CAD model. The algorithm kept on adding points, until satisfactory results (maximum deviation within the specified tolerance) were obtained. However, second algorithm assumed sample size in the beginning and ranked patches based on their sizes. This algorithm then distributed sampling points based on patch size, that is, large-size patch would get more points as compared to smaller size patch. In each patch with three or more points, first three points were defined as critical points and rest of the points were computed based on overall distribution. The third algorithm ranked patches depending on mean Gaussian curvatures and patch with high mean Gaussian curvature accumulated more points. The points within each patch were derived adaptively and distributed randomly starting with a patch of highest mean Gaussian curvature. The main objective in all these algorithms was identification of critical points in each patch on the surface. These algorithms were fast and can be applied to any surface irrespective of its complexity. As reported by Álvarez et al., 43 it is very important to understand the surface in question before devising any sampling strategy. Therefore, they recommended to inspect initial parts in detail, so that an accurate value of the form error can be known to improve upon the sampling strategy. They proposed a sampling methodology based on several decision rules and called it as knowledge-based engineering (KBE) system. These rules considered lot size, type of feature or tolerance, type of data acquisition system, requirement of maximum or moderate accuracy, type of filter, distribution algorithms, and so on. Actually, the sole purpose was to collect all the knowledge and store it in KBE platform to carry out inspection planning. Subsequently, Rajamohan et al. 42 proposed sampling strategies which depended on surface area and computation of dominant points. The surface area–based point distribution was accomplished in the following two steps: determination of surface area, assuming that the surface was made up of planar triangular facets and computation of area per sample point so that aspect ratio between x and y axes was maintained. The second strategy categorized surface points with maximum local mean curvature as dominant points. This method followed these steps: identification of dominant points, definition of initial sample set using four corner points, generation of regions on the surface using initial sample set, and addition of sample points starting with largest region. The sampling strategy based on surface area resulted in better point distribution as compared to dominant point–based sampling strategy. In fact, the strategies based on patch size ranking and dominant points showed much better distribution of points with a smaller sample size in flatter regions.
An effective sampling strategy is the one which obtains critical regions, that is, the regions of highest deviation using the minimum possible number of measurement points. To incorporate this concept, Poniatowska 82 developed a methodology based on the concept of machining pattern model (MPM). The MPM was used to identify locations of greatest geometric deviation and determined an efficient sampling strategy. The techniques, such as regression analysis, iterative procedure, spatial statistic procedures, and non-uniform rational Basis spline (NURBS) modeling, were utilized as a part of the methodology to plan the inspection of free-form surfaces. The crux of this methodology was computation of systematic error of the complete batch and incorporating this information to develop a sampling plan for subsequent parts in the batch. Likewise, the concept of finite element modeling (FEM) can be employed to develop sampling plan for inspecting free-form surfaces. For instance, Yu et al. 32 generated a form error model, where they superimposed appropriate form errors on the nominal data. The measurement points were iteratively distributed and increased depending on the maximum deviation between substitute geometry and FEM. 32 Ascione et al. 83 developed a stochastic approach based on kriging models in order to accomplish AS strategy. To minimize systematic bias, this methodology aimed at integrating design and inspection phases sequentially and iteratively. The subsequent measurement points in this methodology were selected based on predictions, where prediction uncertainty of geometric deviations was computed using kriging models. Furthermore, the technique based on probabilistic approach was proposed by Martins et al. 84 for the evaluation of flatness error. This method was actually based on the determination of critical points. Initially, a PDF was created, taking into account the prior surface model and a set of measurement points. This was followed by the flatness calculation using MZ method and the selection of sampled points for subsequent steps. Furthermore, a new PDF was created using a new set of sampled points and this process was repeated, until flatness measurement was within the acceptable levels of uncertainty. The proposed AS approach outperformed random sampling method. It reduced the sampled points to three times than that of the randomly selected points to attain 90% of the actual flatness value. In recent times, a new method has been introduced by Lai et al. 85 for computing inspection points in T-spline surface reconstruction. The sampling points were calculated depending on the dominant control vertices of the surface. Therefore, total number of measurement points was identified by the number of control vertices. This sampling strategy was adaptive in the sense that more measurement points were defined in critical areas to achieve better inspection accuracy. The contribution of each of these control vertices had to be computed in order to be selected for the sample point.
Conclusion
This review has demonstrated the importance of effective sampling strategy in the inspection process. It has also pointed out the different factors that affect sampling performance. Generally, CMM users make decisions (regarding sampling points and their distribution) intuitively (based on their experience) or through hit-and-trial procedures. It increases the inspection cost as well as reduces the accuracy and uniformity in the measurement results. Thus, it is important for the users to learn about different methods that can be employed in devising sampling strategy. Based on the above survey, the following inferences can be made:
Neither the minimum number of measurement points nor their excessive increase is sufficient.
A trade-off must be established between the efficient sampling strategy and the desired accuracy.
There always exists an optimal value for the sample size and the search space which can provide highest accuracy and lowest computation time.
Among measurement sequences, HM or HZ sequence can be preferred to US.
Currently, the AS strategies which depend on surface characteristics are most preferred. Higher iteration time is one of the primary limitations that can be associated with AS.
When the measurement accuracy is not important, any sampling method which is convenient, simple, and user-friendly in a particular situation should be used. However, if the accuracy is a primary requirement, the most appropriate sampling method should be designed depending on the application.
Among the different techniques, the GA-based optimization is the most accurate sampling technique; however, it requires higher computation effort.
Regarding the sampling parameters, particularly with GAs, very few contributions are available in the literature. Moreover, a solution to the sampling strategy which takes into account all the factors is still inaccessible. There is a relationship between time, cost, and accuracy. Hence, a universal standard sampling strategy that can improve flexibility and interchangeability should be devised.
Footnotes
Declaration of conflicting interests
The author(s) declared no potential conflicts of interest with respect to the research, authorship, and/or publication of this article.
Funding
This project was financially supported by King Saud University, Vice Deanship of Research Chairs.