
Abstract
This article assesses the performance and reduction level of five engine oils available from various manufacturers. The trend and intensity of the cranking viscosity changes as measured in the cold cranking simulator were thoroughly analysed. In the presented experiment, alterations in engine oils appearing during actual operation were noted. The tests were conducted under conditions which can be depicted as ‘harsh’, that is, multiplied starting of the engine, extended engine idling and short stretch driving. All of the engine oil samples were collected from passenger cars of a homogeneous fleet of 25 vehicles. The dynamic (cranking) viscosity was determined according to the ASTM D5293-15. In all analysed cases, there was a dangerously rapid increase (36%–69%) in the cranking viscosity, and the limit values (7000 mPa·s) were reached very quickly (for the mileages in the range of 3000–13,000 km). The obtained results have led to the development of a statistical model, allowing vehicle users/drivers to choose a better engine oil in winter, thus improving the engine’s ability to cold start and protecting it from excessive wear or damage. The test results may help to predict the performance of the engine oil during operation, its service life and an oil-change interval.
Keywords
Introduction
The CO2 emissions and fuel consumption reduction have arisen as a key driver of the research and development in automotive industry, linked to a general public concern over global warming and the green house effect caused partially by the green house gases emitted by the vehicles which use internal combustion engines as powertrain. 1 The cold engine operation in early phases of any driving cycle is characterised by higher frictional losses, ineffective combustion, increased fuel consumption and exhaust emissions. 2 Most of the harmful substances (≈60%–65%) are produced in the course of the thermal engine stabilisation which takes place during initial phases of driving. 3 Wang and Stone 4 showed that the cylinder wall temperature is a significant parameter influencing HC and NOx emissions from internal combustion (IC) engines. When engines become hot, the lubrication conditions change due to alterations in oil viscosity and clearances between rubbing surfaces. As the lubrication conditions change, each individual component’s friction contribution to total engine losses changes as well. 2 Consequently, speeding up the process of engine oil warm-up in the initial phase of a driving cycle has a significant impact on engine friction, fuel consumption and the reduction of CO2 emissions. 5 As a potential solution, engine thermal management systems (TMSs) are now being developed involving not only the coolant, which undoubtedly affects the thermal efficiency of the engine, 6 but also the engine oil as well. Among all currently available options for friction reduction, the oil thermal management has not yet received the attention it deserves 7 despite the fact that speeding up the lubricant oil warm-up time brings benefits in terms of lowering both the level of fuel consumption (about 2.8%) and pollutant emissions.3,5 Vittorini et al. 7 reported the following reductions in vehicle exhaust emissions: CO2– 51.4%, HC – 44.6% and NOx– 41.8%.
Issues related to the performance of engine oil at low temperatures, such as cold start and low-temperature pumpability, have been studied since the 1960s. 8 Some of the research has been conducted by Selby, 9 who arrived at the conclusion that ‘low-temperature starting cannot necessarily be improved by the simple expedient of increasing the starting system capacity, rather, good low-temperature oil viscosity is required’. In the 1980s, issues related to oil gelling and the Scanning Brookfield Technique (SBT) have been thoroughly studied in connection with the failures of engines operating at low temperatures. 10
One of the methods for assessing low-temperature properties of oil is the use of cold cranking simulator (CCS). This is a relatively fast and accurate way of measuring the viscosity of engine oil at low temperatures. Society of automotive engineers (SAE) adopted the cold start simulator method as the basis for classifying the viscosity of the J300 class engine oils. The device also allows users to model the oil operation at high shear rates and cold-weather starting.
The viscosity of engine oils belonging to non-Newtonian fluids strongly depends on their internal structure, hence the name structural viscosity. However, the term ‘structural viscosity’ is not used very often, thus, in this article, the term ‘cranking viscosity’ was applied, in compliance with SAE J300-2015.
The most important function of the oil is to prevent various metal components of the engine from heating up and friction, and it can only be achieved if the oil flows through every part of the engine. 11 That is why, modern day engine oils are expected to ensure proper lubrication of all co-operating engine parts, even in the case of cold start and before the oil is warmed up to its normal operating temperature. Today’s engine oil formulators must continually balance performance in various low-temperature rheological tests, including mini-rotary viscosity (MRV), Scanning Brookfield Gelation Index (SBT\GI) and CCS. Frequently, optimisation against one low-temperature specification leads to sub-optimal performance in another, a direct consequence of significant differences in the cooling rates and shear rate/shear stress regimes employed in the tests. 12 Buck and Lohuis carried out tests to assess the low-temperature start-up and pumping characteristics of both light and heavy vehicles with diesel engines using various oils. In their research, they included conventional mineral oils as well as hydrocracked and synthetic lubricants. The results showed that lower-viscosity-grade oils using special base stocks, in particular synthetics, demonstrate improved low-temperature cranking and pumping performance over conventional lubricants. 13 Hawley et al. have shown that the cold cranking is the dominant factor on fuel consumption during the early stages (UDC – Urban Drive Cycle) of the NEDC (New European Drive Cycle) when the engine oil temperature is still low. A reduction in cold cranking of approximately 30% resulted in a fuel economy improvement of 5.5% over the cycle. However, this benefit is not observed during the later, hot portions of the cycle (EUDC – Extra Urban Drive Cycle). As the majority of fuel is consumed during the ‘hot’, high-speed portion of the cycle, the benefit observed for the NEDC as a whole is slight at 1.5%. 14 Furthermore, Zhou and Houldcroft 15 introduced an analytical approach to estimating the minimum torque required to start an engine at low temperatures (down to −30°C). They used the mechanical friction models developed previously by themselves and thus showed that although piston, bearings and valvetrain are still significant mechanical friction sources for a cold engine, the petrol engine torque is actually the biggest contributor to the minimum torque required to put the vehicle in motion.
Although good low-temperature properties of fresh oils are one of the key SAE J300 requirements, yet they are not sufficient to ensure a long lifespan and top performance of the engine. The oil gradually degrades during operation and its properties, including low-temperature properties, change over time. Oberoi and Goldmints 11 have examined the low-temperature pumpability of several oils in a modern 2010 emission-compliant heavy-duty diesel (HDD) engine. They showed that good fresh oil low-temperature properties such as MRV/TP-1 apparent viscosity or gelation index (GI) do not guarantee good field performance and claimed that not all bench tests can predict failing performance in the field. Hence, the aim of this study was to analyse cranking viscosity changes of engine oil samples collected from vehicles that were operated under similar driving conditions. Based on the obtained results, a statistical model was developed, which can be used for predicting engine oil performance during its use.
Viscosity is one of the key parameters in the evaluation of the condition of engine oils.14,16–18 Recently, there has been a sharp rise in the number of scientific articles devoted to oil quality based on the measured changes in viscosity. Most of the studies available in the literature address the kinematic or dynamic (e.g. high-temperature high-shear (HTHS)) viscosity, but only few of them try to investigate dynamic viscosity under simulated low-temperature cold-start conditions.
Materials
Engine oils available from five manufacturers were applied to 25 randomly selected cars (each oil to five different vehicles). All of the cars in the study constituted a homogeneous fleet and were operated in urban driving conditions. The cars were uniform in terms of brand, type and operating conditions and belonged to the Driver Training Centre fleet. All of the cars were generally used for conducting driving licence tests. The vehicles were fitted with petrol engines. Detailed specifications of the engine are as follows:
Capacity of the lubrication system: 4 dm3;
Fuel supply: MPI;
Cylinder volume: 1.33 dm3;
Engine type: double overhead cam (DOHC) Mitsubishi Innovative Valve Timing and Lift Electronic Control System (MIVEC);
Maximum power: 80 kW@6000 rpm;
Model code: 4A90.
All of the oils that underwent testing were put into the car engines in July. The first batch of samples was collected in October (the average air temperature in the first test period was 23°C), the second batch of samples was collected in January (the average air temperature in the second test period was 5°C), the third set of samples was collected in April (the average air temperature of 11°C) and the final set was collected in July of the following year (the average air temperature in the fourth test period was 25°C). In terms of viscosity of engine oil at low temperatures, the most interesting from the perspective of the entire research was the second test period, when the vehicles were operated under cold wintertime conditions. Water and fuel have a tendency to accumulate in the crankcase and contaminate the engine oil when the oil temperature does not reach the thermostat setting.
The oils selected for testing belonged to the same 5W-30 viscosity class and met strict quality requirements stipulated by the car manufacturer. Detailed specifications of engine oils used in the study and their code names are shown in Table 1. Viscosity class 5W-30 was chosen based on the recommendations of the engine manufacturer and the popularity of this class among vehicle users.
Quality and viscosity classifications of the engine oils selected to the study.

As many as 23 cars were operated in urban driving conditions characterised by short-distance driving, extended idling, and frequent starting and stopping of the engine. Such operating conditions may pose a challenge to the performance of any type of engine oil. The other two cars with codes PS 018193 and CE 017977 were operated under typical mixed driving conditions, which are much less demanding. The results of viscosity tests for these two cars were used for comparative purposes only. Since these vehicles did not meet the requirement of being operated under similar driving conditions, they were excluded from all further statistical analyses.
In order to ensure the representativeness of oil samples during their entire service life, an appropriate sampling frequency was set so as to avoid excessive oil loss and the need to refresh it by topping up. Following the recommendations of the fleet owner, the oil was replaced every year regardless of the number of kilometres travelled. Therefore, it was decided to take samples regularly on a quarterly basis starting from the moment of oil change. The samples of fresh oil were also collected and tested. In the course of the study, two of the fleet cars were withdrawn from services for reasons beyond the control of the authors. That is why, in the first and the second quarter as many as 25 samples were collected in each period, whereas in the third and the fourth quarter, there were 23 samples each. During the whole study, 96 samples were collected in total.
Figure 1 shows information related to the number of kilometres travelled by each of the vehicles used in the test. The sample code number is a combination of the oil code and the car code number. Fuel consumption in the driving cycle performed amounted, on average, to 6.8 l per 100 km.
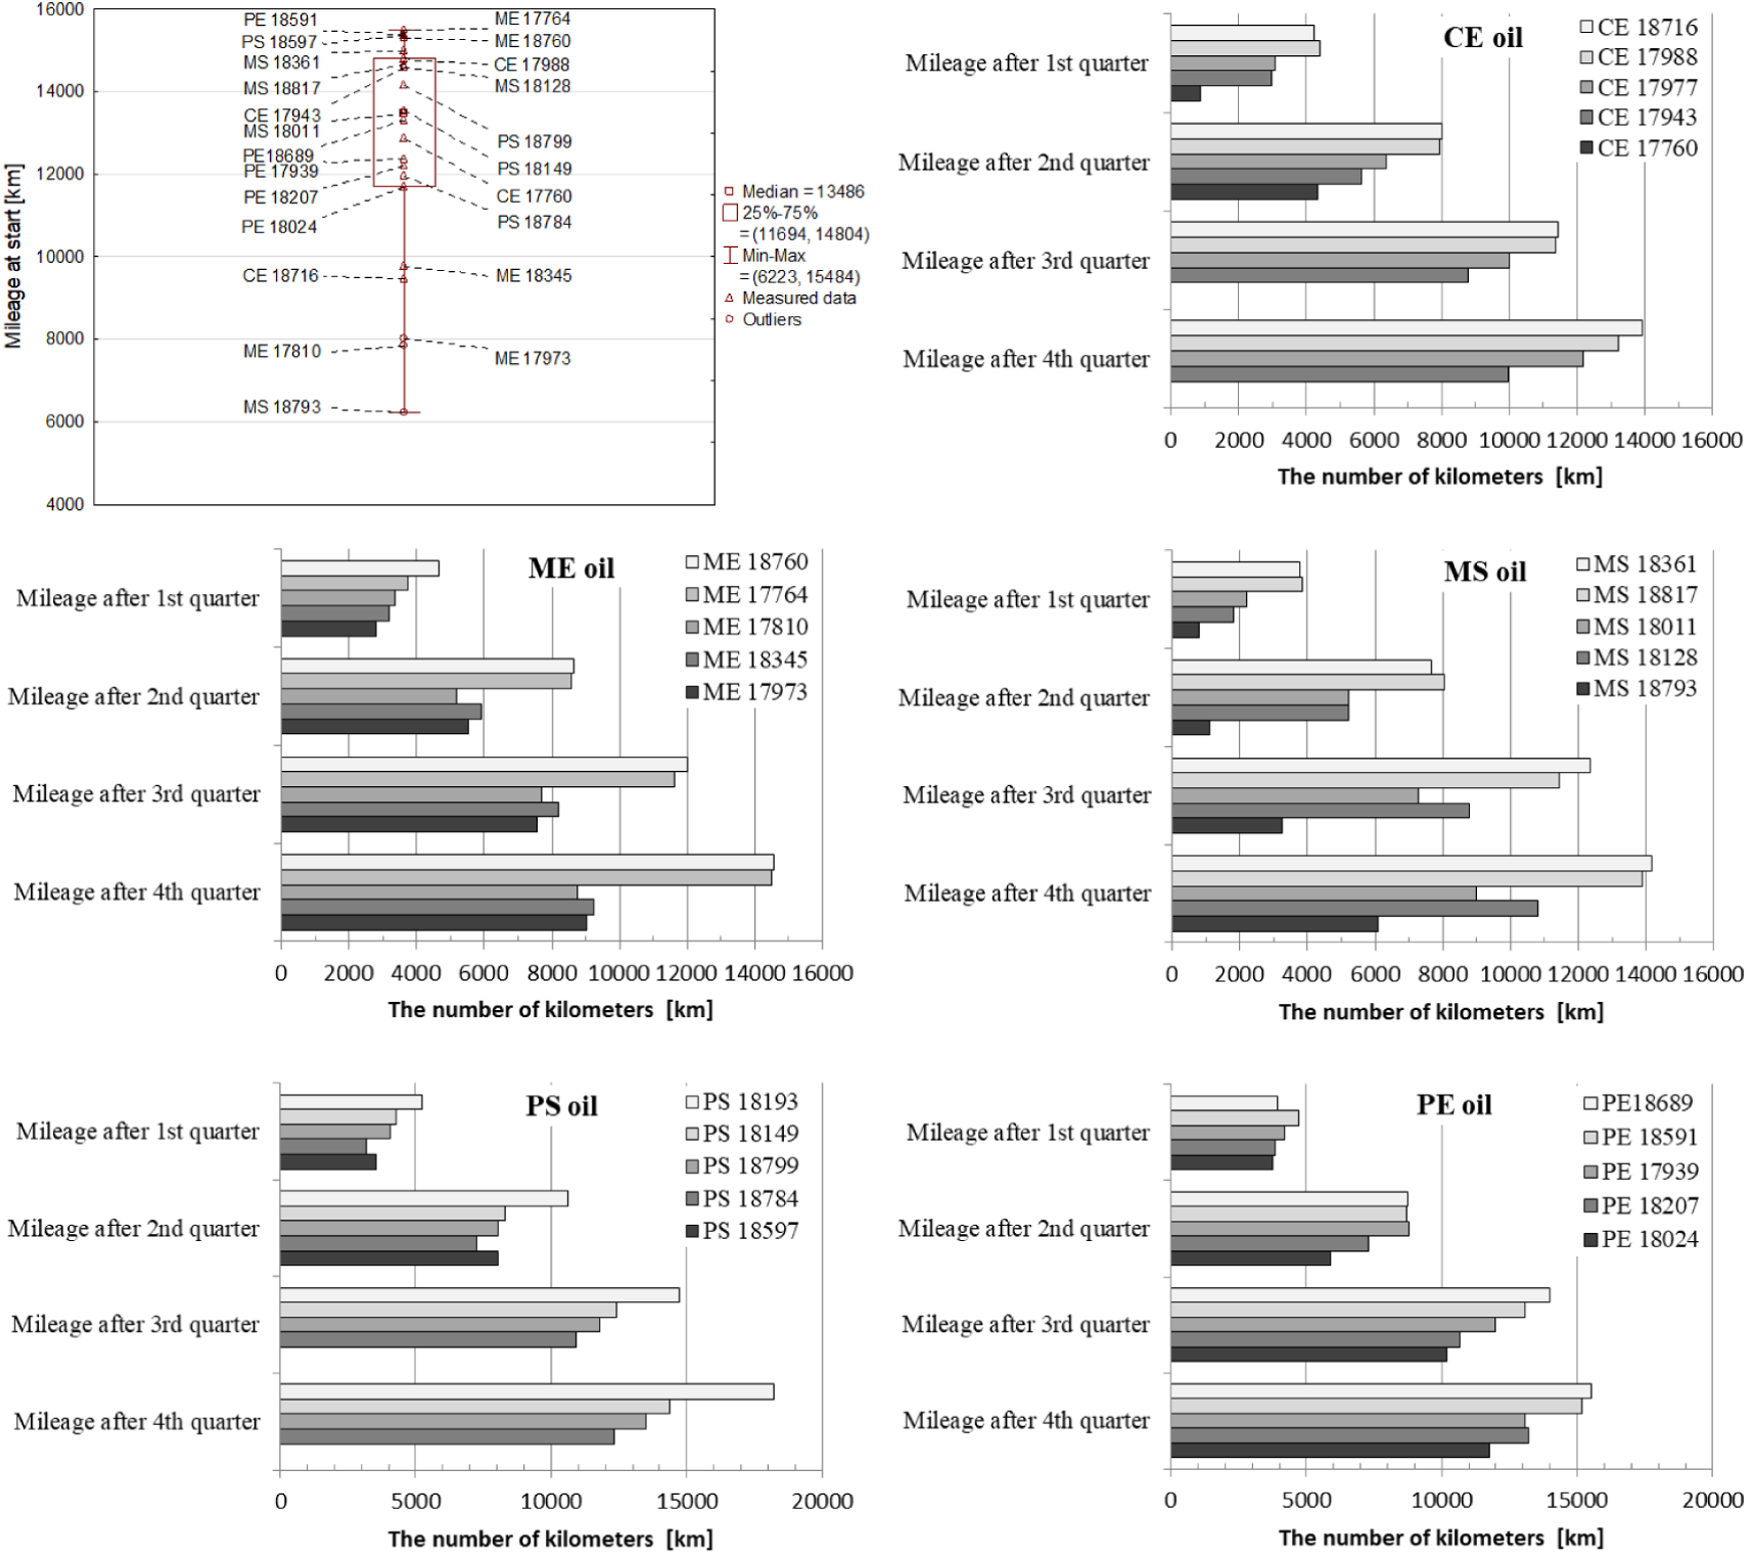
The number of kilometres travelled by each car.
Methods
The measurement of cranking viscosity at low temperatures was carried out in accordance with the ASTM D5293-15 19 on a device known as the CCS (Figure 2). The obtained value indicates what resistance the cooled oil has to the rotor. Such measurement was possible due to the effect of force on fluid motion. The relationship between the applied force and the velocity of each fluid layer is determined by the Newton equation. The coefficient representing the flow resistance is referred to as the dynamic viscosity. During the test, the rotational speed of the rotor immersed in the oil (which is first cooled down to −30°C) was measured. The result of the measurement was compared to the reference curve representing the relationship between the rotational speed of the rotor and the cranking viscosity of the reference oils at the same temperature. According to the SAE J300-2013 classification, cranking viscosity at −30°C should not exceed 6600 mPa·s.

The workstation where the dynamic viscosity (CCS) with the use of cold cranking simulator was measured; Department of Performance Testing, Oil and Gas Institute in Kraków.
Oil condition monitoring is generally assessed using multiple parameters. All of the crucial parameters such as kinematic viscosity, 20 total acid number (TAN), 21 total base number (TBN), 22 nitration, oxidation, sulphation, dynamic viscosity (HTHS), 23 content of elements and foam 24 were measured in the course of the study. Cranking viscosity is one of the several indicators of oil degradation which have been analysed. However, due to the fact that the research material obtained was very extensive, the changes in the abovementioned parameters have been presented and discussed in other papers that either have already been published20–24 or are currently being reviewed.
The repeatability of the test equipment was on the level of ±5.4%, and its reproducibility on the level of ±8.9%; the measurement uncertainty determined for the results obtained at the Oil and Gas Institute in Kraków was at the level of 6.4%. All of the measurements were made in triplicate and the outcomes were statistically analysed using the Statistica 10 software. Initially, a linear regression model estimated with a maximum likelihood method, within the scope of a so-called generalised method of least squares, was adjusted to the data. The application of that particular method enabled the inclusion of the theoretically justified assumption on the interconnection of the measurements, subsequent in time, of the parameters of oil coming from the same vehicle in the estimation process. This assumption was introduced by accepting that the random component in the regression model is subject to a continuous autoregressive process of the first order. However, in the course of further research, and as a result of the sensitivity analysis, it was shown that the application of the aforementioned advanced statistical apparatus minimally changed the analysis results in relation to the classical model of normal linear regression. Consequently, a classic method of least squares was applied in order to facilitate presentation of the results and their interpretation.
Research results: presentation and analysis
All of the engine oils tested belonged to the same viscosity class 5W-30. According to SAE J300-2013, low-temperature cranking viscosity (−30°C) should be maximum 6600 mPa·s. The fresh oils tested have all met this requirement: cranking viscosity of MS oil was on the level of 6150 mPa·s, of CE oil – 6025 mPa·s, of PS oil – 5850 mPa·s, of ME oil – 5425 mPa·s and of PE oil – 4400 mPa·s. The difference between extreme values (MS and PE) reached 28% and may result from differences in formulation and/or different additives used in the engine oil manufacturing process. Some of the oils tested also varied in terms of their ACEA and API classes. However, despite those differences, all of the oils tested met the specifications put forth by the engine manufacturer. Changes in cranking viscosity of engine oils tested at −30°C with CCS are presented in Figure 3.

Changes in dynamic viscosity of engine oils tested at −30°C, cold cranking simulator (CCS).
As expected, the oils showed a growing trend with increasing mileage. In all of the cases, there was a visible intensification of changes with the number of kilometres travelled. These changes occurred with similar intensity ‘within’ the oil groups studied; yet, differences between the oil groups can also be noticed. The biggest increase in the cranking viscosity over the initial value was observed for oils: PE (an increase of 78%, PE 018689 at the mileage of 15,551 km) and MS (a 70% increase, MS 018817 at the mileage of 13,877 km).
In the first measurement period (first quarter), the viscosity increased from about 6%, for oils from the ME group, up to about 20%, for oils from the PE group. The other investigated oils (CE, MS and PE groups) showed a viscosity increase of about 17%. Completely different results were obtained in the second measurement period – there was a noticeable slowdown in the degradation process for all engine oils tested. Viscosity increases during that period were low, even a decrease in the viscosity value was observed for some oils in relation to the previous measurement period. This can be explained by a change in the atmospheric conditions in which the cars were operated. The second sampling was performed towards the end of January/the beginning of February 2013, which means that the cars had been used during the winter months (November, December and January). In subsequent measurement periods, the observed changes in oil viscosity were similar to the first period. The differences found in oil groups can be explained by varying numbers of kilometres travelled by individual vehicles in each quarter. It is worth mentioning that the engine oils PS 018193 and CE 017977 operated under different conditions than all of the other oils tested. In the first period, no viscosity changes were observed for them, whereas in subsequent periods, the changes had similar intensity. The increments observed in the final measurement period were lower in this group of oils than for its counterparts operated under harsh conditions (22% and 30%, respectively). However, the increases in all other oil groups were on the level of 58%. Thus, it can be argued that operating conditions have a strong influence on cold cranking viscosity changes. During typical mixed operation (urban/non-urban), the changes in cold cranking viscosity are smaller, whereas typical urban conditions significantly accelerate and intensify the changes in cranking viscosity. Taking into account the special requirements that should be met, especially in terms of the cold start of the engine (where oil supply to all friction contacts is required) and also regular operation at low temperatures, the relatively low viscosities at low temperatures should be the dominant feature. An increase in the viscosity of about 60%–70% in relation to the initial value poses a potential risk, especially as regards proper lubrication in low-temperature starting conditions. This is especially true for new cars with a low degree of wear, where the clearances are relatively small and a high-viscosity oil will have problems with proper lubrication of friction pairs.
Table 2 presents detailed specifications of all tested engine oils in particular measurement periods. The significance level was set to 0.05. Below this value, the achieved results were appraised as statistically important (these values were highlighted in bold). p values lower than 0.01 were perceived as highly important (these values are underlined and in bold).
The mean values, standard deviations and p values* after specific periods of measurement.

Note. Below the value 0.05, the achieved results were appraised as statistically important (these values were highlighted in bold). p values lower than 0.01 were perceived as highly important (these values are underlined and in bold).
p value resulting from the application of Student’s t-test for independent samples.
When analysing the individual variables (listed in Table 2) after the first quarter, it was found that the largest number of statistically significant differences between the mean values was in the pairs with PE and ME oils. The other oils (CE, MS and PS) can be considered homogeneous in terms of their cranking viscosity. The analysis of the variable – vehicle mileage – does not show any statistically significant differences. After the first quarter, the most homogeneous oils turned out to be ME with PS, then PE with PS and CE with MS. However, the biggest differences were found in the following pairs: PE with MS, MS with ME and MS with PS. After the second measurement period, statistically significant differences were detected between the arithmetic mean values of the pairs: CE and ME, CE and PE, ME and MS, ME and PS, PE and MS, PE and PS. After half a year, the most homogeneous in terms of the analysed variables were the oil pairs: MS and CE, CE and PS, MS and PS. For the variable – vehicle mileage, it was observed that the CE and PS oils were the only ones that had statistically significant differences (p = 0.007); their average mileage in the second study period was approximately 3500 and 4100 km, respectively. This is a statistically significant but essentially unimportant result. The CE and PS are the two oils for which the standard deviation of the mileage is very low (about 200 km, for the other three oils the standard deviation is greater than 1000 km). This proves a high homogeneity of the mileages of the vehicles equipped with these oils. After the last two quarters, the analysis of the variable – cranking viscosity – brought the conclusion that there were no statistically significant differences among the following pairs of oils: CE and MS, CE and PS, ME and PE, MS and PS.
Referring to Table 3, the investigated cranking viscosity of ME, MS and PE oils shows statistically significant disparities between the second and the third period and between the third and the fourth, which could potentially point to an acceleration of the upwards trend for the mean values of these parameters. For oil groups CE and PS, only the differences between the intermediate periods are statistically significant, which may indicate a slowdown in the upwards trend. However, it should be noted that in the case of the PS oil, compared to the third quarter, the average differences are almost statistically significant (p = 0.052).
The mean values, standard deviations and p values* for dynamic viscosity.

Note. Below the value 0.05, the achieved results were appraised as statistically important (these values were highlighted in bold). p values lower than 0.01 were perceived as highly important (these values are underlined and in bold).
p value resulting from the application of Student’s t-test for independent samples.
In order to obtain the full picture of oil and engine status, parameters such as kinematic viscosity, HTHS, TAN, TBN, oxidation, nitration and wear debris content were also measured. The research material obtained is very extensive, that is why in this place, only the most important findings discussed in other papers are highlighted: the curves of kinematic viscosity changes in oil samples CE, MS and PE are of similar shape, and in these groups, after 12 months, relative to the kinematic viscosity of fresh oil, they increased by 20%, 16% and 27% (temperature of 40°C) and 11%, 5% and 12% (temperature of 100°C), respectively. In the case of two oils – ME and PS – an initial decrease in the viscosity from baseline level up to the mileage of about 10,000 km was observed, then the viscosity started to increase. 20 The HTHS viscosity in the oil groups after 12 months, relative to the HTHS viscosity of fresh oil, increased by ca. 10%. Four out of five types of oils, that is, CE, ME, MS and PE, from the start of the test, showed a similar falling tendency of the base number in relation to the starting value. 23 A sharp decrease was observed up to ca. 8000 km, upon which the changes progressed more slowly; at the same time, the diagram was taking on the nature of the exponential function. In the case of PS group of oils, it was observed that changes occurring each time had, in approximation, a linear nature. All of the samples in this group showed the largest decrease in TBN, that is, 70% for oil samples PS 018149 and PS 018799. The smallest decrease in the base number was noted for oils in the MS group – the mean in this group was 50%. 22 The acid number, which for fresh oils ranged from 1.29 to 1.78 mg KOH/g, increased significantly over the entire operating period. Each time the changes occurred, they were of approximately linear character. The greatest increase – above 6.6 mg KOH/g – in the acid number relative to the initial value was observed for the following oils: MS 018361, PS 018784, PE 018689 and MS 018817. 21
Modelling alterations in the values of engine oil parameters
The first stage of modelling dynamic viscosity was marked by defining the acceptable limit value;25,26 then, for each oil, on the basis of the gathered empirical material, an evaluation of the relationships between the mileage values and the alterations in oil parameter values was conducted. It was inferred that the linear relationship would be suitable.
Table 4 presents the results of the estimations in which the absolute terms values (A) and slope coefficients (B) were calculated. Probability test for the hypotheses proclaiming slope coefficients’ value equal to 0 (p) and the residual standard deviations (Se) were also determined.
The results of the estimation of linear regression model for dynamic viscosity.

All of the obtained coefficients were significantly different from zero (all of p < 0.05), which means that the relationships between the mileage and the parameters tested were statistically significant. The value of slope coefficient can be interpreted as the average change in the tested parameter after the mileage increase of 1000 km. Thus, a positive slope means an increase and a negative slope means a decrease in the corresponding parameters along with the number of kilometres travelled. The estimated regression equation in Y = A + B * X makes it possible to calculate point predictions of average parameter values (Y) for any given mileage (X). The A and B values for each parameter are shown in Table 4. However, it should be noted that the range of applicability of the linear model is not much broader than the range of variability of the explanatory variable (car mileage in this case). This means that predictions calculated for out-of-range data (>16,000 km) are potentially subject to large errors. This is due to the fact that the adopted linear model did not cater for the out-of-range values of the analysed parameters.
Figure 4 presents the collected empirical data and point predictions for the mileage in the range of 0–16,000 km (curve P). Point prediction, like any other estimate based on empirical data, is burdened with a standard error. The curves defining the limits of 95% of prediction intervals (curve Pd and Pg) are also included in the graphs to show the estimated error rate. The graphs also present black-dotted horizontal straight lines which are the assumed limit values (G). At the intersection point of the line P with line G, the values of the mileage for which the average parameter value exceeds the limit value can be read, and this is a so-called reverse predicate. The mileage values read as intersection points of line G with lines Pd and Pg determine the 95% confidence interval (also called the calibration interval) for the value of the mileage in terms of which the limit value for the hypothetical individual measurement of the parameter is exceeded.

Single point predictions and empirical data of mileage in the range of 0–16,000 km (dynamic viscosity).
The kinetics of changes in oil viscosity is reflected by an increasing function and its absolute values going up with the rise in mileage. The slope gradient of the line (P) (Figure 5), which reflects the rate of viscosity changes, may suggest that they (viscosity changes) varied for all oil groups.

Lines P (single point predictive) and their gradients for all groups of engine oils tested.
The largest gradient (0.3058) was observed in MS oil group, and the smallest (0.1993) was observed in ME oil group. The entire research was thus planned so as to ensure that all of the oils tested were operated in vehicles of the same type, over the same period and under the same operating conditions. Therefore, assuming that these factors had a limited effect on changes in cranking viscosity, it can be concluded that the differences in viscosity changes during operation result from the types of additives used by oil producers.
Analysing point predictions for the mileages in the range of 0–16,000 km and the cranking viscosity parameter (–30°C) (Figure 4), it was found that in all analysed cases, there was a dangerously rapid increase in the cranking viscosity, and the limits were very quickly exceeded, causing the transition to the next viscosity class.
The greatest intensification of changes with respect to the mileage was recorded for MS, CE and PS oils. The oils from MS group exceed the limit value at the mileage of 3000 km, and it is also in this group for which (after nearly 15,000 km travelled) the cranking viscosity exceeds the limit of 10,000 mPa·s. However, the CE and PS oils exceed the limit value after 4000 and 5000 km, respectively, and reach the viscosity of over 9000 mPa·s at over 15,000 km. In the group of PE oils, the cranking viscosity, despite the high percentage increase after 15,000 km travelled, remains on one of the lowest levels when compared with other oils and the limit value is exceeded after 13,000 km. This is due to the lowest viscosity of fresh PE oil (4400 mPa·s). Likewise, it appears to be in the group of ME oils, where the cranking viscosity of fresh oil is higher by 1050 mPa·s when compared with the PE oil, and after 15,000 km, it maintains comparable levels to the oils of that group.
Therefore, when choosing engine oils, especially for vehicles used in urban driving conditions, those with the lowest cold cranking viscosity should be selected; because even in the face of changes, the viscosity will stay below the limits thus ensuring proper lubrication in cold starts. Oils with cold cranking viscosity close to the maximum value in a given viscosity class relatively quickly exceed the limit value exposing the engine to accelerated wear.
When it comes to the cranking viscosity, regular increases have been recorded from the beginning of the test, and as a result, predictions for more kilometres travelled than examined in the study can be burdened with a relatively low standard error (except for the ME oils whose prediction range is the widest). Based on the results shown, the likelihood of choosing a better engine oil in the winter may be increased, thus improving the engine’s ability to cold start and protecting it from excessive wear or damage.
Conclusion
To recapitulate, the measured cranking viscosity of fresh oils selected for testing was as follows: MS – 6150 mPa·s, CE – 6025 mPa·s, PS – 5850 mPa·s, ME – 5425 mPa·s and PE – 4400 mPa·s. The difference between extreme values (MS and PE) reached 28% and may result from differences in formulation and/or different additives (e.g. viscosity improvers) used in the engine oil manufacturing process – determining whether an additive package is depleted is difficult, largely because additive packages vary from one manufacturer to another. Some of the oils tested also varied in terms of their ACEA and API classes. Moreover, the gradients of prediction curves for individual oil groups (from 0.3058 for MS oils to 0.1993 for ME oils) seem to confirm that producers use different additives.
Operating conditions have a strong influence on the cold cranking viscosity changes. During typical mixed operation (urban/non-urban), the changes in cold cranking viscosity are ca. 50% smaller, whereas typical urban conditions significantly accelerate and intensify (nearly twice) the changes in cranking viscosity.
Statistical analysis confirmed the significance of viscosity changes in the oil pairs containing PE and ME oils. The other ones (CE, MS and PS) can be considered homogeneous in terms of the cranking viscosity. The obtained data allowed us to develop a statistical model using the basic mathematical model – a linear function. The model, based on the cranking viscosity changes (measured at −30°C) of engine oils under operating conditions, can be used to predict the performance of in-service oils, since an increase in the viscosity of about 60%–70% in relation to the initial value poses a potential risk, especially as regards proper lubrication in low-temperature starting conditions. This is especially true for new cars with a low degree of wear, where the clearances are relatively small and a high-viscosity oil will have problems with proper lubrication of friction pairs.
All analysed oil groups showed an upward trend in the dynamic viscosity at −30°C compared with the baseline value, and the sharpest increases (69%) were observed in the PE group, while the lowest in the ME group (36%). In all analysed cases, there was a dangerously rapid increase in the cranking viscosity, and the limits were very quickly exceeded (7000 mPa·s). The greatest intensification of changes with respect to the mileage was recorded for MS, CE and PS oils. The limit values were exceeded after 3000, 4000 and 5000 km, respectively. For the engines operating with these oils, it should be taken into account that a high viscosity of the cold oil may greatly hinder its spreading on the surfaces of the co-operating parts of the engine. Especially in winter, ME and PE oils might be a better option. In their case, the limit values were exceeded at 10,000 km (ME oils) and at 13,000 km (PE oils).
Based on the results, the likelihood of choosing a better engine oil in winter may be increased, thus improving the engine’s ability to cold start and protecting it from excessive wear or damage. However, it should be borne in mind that such conclusions relate only to one viscosity grade and the results presented only concern the 5W-30 viscosity class. Therefore, the research should be treated as a preliminary one, and the next stage would be to include other viscosity classes to confirm the observed changes and trends.
Footnotes
Acknowledgements
The authors thank the Director of the Oil and Gas Institute, Professor Maria Ciechanowska, PhD Eng., and acting as Deputy Director for Oil Technology, Wiesława Urzędowska, MSc, for the opportunity to perform the tests. All laboratory tests for this study were conducted at the Oil and Gas Institute in Kraków – the National Research Institute.
Handling Editor: Pietro Scandura
Declaration of conflicting interests
The author(s) declared no potential conflicts of interest with respect to the research, authorship and/or publication of this article.
Funding
The author(s) disclosed receipt of the following financial support for the research, authorship and/or publication of this article: The work was funded by appropriations of the Faculty of Commodity Science, Cracow University of Economics and Faculty of Production Engineering University of Life Sciences in Lublin within the framework of grants to maintain the research potential.