
Abstract
This article describes the processes of degradation of five engine oils belonging to the same SAE (Society of Automotive Engineers) viscosity class but launched by different manufacturers. The direction and intensity of changes in the total acid number have been analyzed. As part of the experiment, the changes in engine oils occurring during operation have been examined. The operating conditions throughout the test can be described as “severe,” that is, frequent starting of the engine, short distance driving, and extended engine idling. All engine oils were operated in passenger cars of a uniform fleet of 25 vehicles. The total acid number was determined in accordance with the ASTM D664. The obtained results have led to the development of a statistical model enabling to calculate average predictive values of the total acid number for a given mileage. The results may facilitate decision-making regarding the service life of engine oils.
Keywords
I. Introduction
Lubricating oils, and engine oils in particular, are adversely exposed to high temperatures under operating conditions. As a result of a combined effect of oxygen from the air and high temperatures on the oil, it becomes oxidized, which in turn leads to a partial decomposition of its components and to the polymerization and condensation of some of the products. Due to the aging processes, inert substances (primarily alcohols, aldehydes, esters, ketones, asphaltenes, resins) and acidic substances are formed, which cause corrosion and increased wear of metals. Among the acidic substances, engine oils may contain strong organic and inorganic acids which are both residues of in-process intermediates or inorganic acids from the oxidation of the components of the operating fluid. Acidic substances, when reacting with metals, form salts which are responsible for the formation of sludge in the lubricating oil systems. Engine oils may also contain some weak organic acids which are minor products of oxidation occurring during manufacturing processes or derived from the additives used, from the oxidation of operating fluid during its use and/or from microbiological processes. Potential effects of an increase in the acid number include a decrease in the base number, initiation and intensification of the oil degradation processes, corrosion of the metal parts of the engine, an increase in the oil density, or depletion of the engine oil treatment package.
According to the current state of knowledge, engine oil quality can be determined by a number of tests that include laboratory physicochemical evaluation as well as performance evaluation after long-term and costly operational tests.1–6 The concept, the means, and methods of measuring engine oil quality based on the total acid number (TAN) changes have been extensively studied by many researchers. De Rivas et al. 7 built predictive models to determine the TAN using IR (Infrared radiation) data measured from ash-less dispersant oils developed for aviation piston engines. They used various techniques, including Projection Pursuit Regression, Partial Least Square, Support Vector Machines, Liner Models, and Random Forest. Bassbasi et al. 3 also proposed infrared spectroscopy for monitoring and control and for quick inspection of engine oils. Wang 8 examined oil condition sensor and sensing technique. The newly designed sensors were installed in three vehicles and tested on the road. The test results indicated that the degradation of engine oil may be divided into three stages: (1) good, (2) rapid increase of the TAN, and (3) rapid increase of viscosity. Agoston et al., 1 in turn, focused on the process of thermal aging in their studies. They showed that such factors as partial oil evaporation or its combustion have an important impact on oil aging. All these processes eventually lead to the point at which lubricating oil no longer has the suitable properties necessary for it to perform its functions. In his paper, Kauffman 9 described the development of the rapid antioxidant capacity screening, TAN, and total base number (TBN) techniques based on voltammetry. The results presented in Kauffman 9 demonstrate that a combined knowledge of the antioxidant/TAN/TBN measurements strongly improve the evaluation of the remaining useful life of the tested fluid, as well as the condition of the operating equipment. The TAN is obviously an important oil condition parameter to monitor,7,10 but an unambiguous, rapid, practical, and reliable means of measuring this parameter is still lacking; therefore, the aim of the conducted studies was to verify the direction and intensity of changes in the TAN of engine oils occurring during the use. The obtained dependencies allowed us to elaborate a statistical model describing these particular ones which can be used for predicting engine oil behavior during its use. The model may also help us to understand the specific characteristics of engine oils and can contribute to the development of quality monitoring systems throughout the life cycle of the engine.
II. Research material
The research material included five engine oils of the same viscosity grade acc. to SAE (Society of Automotive Engineers) and produced by different manufacturers. The oils were coded as CE, MS, ME, PS, and PE, and the specifications of these oils are presented in Table 1. The oils were used in cars comprising of a uniform fleet of 25 vehicles. These cars were equipped with petrol engines with the cubic capacity of 1332 cm2.
Quality and viscosity classifications of the engine oils selected to the research.
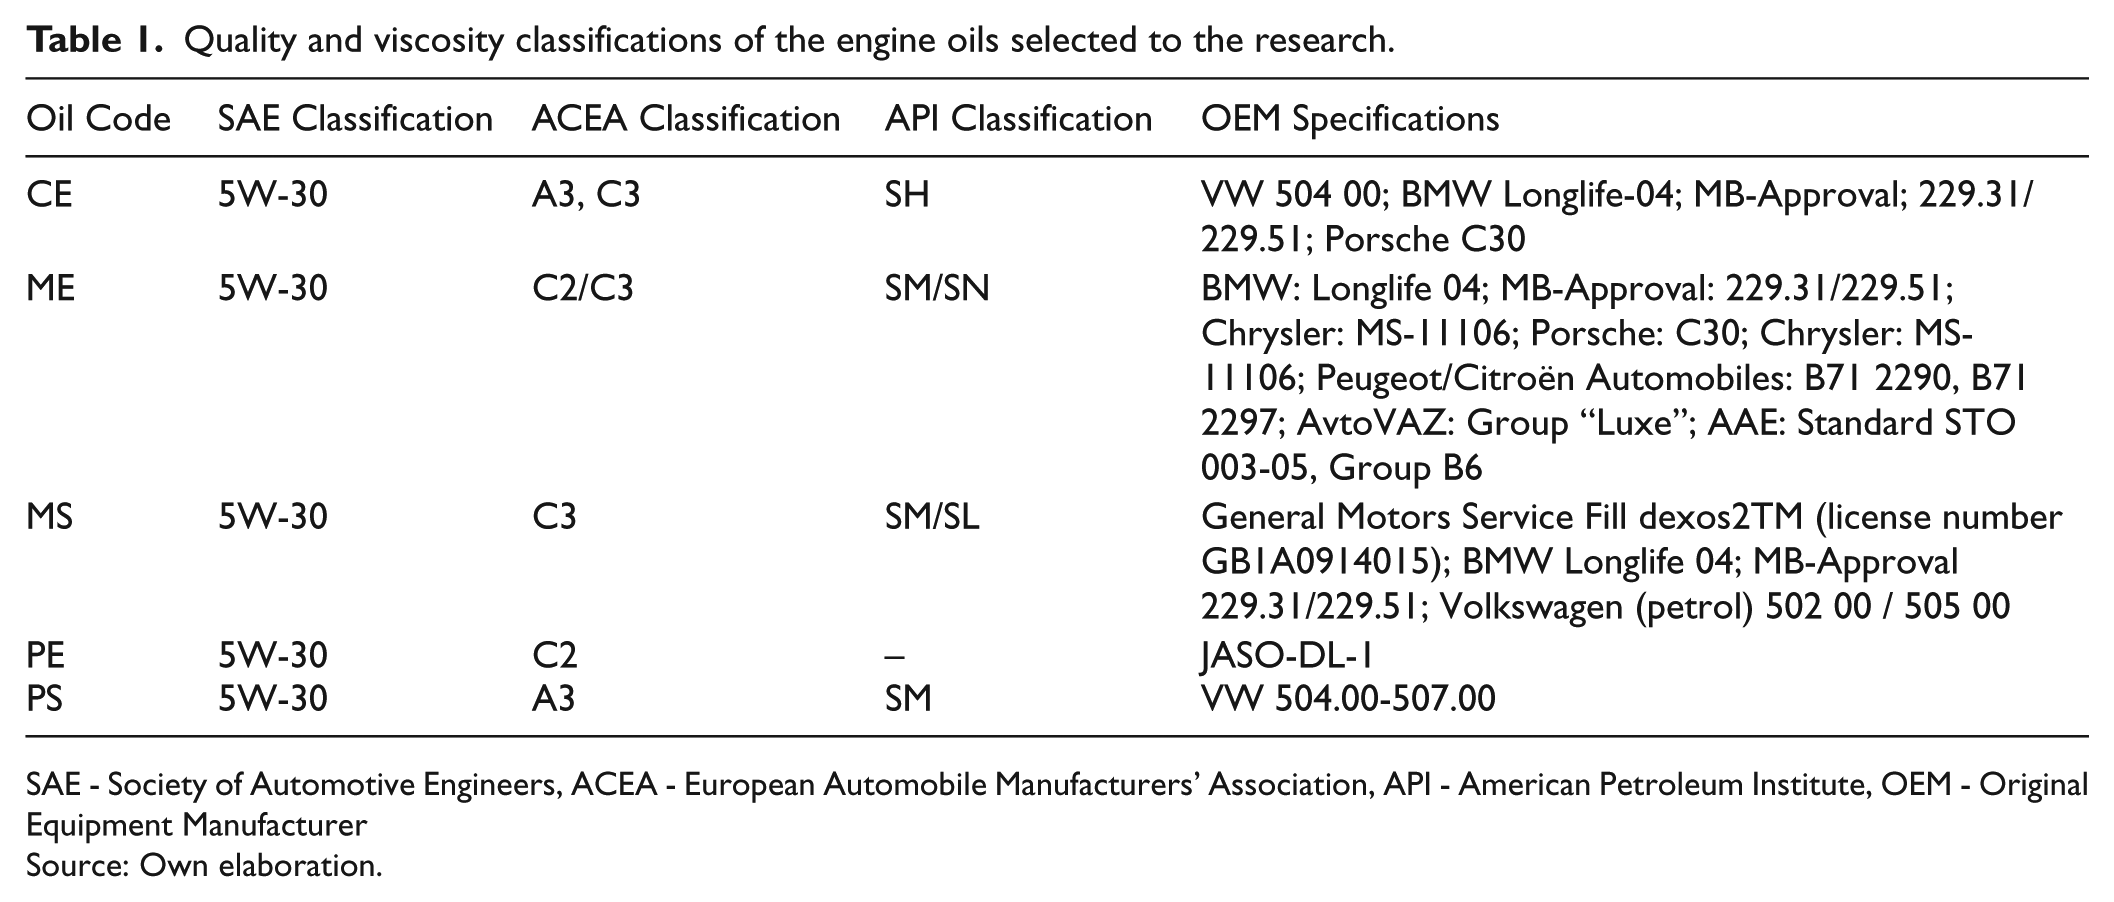
SAE - Society of Automotive Engineers, ACEA - European Automobile Manufacturers’ Association, API - American Petroleum Institute, OEM - Original Equipment Manufacturer
Source: Own elaboration.
The vehicles in the research were divided into two groups. The first group of 23 vehicles was used in the conditions which can be defined as “severe,” that is, frequent starting of the engine, short distance driving, and extended engine idling. The second group of two cars (PS018193 and CE017977) was operated in typical urban driving and mixed conditions. A visual presentation of the results, with both groups of engine oils included, can be found below. It should be noted, however, that the second group of vehicles was excluded from the statistical analyses, since those cars did not meet the prerequisite of being operated under similar conditions. Both groups of vehicles were fueled up by petrol coming from the same source. Each of the oils was randomly applied into five cars.
Oil sampling is of significant importance in this type of studies because all samples must be first and foremost representative, hence, the need for correct and regular sample collection procedure as well as establishing appropriate sampling frequency. Due to the problems with regular collection of the samples after a certain number of kilometers traveled, a specific period of time was selected at which the sampling would be performed. For the purposes of the study, the sampling frequency was established on the quarterly basis. At the start of the test, a sample of fresh oil was tested, then the oil samples were taken after 3, 6, 9, and 12 months. In the 3rd and 6th month, there were 25 oil samples taken, whereas in the 9th and 12th month, 23 samples (due to the decommissioning of two vehicles). In total, 96 samples were taken within 12 months. Table 2 presents the information on the number of kilometers traveled by each of the cars tested. The sample code is a combination of the oil code and the car code number.
The number of kilometers traveled by each car.
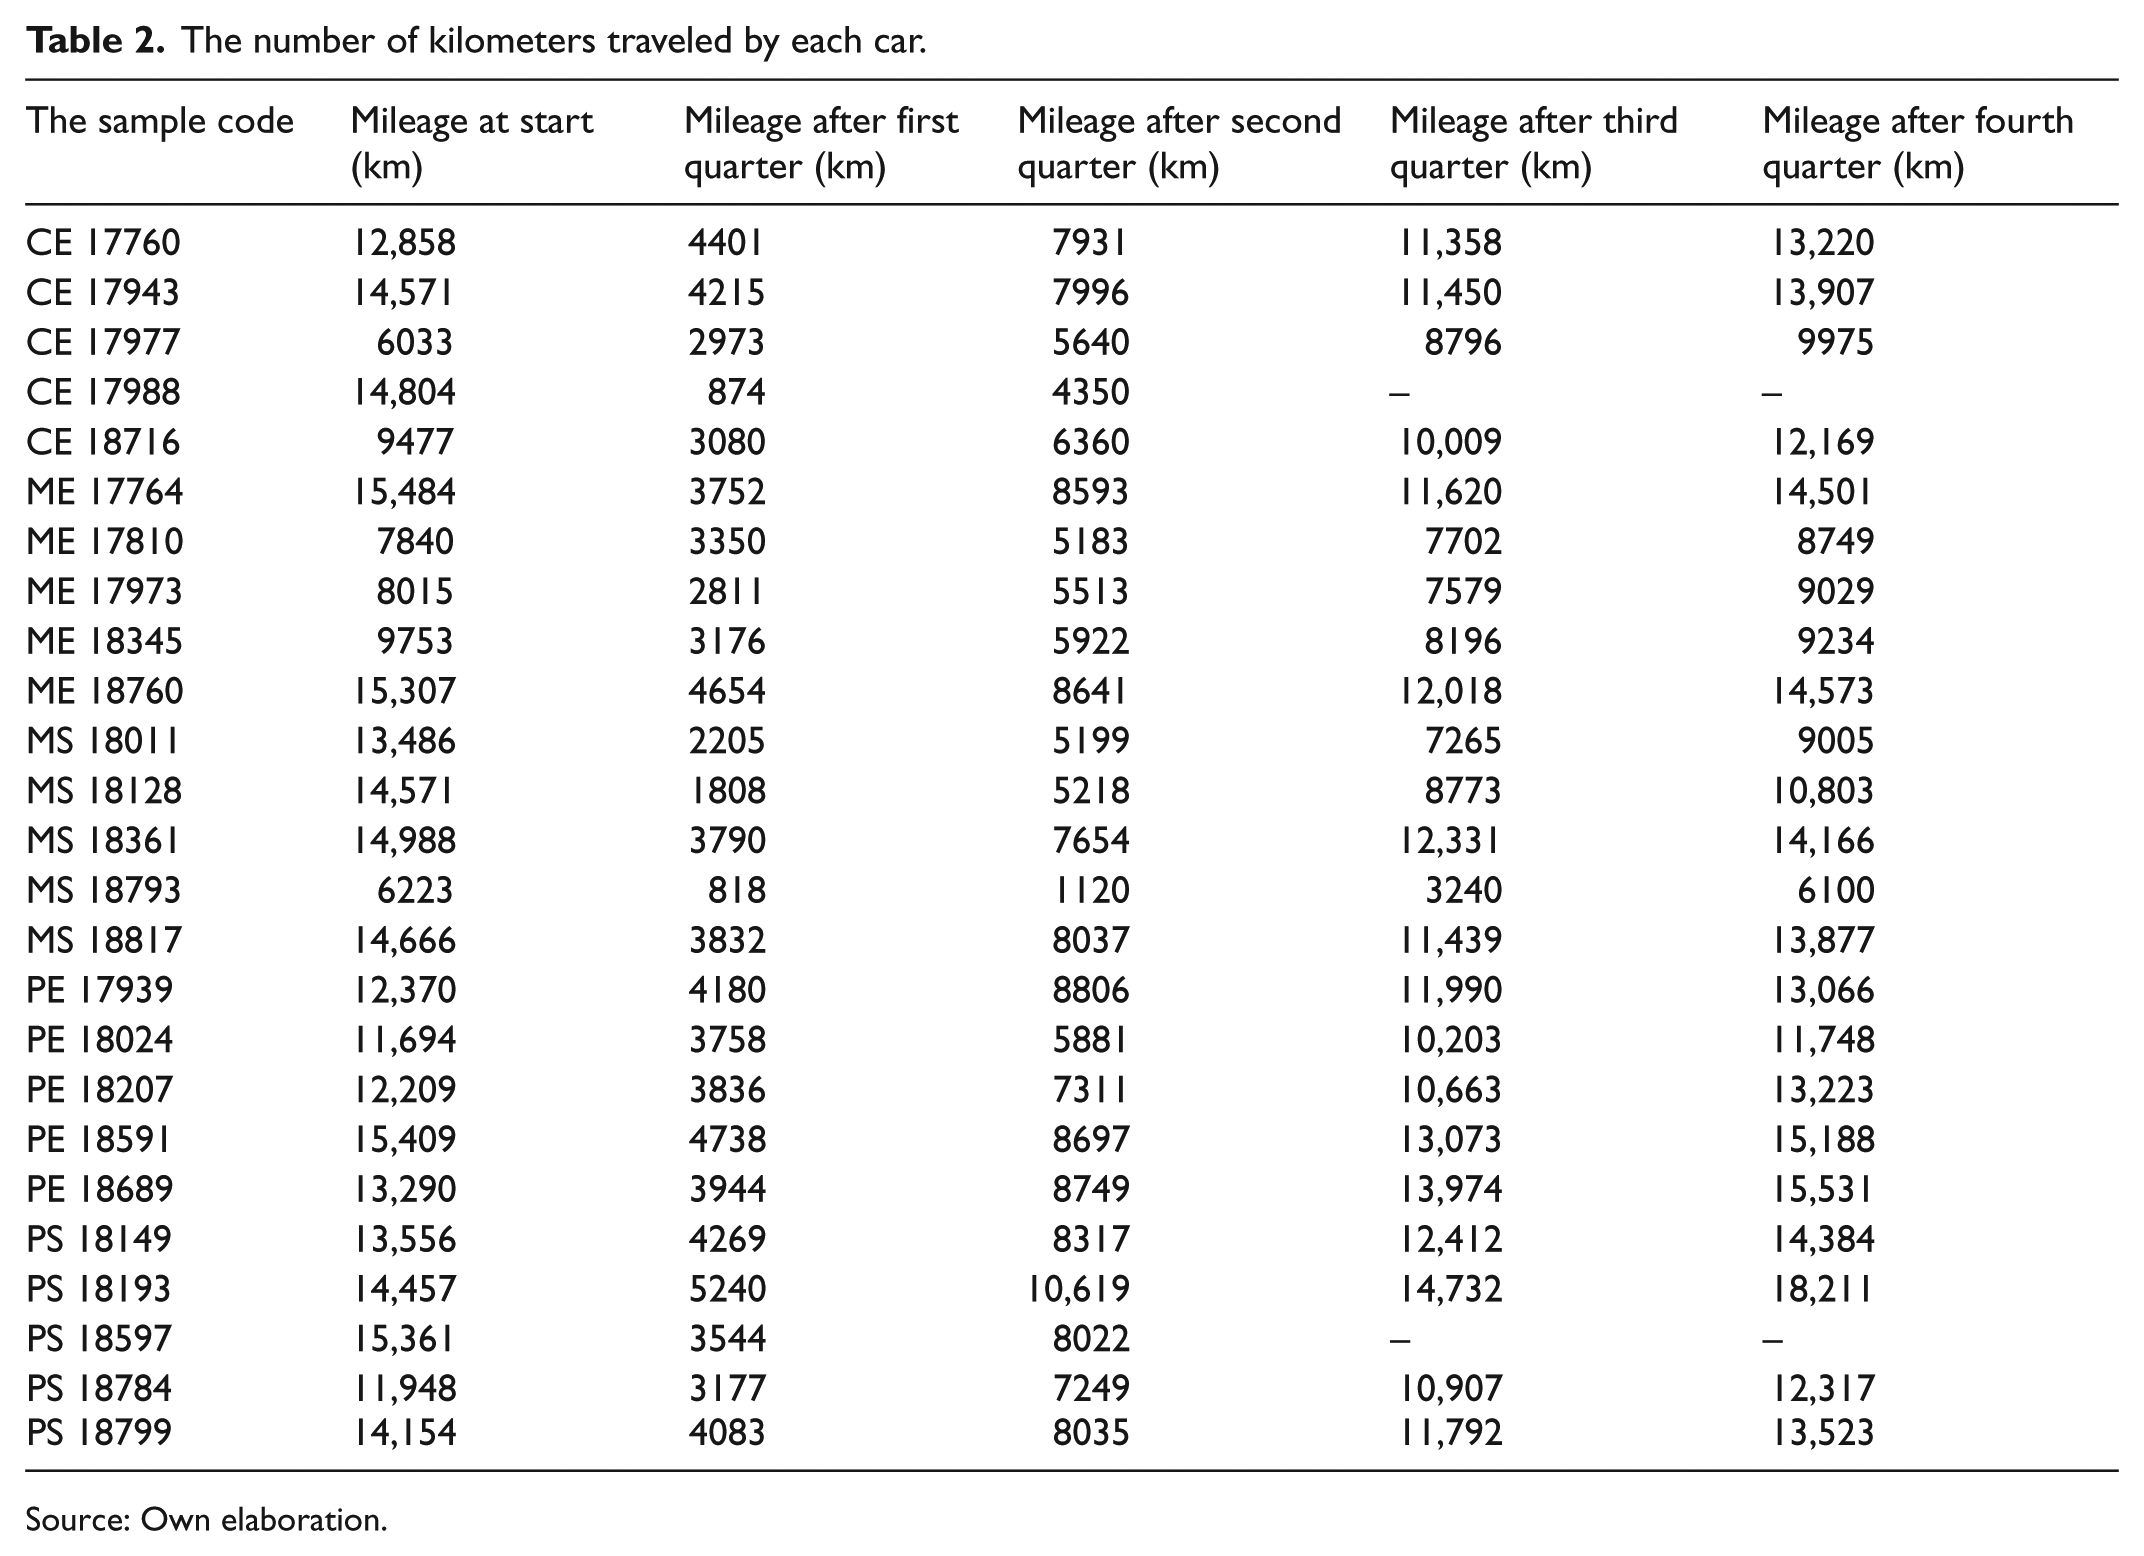
Source: Own elaboration.
III. Research methodology
The determination of the acid number (the number of milligrams of potassium hydroxide required to neutralize all acidic components contained in 1 g of the test product) consisted of titrating the solution of the weighed amount of test substance in the solvent containing the indicator. A solution containing toluene, isopropyl alcohol, and water was used as a solvent. Titration was done with standard alcoholic potassium hydroxide solution, potentiometrically and with indicators. The samples collected in the first quarter were measured by titration to indicators, but with the kilometers traveled, oil color prevented us from continuing with this method, and the acid number was then determined by potentiometric titration. 11
The total acid value was calculated according to the formula
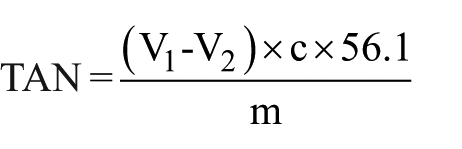
where V1 is the volume of alcoholic potassium hydroxide solution with c(KOH) = 0.1 mol/L, used for titration of the product sample, mL; V2 is the volume of alcoholic potassium hydroxide solution with c(KOH) = 0.1 mol/L, used for titration of the blank sample, mL; c is the molar concentration of KOH in alcoholic potassium hydroxide solution; 56.1 is the molecular weight of potassium hydroxide; and m is the mass of the sample taken (analytical sample), g.
All measurements were repeated three times and the results were statistically analyzed using the Statistica 10 software. Initially, a linear regression model estimated with a maximum likelihood method, within the scope of a so-called generalized method of least squares, was adjusted to the data. The use of that method made it possible to include theoretically valid assumptions concerning the existence of correlation between a number of consecutive measurements of engine oil coming from the same vehicle. It was assumed that the random component in the regression model is subject to continuous process of the first-order auto-regression. However, in the course of further studies and as a result of the sensitivity analysis, it was shown that the application of the aforementioned advanced statistical apparatus minimally changed the analysis results in relation to the classical model of normal linear regression. Eventually, in order to simplify the presentation and to facilitate the interpretation of results, the models of linear regression were estimated with the use of classical least squares method.
IV. Presentation and analysis of study results
The results of TAN tests for the periods studied are presented visually in Figure 1. Each time the changes occurred, they were of approximately linear character. The acid number, which for fresh oils ranged from 1.29 to 1.78 mg KOH/g, increased significantly over the entire operating period. After the first quarter with a mileage of up to 4000 km, the greatest increase in the acid number was recorded for PE 017939 (an increase of 86%), ME 018345 (an increase of 72%), PE 018689 (an increase of 70%), and MS 018817 (an increase of 63%).
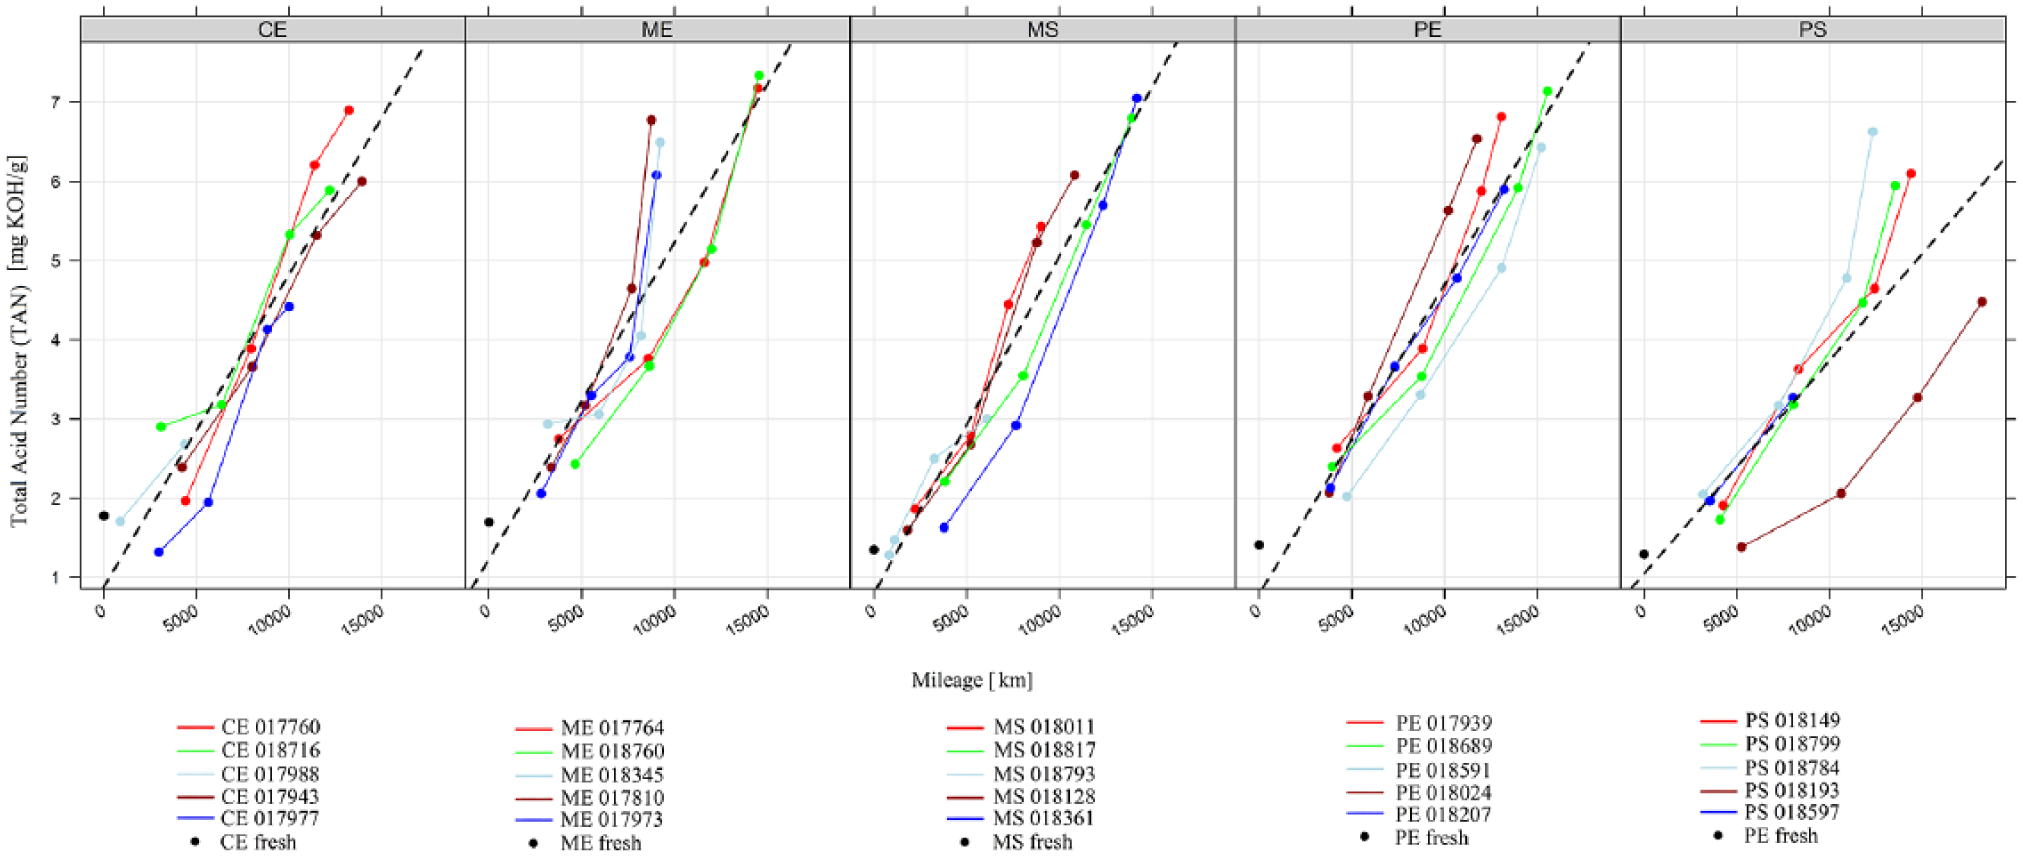
Changes in the TAN of engine oils
Two out of 25 cars were operated under “milder” conditions than others. One of them with the CE 017988 oil, within the first 3 months traveled only 874 km and showed a decrease in the acid number from 1.78 to 1.71 mg KOH/g. The second, with the MS 018793 oil, traveled 818 km and showed a decline from 1.35 to 1.28 mg KOH/g. Nevertheless, in the following three quarters, these values in both cases began to increase linearly and analogously to the others.
The second group of oils, that is, PS 018193 and CE 017977, deserve further analysis. It is clear that a modification in operating conditions affected the changes in the TAN. These oils maintained a lower TAN value of approximately 30% over the course of the operation compared to the oils from group 1 of vehicles.
In the case of CE, MS, and PE oils, the acid number increased proportionately to the mileage traveled throughout the service life. The changes in oil groups ME and PS were completely different. In their case, only the range (8000–12,000 km) was observed analogous to the CE, MS, and PE oil groups, whereas above this range, the intensification of the changes in the acid number was noted. As a result, with a small number of miles traveled, there is a much higher increase in the acid number than it is in the range of 8000–12,000 km.
The greatest increase in the acid number relative to the initial value was observed for the following oils: MS 018361 (an increase from 1.4 to 7.1 mg KOH/g, at 14,166 km traveled), PS 018784 (an increase from 1.3 to 6.6 mg KOH/g, at 12,317 km traveled), PE 018689 (an increase from 1.4 to 7.1 mg KOH/g, at 15,531 km traveled) and MS 018817 (an increase from 1.4 to 6.8 mg KOH/g, at 13,877 km traveled).
Such a large change in the acid number may be due to high operating temperatures (difficult operating conditions), excessive exhaust gases to the engine crankcase, or high sulfur content in the fuel.
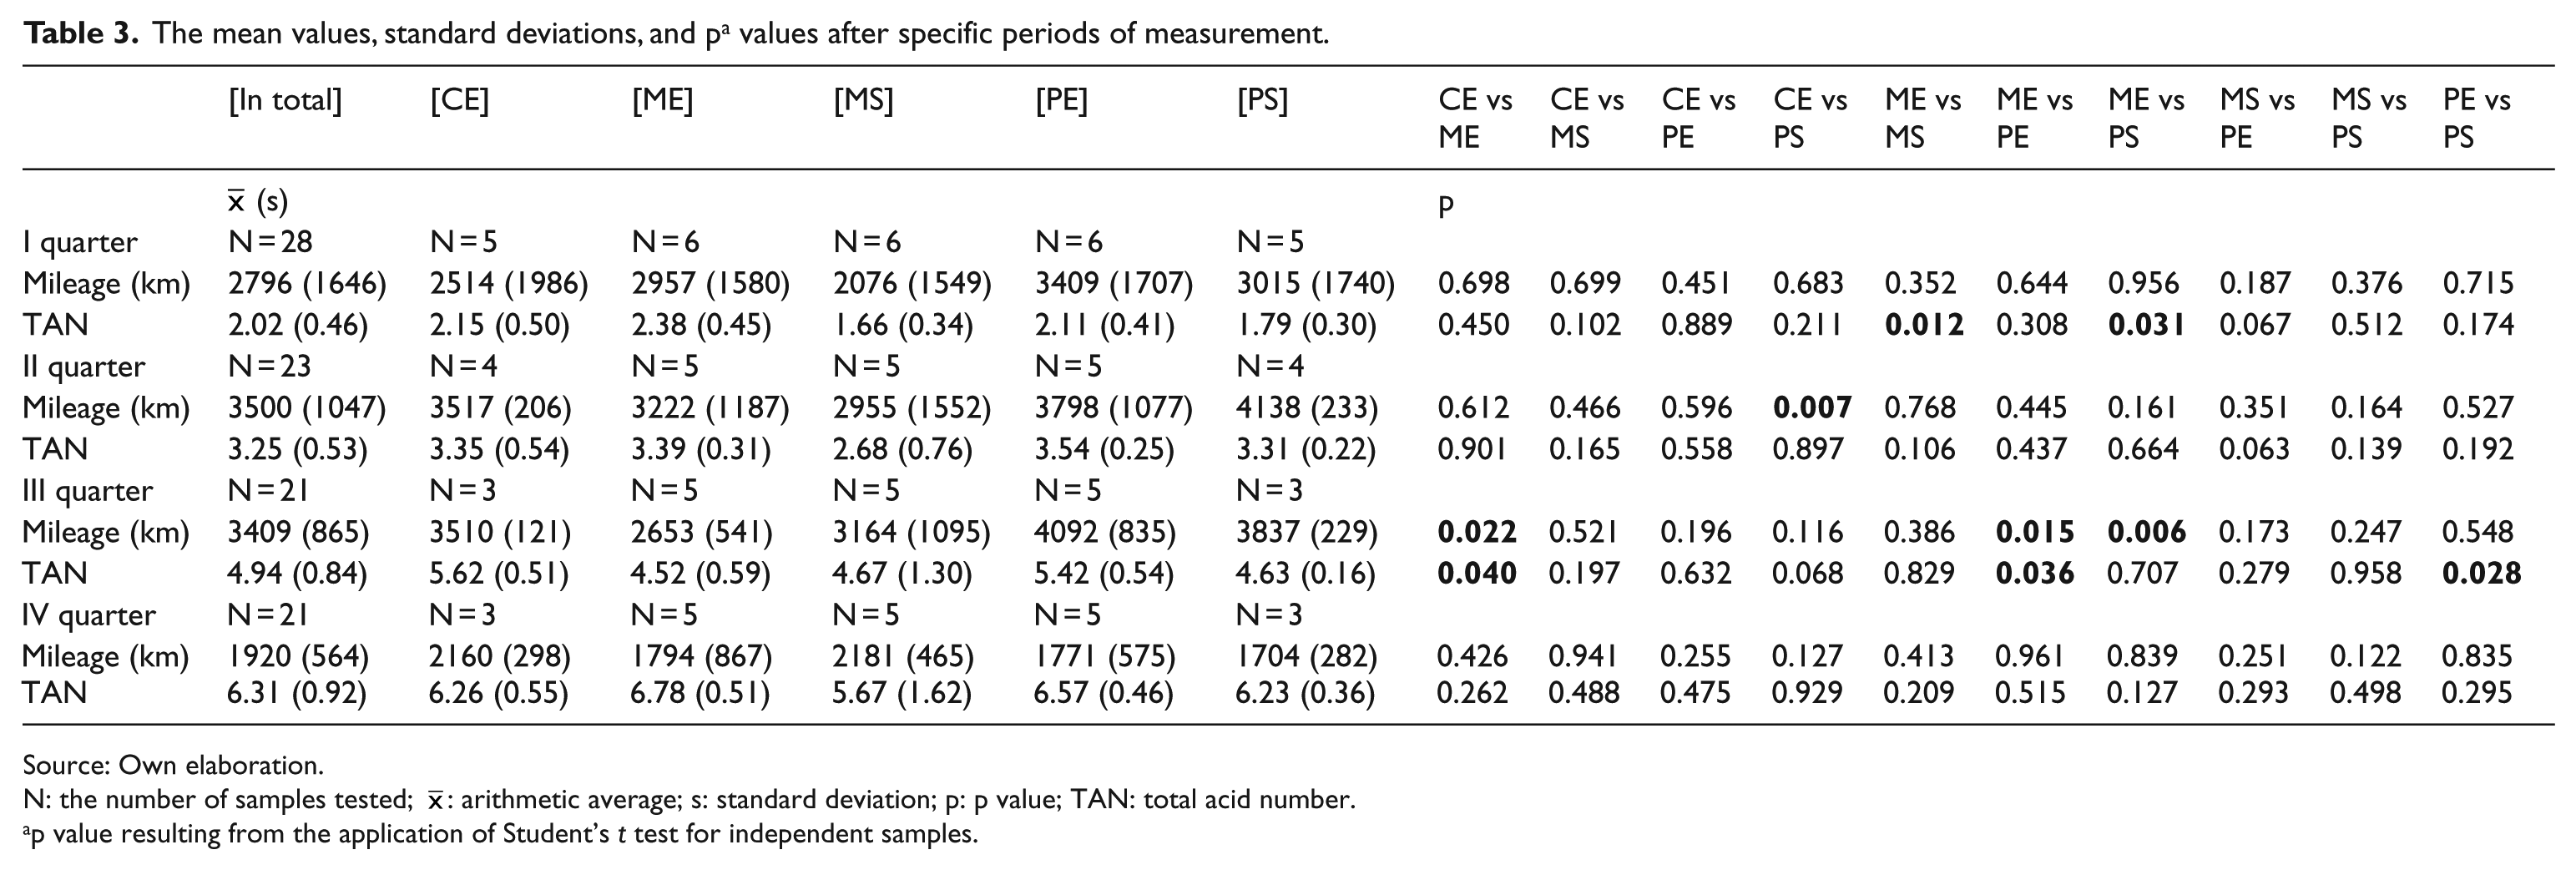
Table 3 presents the descriptive specifications of tested engine oils in particular measurement periods. The limit value of significance was set at 0.05. Below this value, the obtained results were deemed statistically important (these values were highlighted in bold). P values lower than 0.01 were considered highly important (these values are in bold and underlined).
The mean values, standard deviations, and p a values after specific periods of measurement.
Source: Own elaboration.
N: the number of samples tested;
p value resulting from the application of Student’s t test for independent samples.
When analyzing the individual variables listed in Table 3, it was found that after the first 3 months of operation, the highest number of statistically significant differences between the mean values was found for oils containing ME (ME with MS and ME with PS). The most homogeneous oils turned out to be CE with PE, then MS with PS, and CE with ME. The variable analysis—vehicle mileage—does not show any statistically significant differences.
After the second measurement period, in the case of the acid number, there is a great similarity between the oils tested. For the variable vehicle mileage, it was noted that the only statistically significant (p = 0.007) differences were in the CE and PS oil, with the average mileage in the second study period of approximately 3500 and 4100, respectively. This is a statistically significant but essentially unimportant result. Both CE and PS oils had a very low standard deviation (about 200 km, whereas for the other three oils, the standard deviation was over 1000 km), which proves a high homogeneity of the vehicles equipped with these oils.
After the third quarter, in the case of the variable acid number, it was observed that statistically significant differences in the mean values were found for pairs ME and PE and ME and CE at levels 0.036 and 0.04, respectively. The most homogeneous oils turned out to be MS with PS and ME with MS. After the last measurement period for both the mileage and the acid number, there were no statistically significant differences between the arithmetic mean values. The CE with PS oils remain at the highest level of homogeneity.
When analyzing all four measurement periods, the attention should be drawn to the fact that in the case of some variables (e.g. MS and PE), the comparisons almost reach the statistical value, suggesting potential existence of differences.
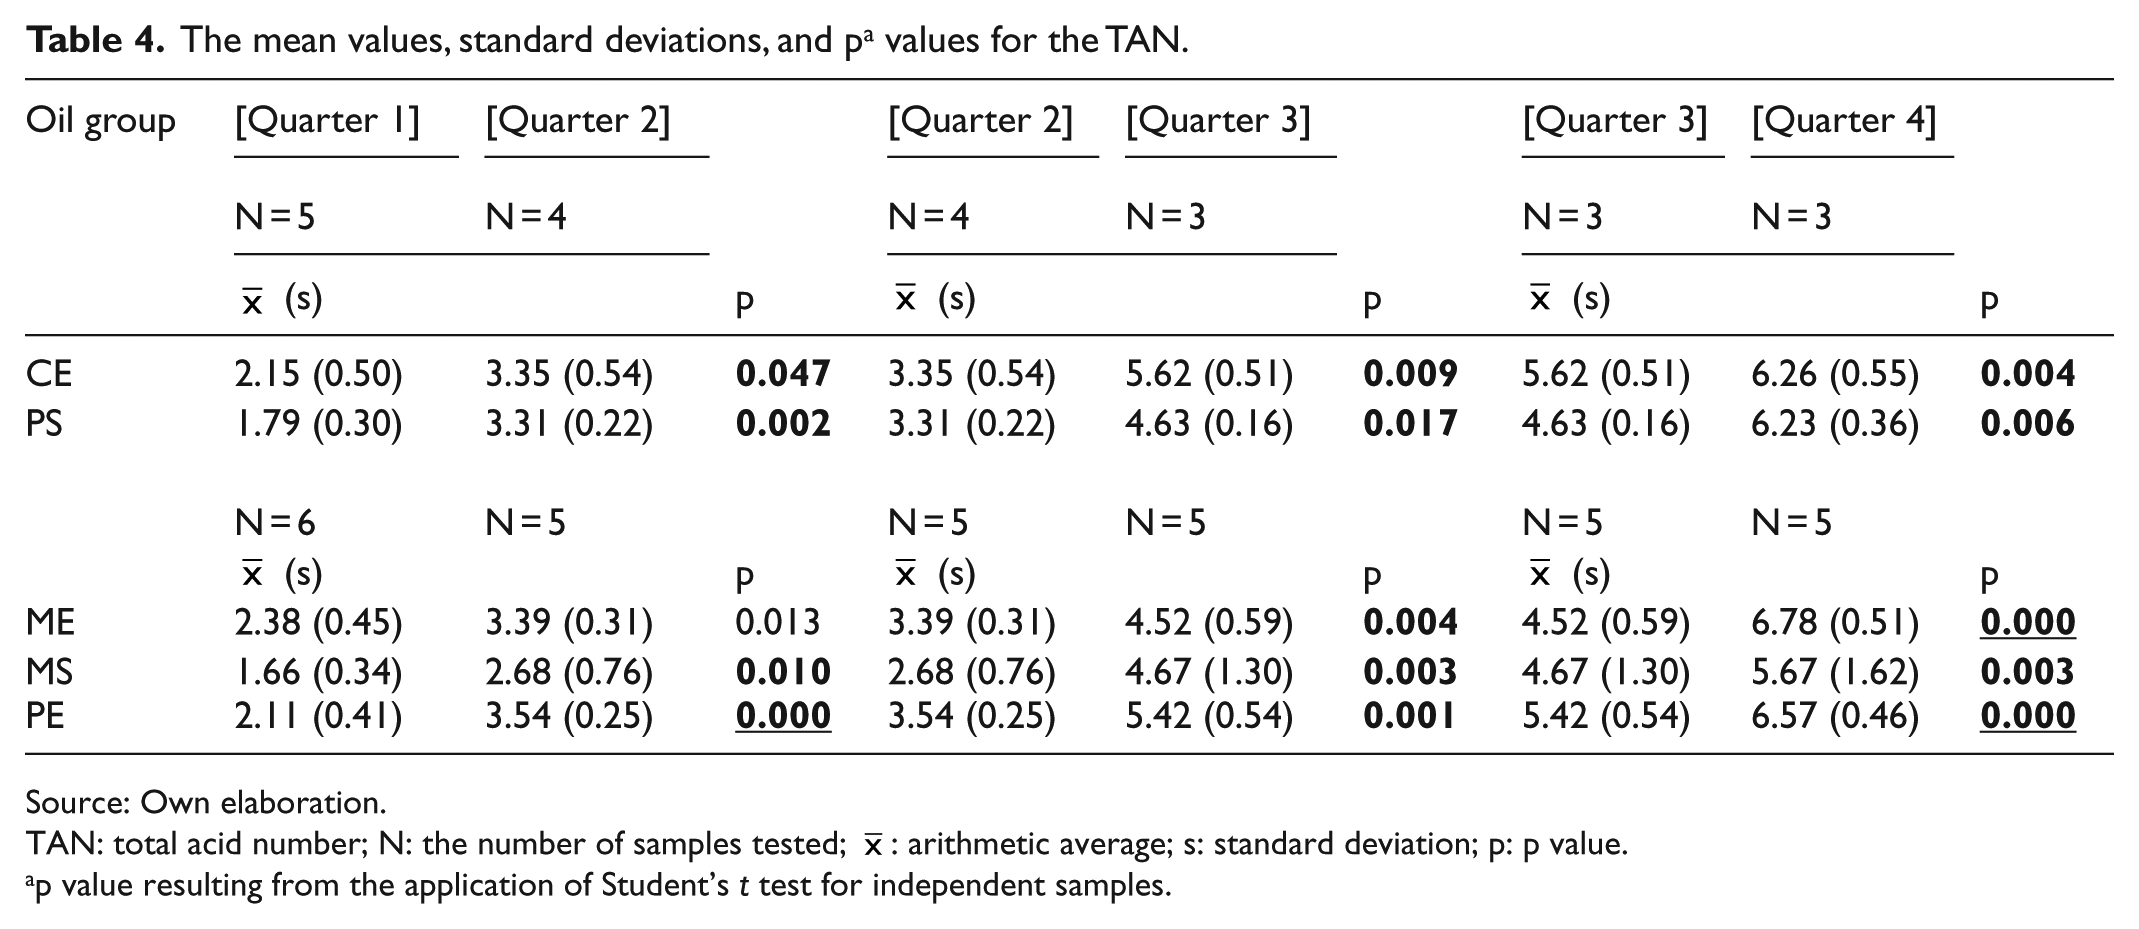
Analyzing Table 4, it can be stated that statistically important differences between the mean values occur in oil groups CE, PS, MS, and PE within the neighboring measurement periods.
The mean values, standard deviations, and p a values for the TAN.
Source: Own elaboration.
TAN: total acid number; N: the number of samples tested;
p value resulting from the application of Student’s t test for independent samples.
A different situation was observed in the ME oil group. The acid number for this oil group showed statistically significant differences between the second and the third period and between the third and the fourth. Only the differences in the first neighboring measurement period were not statistically significant, potentially indicating an acceleration of the upward trend for the mean values of these parameters.
V. Modeling changes in the values of engine oil parameters
At the first stage of modeling the changes in TAN, the acceptable limit value was determined;12,13 then, for each oil, on the basis of the collected empirical material, a visual evaluation of the relationships between the mileage and the changes in oil parameters was performed. It was assumed that the linear relationship was adequate.
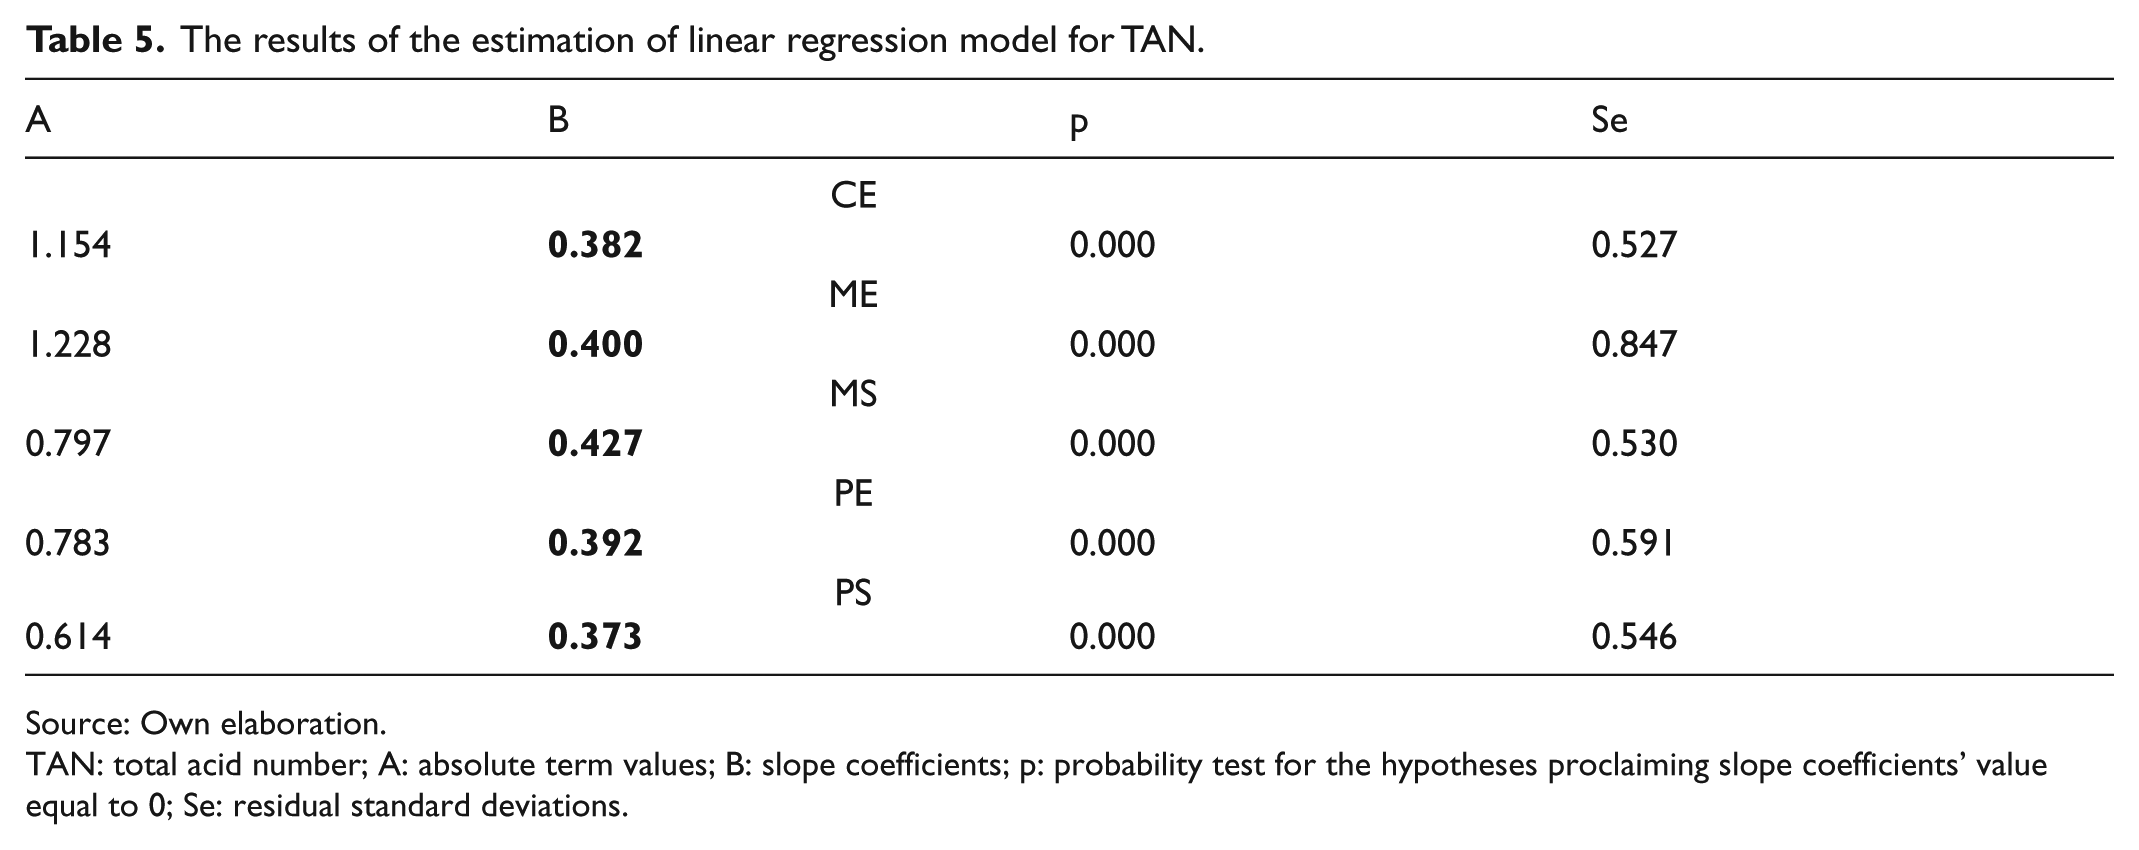
The results of all estimations are presented in Table 5, which specifies the absolute term values (A), slope coefficients (B), probability test for the hypotheses proclaiming slope coefficients’ value equal to 0 (p), and the residual standard deviations (Se).
The results of the estimation of linear regression model for TAN.
Source: Own elaboration.
TAN: total acid number; A: absolute term values; B: slope coefficients; p: probability test for the hypotheses proclaiming slope coefficients’ value equal to 0; Se: residual standard deviations.
It can be noticed that each of the ratings of slope coefficients was significantly different from zero (all p < 0.05). The slope coefficient indicates the expected (average) change of a given parameter with an increase in the mileage of 1000 km. Therefore, the positive slope coefficient indicates a positive relationship between the mileage and average parameter values, whereas the negative slope coefficient indicates a negative relationship between the mileage and average parameter values.
The estimated regression equation in the form of Y = A + B × X enables to calculate average predictive values for parameters (Y) and given mileage (X). The A and B values are presented in Table 5. These predictions are burdened with the lowest error within the observed mileage values, whereas the extrapolation, that is, performing a prediction for mileages much larger or smaller than these observed, can be burdened with a larger standard error since the form of the relation between the mileage and the tested parameter outside the field of data is not necessarily in the same form.
Empirical data and point prediction for the range of 0–16,000 km (central blue line) is presented in Figure 2. Point prediction, like any other estimate based on empirical data, is burdened with a standard error. The curves defining the limits of 95% of the prediction intervals (Pd and Pg curves) are also included in the graphs to quantify the estimated error rate. The graphs also show black dotted horizontal lines, which are the accepted limit values (G). At the point of intersection of the line P with line G, one can read the value of the mileage for which the average value of the parameter exceeds the threshold; it is the so-called reverse predicate. The mileage read as intersections of the straight line G with the Pd and Pg curves define the 95% confidence interval (also called the calibration interval) for the mileage value at which the threshold value for the hypothetical individual measurement of the parameter is exceeded. When analyzing the nature of the changes in the acid number based on the collected empirical data and point prediction (Figure 2), attention was drawn to the rapid increase in the acid number in relation to the number of kilometers traveled. Limit values were exceeded at 12,000 km for ME and MS oils and at 13,000 km for CE and PE oils. Acceptable levels of the acid number were longest retained by the engine oils from the PS group. From the beginning of the test, regular increases in the acid number were recorded, and as a result, predictions for greater mileages than those examined in the study canhave a relatively low standard error (except for the ME oils for which the prediction range is the widest).
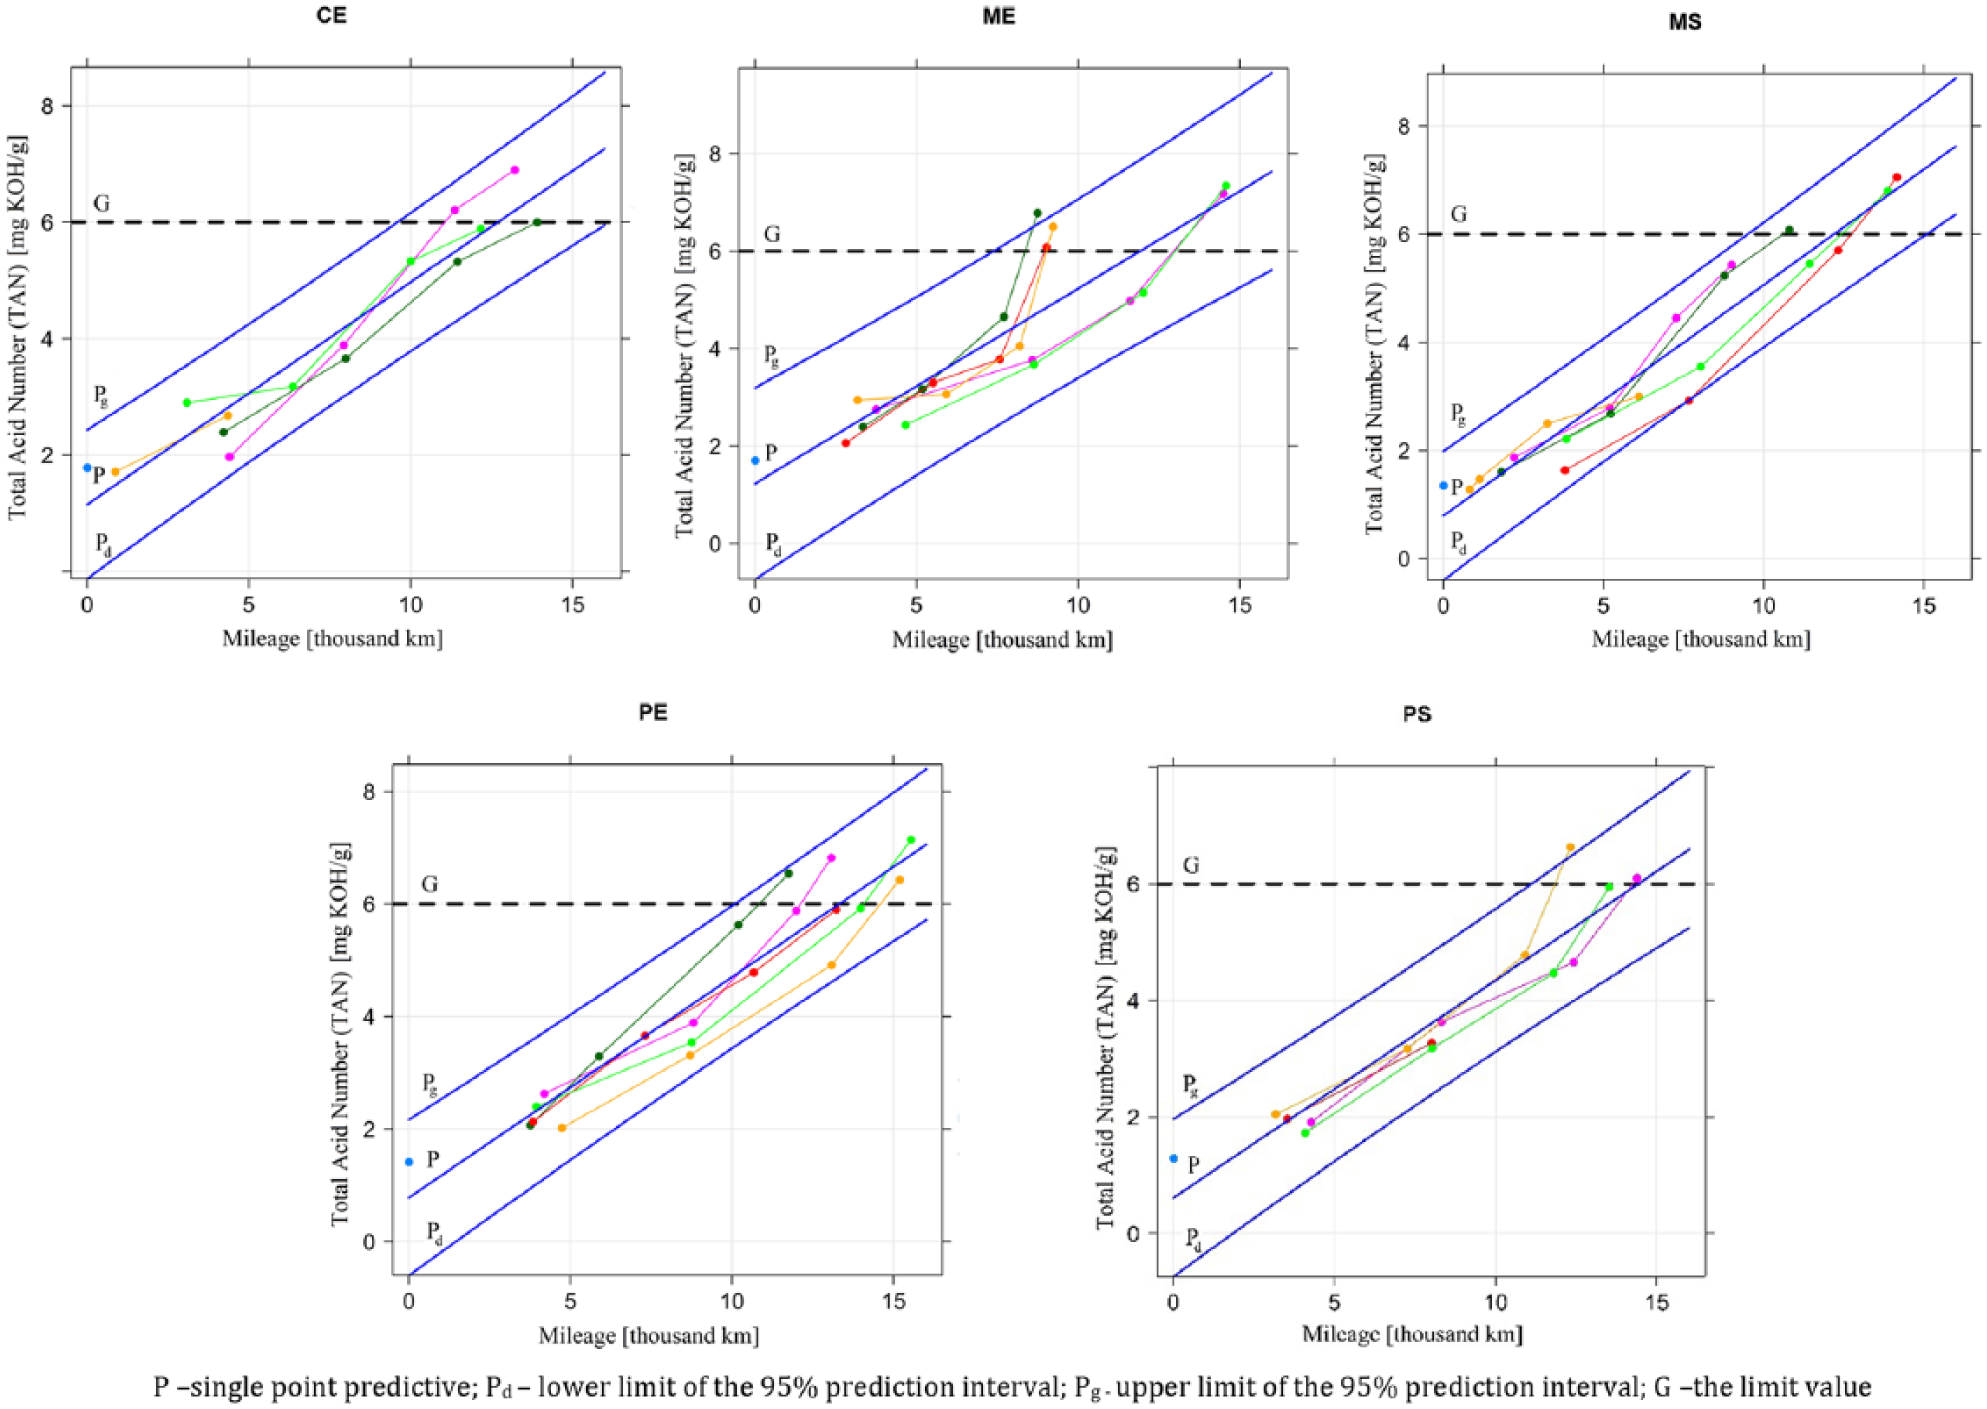
Empirical data and single point predictions of mileage in the range 0–16,000 km (TAN)
VI. Final conclusions
This study focuses primarily on the description of changes in the TAN of engine oils during operation. The results of the research conducted on the fleet of vehicles under real operating conditions might be helpful in making rational decisions regarding the life and use of engine oils. The main conclusions of this study are as follows:
All analyzed oil groups showed a similar upward trend in the TAN from the start of the test. In the case of CE, MS, and PE oils, the TAN rose in proportion to the kilometers traveled throughout the operating period. Similar results were observed in the oil groups ME and PS, up to the mileage range of 8000–12,000 km; however, above this range, the TAN changes intensified.
The acid value after 12 months of operation rose fourfold when compared with the fresh oil (max values exceed 7 mg KOH/g). Wang 2 reported significantly lower TAN—5 mg KOH/g, after 12,000 km of operation. The difference in the obtained results confirms the negative effect of the “severe” operating conditions on the degradation of engine oils. The limit values have been exceeded on average after approximately 13,000 km—at the latest for the PS group of oils (approximately 14,000 km). The statistical analysis allowed to confirm the high homogeneity of the tested oils—especially in pairs containing the MS oil (MS with CE, MS with PE, and MS with PS)—in all four measuring periods.
The obtained data allowed us to develop a statistical model with the use of linear function. The model based on the changes in the TAN of in-service engine oils can be used to predict the behavior of oil during operation.
It should be noted, however, that in order to obtain more complete information on the changes occurring in the oil, it is advisable to analyze the acid number together with kinematic viscosity measured at 100°C 14 and also consider the degree of oxidation.
Footnotes
Acknowledgements
All laboratory tests for this study were conducted at the Oil and Gas Institute in Kraków–the National Research Institute. The author wishes to thank the Director of the Oil and Gas Institute Prof. Maria Ciechanowska, PhD. Eng., and acting as Deputy Director for Oil Technology Wiesława Urzędowska, MSc, for the opportunity to perform the tests.
Funding
The publication was funded by appropriations of the Faculty of Commodity Science, Cracow University of Economics, within the framework of grants to maintain the research potential.