
Abstract
This study establishes a thermal management model to improve the heat exchange performance and uniformity of the flow-field distribution in the engine compartment of a wheel loader. Flow-field analyses are performed for an XG956 wheel loader in a virtual wind tunnel using the combined engine compartment thermal management model and computational fluid dynamics. The Fluent calculations revealed various problems. For example, the inlet flow rate at both sides of the engine compartment is small, which accounts for about 8.5% of the total flow, and the flow uniformity of radiator becomes worse with the increase in the air flow. The original cooling system is improved based on the simulation results and then verified by field testing. A comparison of the test data with the simulations indicates that the values obtained using the thermal management model of the engine compartment are largely in agreement with the experimental values, with a maximum deviation of the heat transfer rate at the rated speed of 5.1%. The research method presented in this article could further help to increase the productivity of the non-road mobile machinery cooling system and lower design costs. The temperature of pressurized air, hydraulic oil, transmission oil, and engine cooling fluid decreased by 22.5%, 8.7%, 2.2%, and 8.4% in the improved loader, respectively.
Introduction
Wheel loaders are equipped with a power system that simultaneously supports the normal driving and loading operations. As a result, the power system generates large amounts of heat, particularly under high load conditions. Therefore, the thermal balance of the engine compartment plays a critical role in the efficiency of the power system and wheel loader. Inside the engine compartment, there are various heat sources with different heat generation rates. Moreover, the heat generation rate of an individual heat source also varies according to the engine load condition of the wheel loader. The geometric dimensions and arrangement of heat sources significantly impact the heat exchange performance of the engine compartment. Previous studies have focused on improving the heat transfer efficiency of a single radiator and optimizing the design of the cooling fan with the radiator. For instance, Chang et al. 1 analyzed the experimental data of 90 fins and successfully fitted the friction factor expression for the louvered fin with a maximum error of less than 10%. M Dehghan et al.2,3 and Bovand et al. 4 work on the porous medium to analytically interpret the thermal non-equilibrium of tube heat exchangers. Chen and collegues5–7 arrived at kinds of correlations of heat transfer factor and friction factor of different structured fins about Reynolds number through experiments on fins of different varieties to evaluate their heat transfer efficiency better. JJ Liu et al. 8 made three-dimensional (3D) numerical study about shell-side heat transfer and flow characteristics of rod-baffle heat exchangers with spirally corrugated tubes. M Sheikholeslami and collegues9–19 studied the effect of nanometer fluid on heat exchanger performance in combination with porous media. And Lu et al. 20 proposed a 3D collaborative simulation method to achieve the integrated optimization of multiple thermal system designs and performance predictions, and this approach accurately predicted the heat transfer rates of a vehicle under different load conditions. Myers and collegues 21 introduced a new low-temperature cooling system and successfully reduced the pressure drop of a 2.0-L turbocharged engine by improving the heat transfer rate of the engine’s cooling system. Researchers22–24 have also adopted the standard approach that first analyses the radiators, fins, cooling fans, and other components individually and then applies an empirical formula to estimate the overall heat transfer rate and resistance characteristics of the vehicle. However, this approach neglects the crucial fact that the cooling system is an integrated part of the engine compartment. Furthermore, bench tests of the cooling system are often performed in an ideal state, which considers the flow fields as evenly distributed and neglects the driving and loading operations of the wheel loader. However, there are many components in the inlets and outlets of the engine compartment, which cause the flow fields to be complex and non-uniform. Neglecting the engine compartment characteristics typically has a major impact on the predicted heat transfer rates and pressure distributions, and the authors believe that this impact contributes to the significant deviation between the simulations and test results obtained in many previous studies.
This article proposes a thermal management model that combines the cooling system with the engine compartment of an XG956 wheel loader. A virtual wind tunnel is established for the model using the combined UG and Fluent to simulate the flow-field performance of the entire engine compartment. The thermal management model provides relatively good predictions compared with the measured values of the engine compartment. More importantly, the model also exposes deficiencies in the engine compartment design. Several modifications are made to the original engine compartment based on the simulation results obtained from the 3D calculation model. Tests on the modified engine compartment demonstrate good agreement with the model predictions, with a maximum heat transfer rate deviation at the rated speed of only 5.1%. The feasibility of the new model was verified through field tests on a real wheel loader. This model can further increase productivity of the non-road mobile machinery cooling system with lower design costs.
Engine compartment thermal management model
Governing equations
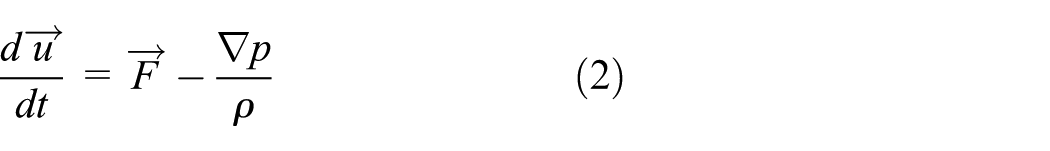
Three conservation laws are widely used to solve various mass and heat transfer problems, and the differential form of conservation laws used in this article as shown in equations (1)–(3). The heat transfer and resistance characteristics of radiator are calculated using porous medium model. Porous media are modeled by the addition of a momentum source term to the standard fluid flow equations as shown in equation (4). The source term is composed of two parts: a viscous loss term (the right-hand side of equation (4)) and an inertial loss term (the right-hand side of equation (4)) 25
Conservation of mass

Conservation of momentum
Conservation of energy

where u is the flow velocity vector, t is the time, H is the enthalpy, k is the thermal conductivity of the fluid, and Φ
Porous media model

where
Heat transfer analysis
The heat transfer capacity and resistance characteristics are key indicators for evaluating the performance of a cooling system. Therefore, researchers typically use the pressure loss and heat transfer rate as criteria for evaluating the cooling system performance. Regarding the characteristics of the engine compartment, we consider the heat transfer at the first stage. The heat generation rate mainly comes from transmission system and heat convective or radiation. The heat exchange cycle of XG956 wheel loader is shown in Figure 1.
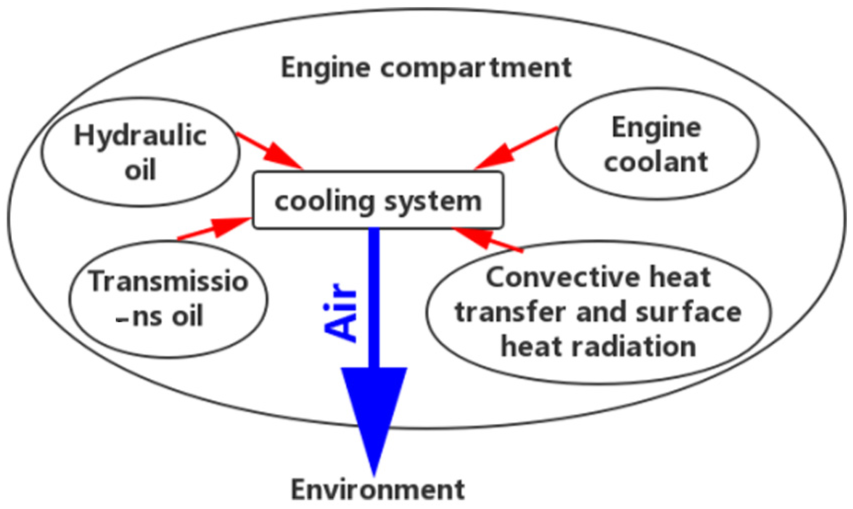
Heat exchange of heat source in engine compartment.
According to the conservation law, the total heat transfer rate is equal to the total heat generation rate when the engine compartment is in a state of thermal balance or else the temperature of heat source of cooling system will increase. For the present model in this article, the total heat transfer rate Q is expressed by the Newton cooling formula as

where

where

where
The surface heat rate Qs is divided into two parts: surface convective heat transfer and surface heat radiation. The radiation is calculated based on the Stefan–Boltzmann law, and the convection is expressed by Fourier’s law of cooling as

where h is the convective heat transfer coefficient,

In this article, the number of transfer unit (


where

Engine compartment heat transfer model.
Resistance characteristics analysis
The total pressure loss of the engine compartment is composed of the pressure loss of the radiator module


where l is the length of the core,
Flow-field uniformity analysis
In addition to the previous two parameters, the present model introduces a third parameter, the flow uniformity coefficient, to assess the efficiency of the cooling system. The flow characteristics of cooling air after passing cooling module indicate the unevenness of flow-field distribution in the engine compartment. The flow uniformity coefficient

In this article, the outlet of engine compartment is divided into M × N matrices and
Flow-field simulation of the engine compartment
Simulation model and boundary conditions
A 3D model of the engine compartment is built from the dimensions and arrangements in the wheel loader manual, as shown in Figure 3. Certain components, such as buckets and axles, are omitted from this model due to their negligible effects on the simulation results. 28 Furthermore, several simplifications are made to facilitate the establishment of the components. Around the engine compartment, inner and outer wind tunnels are created under basic principles from the literature,29,30 as shown in Figure 4. Regarding the meshing of the model, a Hex-unit is used for all radiator, engine, air filter, and water tank, whereas a T-Grid unit is used for the rotation zone of the fan and interior space of the engine compartment. Local mesh refinement is performed on the air intake zone, fan, and wind scooper zone. The size function is used to scale the wind tunnel grid such that the grid of engine compartment is relatively dense, whereas the grid of the inner and outer wind tunnels is sparse. During grid-independent study, as shown in Figure 5, the total number of grid squares in the present model is 5.12 million and all heat exchangers were calculated using previous porous media model. The simulation took about 8 h to accomplish with the processor Xeon E5 2620 v4. Table 1 summarizes the boundary conditions for the simulation case. For the next step, the thermal management model writes a UDF (Universal Disk Format) file that is then imported to Fluent for calculation.
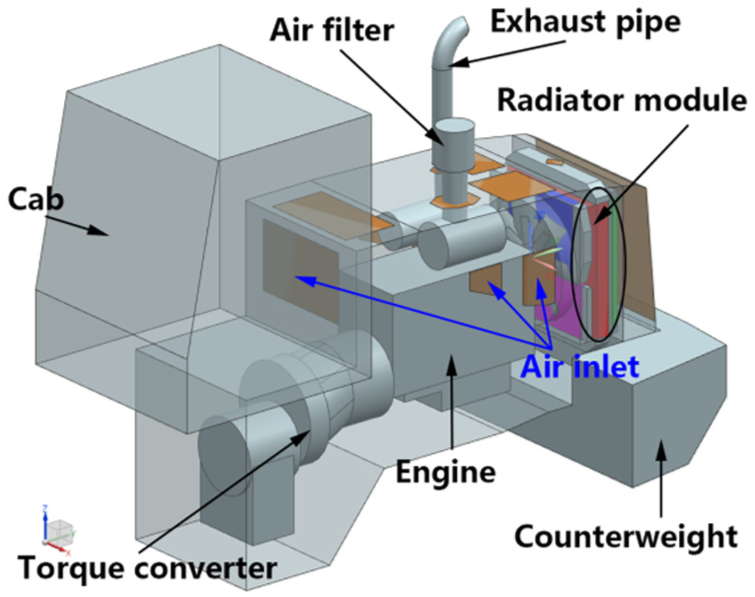
Wheel loader engine compartment model.

Grid partition of the computational domain.

Grid-independent study.
Boundary conditions.

Simulation results and discussions
Flow-field analysis of the engine compartment
According to the Fluent velocity vector contours shown in Figure 6(a), there are several clear recirculation zones below the radiator module and the blockage area between adjacent radiators. The cooling air mainly comes from above and below the inlet of the engine compartment, whereas relatively less intake air comes from the horizontal inlets. The upper space is significantly larger than the both sides’ space in the engine compartment, and the fluid flow resistance is relatively small. So, there is small airflow from entrances No. 1 and 2, and entrances No. 3 and 4 show nearly no airflow (Figure 6(b)). The Fluent simulation results indicate that the volume flow rate from the horizontal entrances accounts for only 8.5% of the total volume flow rate of the engine compartment. Furthermore, the use of both horizontal inlet designs will cause more noise.

Velocity contours of simulation model: (a) velocity vector contours inside the engine compartment and (b) air flow distribution.
Pressure loss and heat transfer analysis of the engine compartment
In the cross section of the radiator module, the transmission oil cooler, engine coolant radiator, hydraulic oil cooler, and charge air cooler are the air-cooled heat exchanger, and those three sets of radiators are arranged in the direction of incoming airflow. Table 2 indicates that the pressure loss of the radiator module increases with the increase in the volume flow rate, and the recirculation area in the rear of the engine compartment becomes increasingly large with the increase in the incoming airflow. The increase in the incoming airflow in turn increases the viscous resistance between the adjacent radiators, and the blockage area becomes larger (Figure 7). The blockage and recirculation zones will not only increase the shaft power of the cooling fan but also reduce the effective pressure area of the radiator. As shown in Figure 7, due to the small size of the charge air cooler and hydraulic oil cooler, there is space around the charge air cooler and hydraulic oil cooler with a wind scooper, and the flow loss caused by this space may reduce the heat transfer efficiency of the pressurized air and hydraulic oil. The flow distribution on the radiator surface is same in different volume flow rate. Due to the non-uniformity of fan, the rate of flow is low in the center of radiator surface and the surrounding flow is high (Figure 8).
Pressure loss at different volume flow rates.

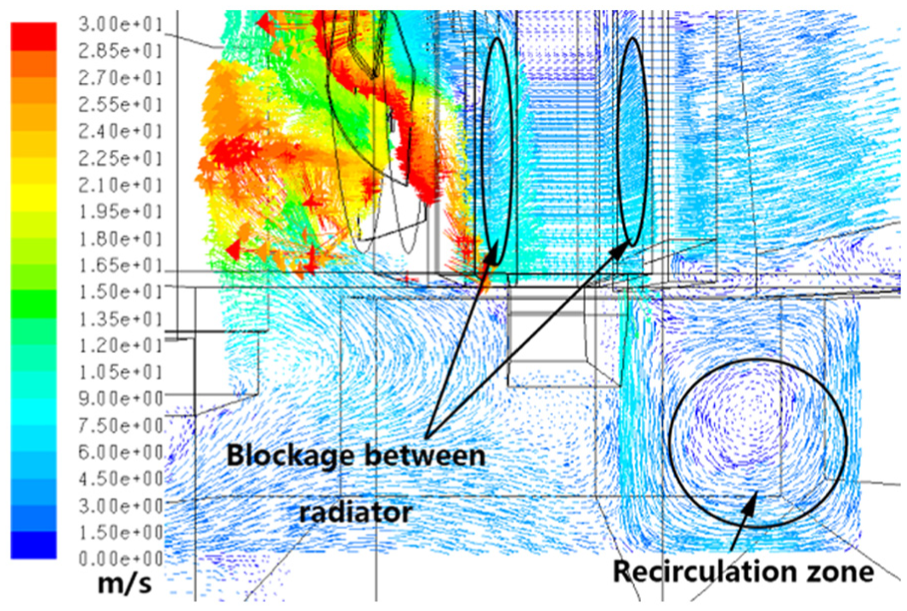
Recirculation zone of the engine compartment.

Velocity distribution of radiator module.
According to the simulation results, the heat transfer performance of the XG956 wheel loader is fine in general, but the cooling effects of certain heat sources are not ideal. Under the same simulation conditions as shown in Table 1, the peak temperature of pressurized air and hydraulic oil is still in the normal range when the engine coolant temperature is close to the temperature limit, but the transmission oil temperature has exceeded the temperature limit (Table 3). As indicated by the analyses in sections “Governing equations” and “Heat transfer analysis,” the efficiency of the radiator is closely related to the arrangement of fins and the direction of cooling air flow. In terms of the flow direction, the coolant flow direction of the engine coolant radiator and transmission oil cooler is the same as flowing from top to bottom, whereas the charge air cooler and hydraulic oil cooler exhibited horizontal flow. Based on the principles of convection heat transfer, for a given temperature difference between hot and cold fluids, the heat transfer efficiency of the vertical arrangement is higher than that of the parallel arrangement. Therefore, the heat transfer efficiency of the engine coolant radiator and transmission oil cooler is affected by the arrangement. The airflow interference between the heat exchanger at the end of the radiator module is more serious because of the gradual increase in static pressure loss, which creates a blockage zone between adjacent radiators.
Simulation results at power point T/°C.

The pressure distribution is relatively uniform when the airflow passes through the first row of heat exchangers, but when it reaches the second layer exchangers, however, pressure distribution experiences a significant migration, and the non-uniform temperature distribution of the transmission oil cooler, which is at the end of radiator module, is the most affected. The surface temperature of the engine coolant radiator and transmission oil cooler is high, as shown in Figures 9 and 10, respectively. Excessive transmission oil temperature can increase the inner leaking and cavitation due to the decreased oil viscosity of the wheel loader, which not only reduces the efficiency of the working device but also affects the life of the drivetrain.31,32

Temperature contours of the engine coolant radiator.

Temperature contours of the transmission oil cooler.
Improvements to the engine compartment
Based on the analysis of the preceding section, the following improvements are made to the engine compartment of the XG956 wheel loader. Due to the reduced airflow from the horizontal inlet, we eliminated the side entrances of the engine compartment (Figure 11). Due to the large number of radiators in the original air-cooled radiator module, it is unrealistic to solve the problem of an excessive pressure drop based solely on the radiator arrangement. Therefore, in this article, the hydraulic oil cooler, transmission oil cooler, and charge air cooler of the original cooling system are changed to water-cooled heat exchangers.33,34 Using a newly designed dual-loop cooling system to keep thermal balance of engine compartment, and a low-temperature cooling circuit in series with these water-cooled heat exchangers, a low-temperature radiator is included to disperse the heat from above the low-temperature heat sources, and the high-temperature circuit is responsible for cooling only the engine jacket coolant (Figure 12).
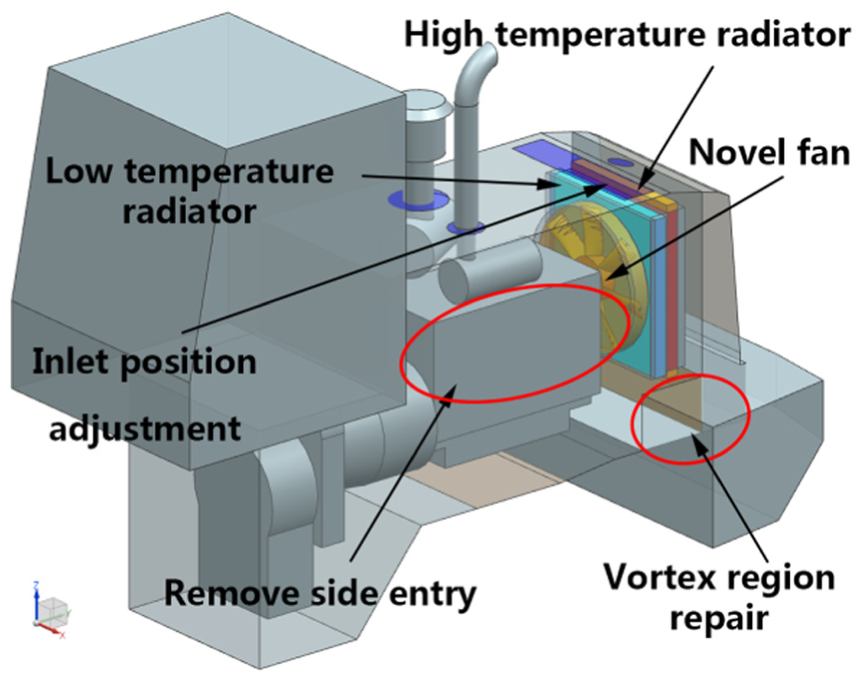
Modified engine compartment.
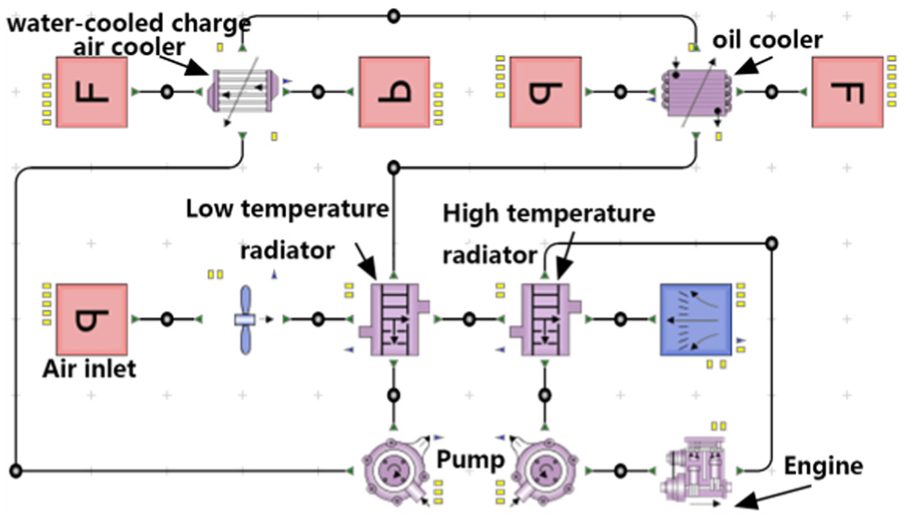
Schematic diagram of dual-loop cooling system.
By contrast, in Figures 3 and 11, the air side of the dual-loop cooling system retains only a vertically arranged high-temperature radiator, and the low temperature causes the radiator module thickness to decrease by 35%. Formulas (8) and (9) indicate that in the same state, reducing the thickness of the radiator will reduce the pressure drop of the radiator, and a reduction in the number of radiators can also reduce the vortex and blockage between adjacent radiators and improve the heat transfer uniformity. The reduction in the pressure drop of the new radiator module reduces the demand for air flow and the static pressure of the engine compartment. This makes it possible to use a low-power, noise-reduction fan with a smaller fan leaf. In this article, the non-smooth surface fan from literature 35 is used instead of the original arc bending plate fan.
The simulation is performed according to the boundary conditions presented in section “Simulation model and boundary conditions.” The velocity distribution of the modified engine compartment is shown in Figure 13. Compared to Figures 7 and 8, the flow field is more stable and the vortex region is significantly reduced. The pressure losses of the new radiator module and original radiator model are compared in Figure 14. The pressure loss of the new module is lower than that of the original module. With an increase in incoming airflow, the pressure loss of the two types of modules increases, but the growth rate of the new radiator module is notably lower than that of the original radiator module. When the volume flow rate is 5.96 m3/s, the new radiator module pressure drop reaches a maximum value of 610 Pa, which is 28% lower than that of the original radiator module. This lower value occurs due to the reduction in the thickness of the radiator module, which reduces the pressure drop of the radiator core. Furthermore, the reduction in the number of heat exchangers reduces the airflow disturbance between adjacent radiators.

Velocity vector contours of the modified engine compartment: (a) recirculation reduction and (b) velocity vector contour.

Comparison of the radiator module pressure losses.
The heat transfer rate of the radiator module increases with the increase in the air intake amount. The heat transfer rate of the new module is larger than that of the original module for a given volume flow rate of air. As shown in Figure 15, the new module has notable advantages; when the air flow is 5.92 m3/s, the new radiator module heat transfer rate reaches a maximum value of 84 kW, which is 14% higher than that of the original module.

Comparison of the radiator module heat transfer rates.
In the new heat exchanger module, there is no space between the high- and low-temperature radiators and the wind scooper, which solves the problem of flow loss, which is shown in Figure 8. Figure 16 illustrates that the new radiator module has significantly better non-uniformity of the heat transfer than the original module. The high-temperature region of the low-temperature radiator is located in the central part of the radiator which is located in the fan hub area, and the area of low velocity and volume flow rate leads to a local concentration of heat. The high-temperature region of the high-temperature radiator is concentrated on the inlet and outlet of the coolant, which represents a significant improvement compared to the large area of the high-temperature area shown in Figures 9 and 10.

Temperature distribution of radiator: (a) low-temperature radiator and (b) high-temperature radiator.
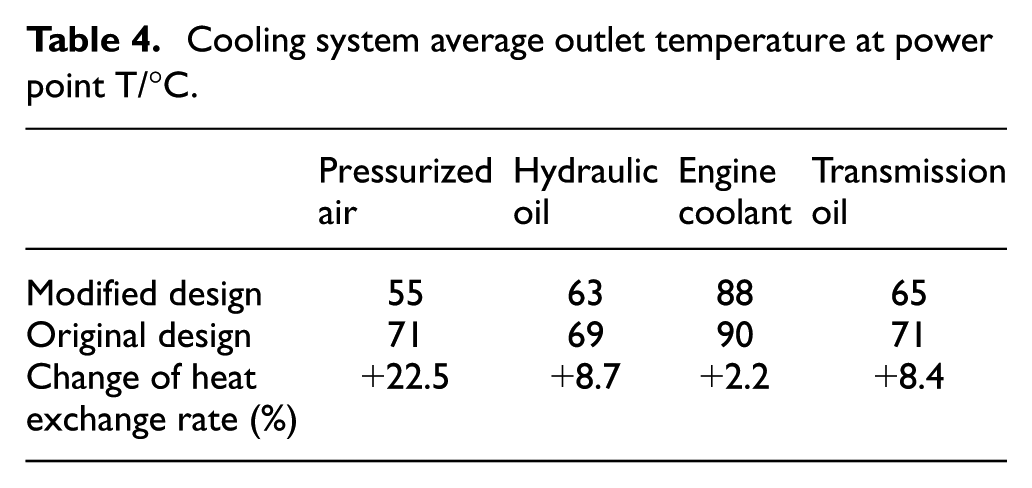
A comparison of Tables 3 and 4 illustrates that the heat transfer efficiency of the modified cooling system is higher than that of the original cooling system. In addition, the average outlet temperatures of the pressurized air, transmission oil, and hydraulic oil are lower than those of the original cooling system and considerably lower than the limit temperature. Thus, the wheel loader has a certain heat transfer rate reserve even under high engine loads.
Cooling system average outlet temperature at power point T/°C.
Experimental verification
The modified XG956 wheel loader was tested in the field in accordance with the literature 36 to verify the effect of the improved design. The sensor and data acquisition equipment layout is shown in Figure 17. The standard uncertainty of five groups of experiments is shown in Table 5, and the error of experimental data mainly comes from the accuracy of the equipment and the slight difference in environmental conditions.

Data acquisition device and sensor arrangement: (a) wheel loader and (b) partial sensor arrangement.
Comparison of the field test result and simulation value.

Comparing the simulation data and the field test data, the heat transfer rate surface of the engine compartment is fitted as shown in Figure 18. The total heat transfer rate of the engine compartment increases gradually with the increase in the engine speed and mass flow rate of the fan, and the growth trend gradually decreases with the increasing engine speed. This trend occurs because the temperature in the engine compartment increases rapidly with the increasing engine load, which causes the temperature difference between the hot and cold fluids to decrease and the heat transfer efficiency of the heat exchanger to be reduced. The total heat transfer rate of the engine compartment reaches a maximum of 153.7 kW at 2200 r/min and airflow of 12 kg/s. The error between the experimental data and the simulation data mainly comes from the setting of the porous media model.

Total heat transfer rate of the engine compartment.
The field test results are in good agreement with the simulation results, with a maximum deviation of 5.1% according to Table 5, which verifies the reliability of the engine compartment thermal management model. The deviation between simulation and site experiment originates from several aspects. First, the engine compartment thermal management model was established according to the ideal cycle and has its own errors. Second, the simplification of the fin geometrical structure and engine compartment details make the model different from the actual engine. Finally, ignoring the transverse heat transfer of the radiator and the compressibility of pressurized air makes the simulation heat transfer rate lower than the field test value.
A total of 25 sensors are arranged at the outlet of the engine compartment to collect the air flow data of the exit and the data points are synthesized into a velocity distribution surface as shown in Figure 19. The flow-field distribution of the modified engine compartment is more uniform, and the low flow rate zone is smaller than original. Compared to the flow uniformity coefficient of the engine compartment as shown in Table 6, the flow-field uniformity of the modified engine compartment has been improved according to the field tests; the flow-field uniformity of the improved engine compartment is 6% higher than that of the original engine compartment.

Engine compartment outlet airflow rate distribution: (a) original and (b) modified.
Comparison of the flow uniformity coefficients.

Conclusion
This study establishes a thermal management model of an engine compartment. The model can accurately evaluate the flow-field distribution of the engine compartment and the thermal and resistance characteristics of the dynamic system components. Thus, this model is significant for the optimized design of non-road mobile machinery cooling system.
A computational fluid dynamic (CFD) simulation of a certain type of loader was conducted using the engine compartment thermal management model. The original design of the engine compartment on the side of the inlet airflow is small, representing only 8.5% of the total airflow. The flow uniformity in the radiator is affected by the inlet airflow, and the flow uniformity decreases with the increase in the inlet flow.
A comparison of the field test data and simulation data showed that the thermal management model can accurately reflect the thermal characteristics of the engine compartment. The maximum deviation between the simulation value and test value is 5.1%, which verifies the reliability of the model. By optimizing the engine compartment with new cooling fans and modified hatch openings, the heat exchanger efficiency of each heat resource has been improved in the modified loader. And the average temperatures at power point of the pressurized air, hydraulic oil, transmission oil, and engine coolant were reduced by 22.5%, 8.7%, 2.2%, and 8.4%, respectively.
Footnotes
Appendix 1
Handling Editor: Hongwei Wu
Declaration of conflicting interests
The author(s) declared no potential conflicts of interest with respect to the research, authorship, and/or publication of this article.
Funding
The author(s) disclosed receipt of the following financial support for the research, authorship, and/or publication of this article: The work reported in this paper was supported by the Science and Technology Development Plan Project of Jilin Province (20160520070JH), “13th Five-Year” Science and Technology Project of Jilin Provincial Department of Education (JJKH20180139KJ), and the National Natural Science Foundation of China (grant no. 50775096).