
Abstract
This article researches the influence of different air-outlet modes of electric vehicle power cabin basing on natural wind cooling. The results indicate that combining with simulation calculation and field synergy analysis method, it is rapid and accurate to choose the best air-outlet mode; when the temperature gradient value is constant, the field synergy number increases with the vehicle speed, which improves the heat dissipation performance of battery. Through the research, the heat dissipation performance of up-outlet with two-holes mode is best while both-sides outlet mode is worst, which is validated by heat flow field characteristic analysis of electric vehicle power cabin at different ambient temperatures. The temperature variation curve of down-outlet mode is steeper than other air-outlet modes, which shows the more obvious improving ability of heat dissipation performance along with the increased vehicle speed.
The temperature distribution of battery pack is directly affected by heat dissipation performance of electric vehicle power cabin basing on natural wind cooling, and it affects the battery pack working. In recent years, CFD (computational fluid dynamics) technology has rapidly developed1–3 along with the improvement of numerical calculation method and computer performance; it possibly uses the numerical simulation method to research the heat flow field characteristics of electric vehicle power cabin.4,5 The research method of heat dissipation performance has changed from test analysis to main simulation calculation and auxiliary with test analysis.6,7 A Jarretta and IY Kim 8 used a numerical optimization algorithm incorporated with a CFD analysis to research and optimize the electric vehicle battery cooling plates for thermal performance. LH Saw et al. 9 used CFD methods to investigate the air cooling system for a 38,120-battery pack, and the numerical results showed good agreement with the experimental results at various current rates of charging. This method provides a simple way to estimate thermal performance of the battery pack when the battery pack is large and full transient simulation is not viable. 10 R Mahamud and C Park 11 proposed a new battery thermal management method using a reciprocating airflow for cylindrical Li-ion (LiMn2O4/C) cells. The numerical results showed that the reciprocating flow can reduce the cell temperature difference of the battery system by about 4°C (72% reduction). XW Zhu and JQ Zhao 12 found that the local heat transfer variation can be accurately and clearly visualized through the synergy angle distribution in the thermal boundary layer for laminar flow, which gives a theoretical verification for field synergy principle.
Combining with field synergy analysis method, this article researches the influence of different air-outlet modes to the heat dissipation performance of electric vehicle power cabin basing on natural wind cooling at different ambient temperatures, in order to offer references for the heat flow field synergy analysis of electric vehicle power cabin and choosing the air-outlet mode.
Model
Figure 1 shows the electric vehicle model, and asymmetric cut-angle rectangular is chosen as the section shape of wind tunnel13,14 (as shown in Figure 2).

Electric vehicle model.

Wind tunnel with no-symmetry cut-angle rectangular.
The battery pack is made up of several interconnected modules, which in turn are composed of several Li-ion batteries. In each module, cells are connected in series in a vertical position with the tabs connected upward, and the modules are connected in an appropriate way in order to fulfill the desired power and capacity requirements of the application. Figure 3 shows the battery pack in the power cabin of electric vehicle, which has the dimensions of 780 mm in length, 196 mm in width, and 185 mm in height. The battery pack is 400 mm from the front of electric vehicle and 205 mm from the bottom. Figure 4 shows the components inside the pack, which has a total of 144 55 Ah lithium-ion batteries (includes 12 modules with two parallels and six series, pack voltage: 266 V, capacity: 110 Ah). Each module is spaced 5 mm apart and close to the battery box. CFD method depends on high-performance computers. HP-Z800 workstation is used in this research; configuration: CPU, 24 kernels; memory, 64 GB.

Battery pack dimensions.

Battery pack components.
Field synergy analysis methods
Field synergy principle
Heat transfer is a very common phenomenon in nature, 15 and it could be divided into three basic ways: heat conduction, 16 convection,17–19 and thermal radiation.20,21 The field synergy principle considers the convection heat transfer as the heat conduction problem with internal heat source, and believes that the presence of flow could enhance heat transfer or no substantial contribution, even weak heat transfer. 22
The two-dimensional laminar boundary layer is shown as an example, and the energy equation could be expressed as

The thermal flow of wall could be obtained by equation (1) integral

It is nondimensionalization of equation (2) by

Equation (3) could be expressed as another form
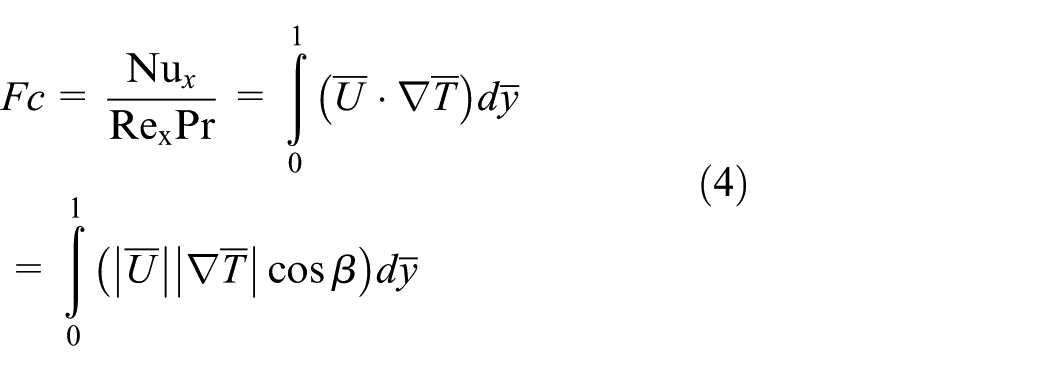
FC means field synergy number; it represents the synergy degree between flow field and temperature field. The convection heat transfer intensity not only depends on the velocity, temperature, and fluid properties but also depends on the coordination degree between flow field and temperature field. Only when velocity
The three aspects of the synergy between velocity field and temperature gradient field are as follows: 23
The angle between velocity and temperature gradient is as small as possible.
The local value includes velocity and temperature gradient, and the angle cosine should be large at the same time; it means that when the angle cosine is large, the value of velocity and temperature gradient should also be relatively large.
For internal flow, the velocity distribution and temperature distribution are as uniform as possible; then the synergy could be improved.
WQ Tao et al. 24 and YL He et al. 25 applied the field synergy theory to research on the pulse tube refrigerator and optimized the relevant parameters; PS Guo et al. 26 studied the synergy performance between temperature field and electric field in particular thermoelectric effect; JA Meng et al. 27 applied the field synergy theory to research on longitudinal vortex heat transfer technology and applied for some patents; WX Tian et al. 28 studied the turbulent heat transfer between two parallel flat plates with numerical simulation method; and G Li et al. 29 applied the field synergy theory to research on the different shapes of base tube to the heat dissipation performance of exchanger. In a few words, it has used the field synergy principle in many different fields, and forms a new idea to analyze and solve problems.
Field synergy analysis method
In view of the field synergy principle, this article puts some new concepts in order to do a more detailed definition. The field synergy number of two different fields is relevant to the magnitude and angle of the scalar. The given field can be defined as the original field while another field is function field. Otherwise, define the synergy angle less than 90 degrees as positive synergy while the synergy angle bigger than 90 degrees as negative synergy. When function field and original field are positive synergy, the movement of the original field would further increase, conversely, it would reduce. It is definition of original field and function field no coupling (the original field does not change following the function field) for one-way synergy, and original field and function field coupling (the original field changes following the function field) for two-way synergy.
Heat flow field synergy analysis of electric vehicle power cabin
Heat flow field synergy analysis of different air-outlet modes
Figure 5 shows the temperature gradient magnitude and direction of natural placed heat source, the horizontal direction of temperature gradient is small, and vertical direction is large, so that the overall temperature gradient of heat source is considered as placing along the vertical direction; at the same time, the temperature gradient along the narrow area of heat source vertical direction is toward down and bigger than other area.
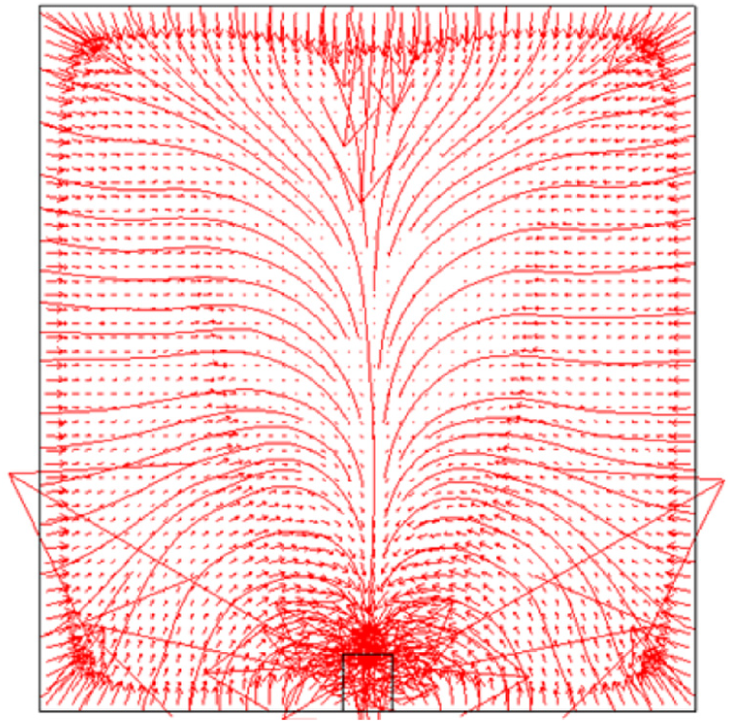
Temperature gradient magnitude and direction of natural placed heat source.
Figure 6 shows three air-outlet modes and simplified trace, the inlet area of three modes is same (1.12 × 105 mm2), the outlet area of three modes is also same (2.8 × 104 mm2); the distance between up-outlet (or down-outlet) and power cabin posterior wall is 90 mm, the distance between both-sides outlet and power cabin posterior wall is 450 mm, and the distance between battery pack and power cabin posterior wall is 200 mm. Figure 7 shows the mode of up-outlet with two holes.
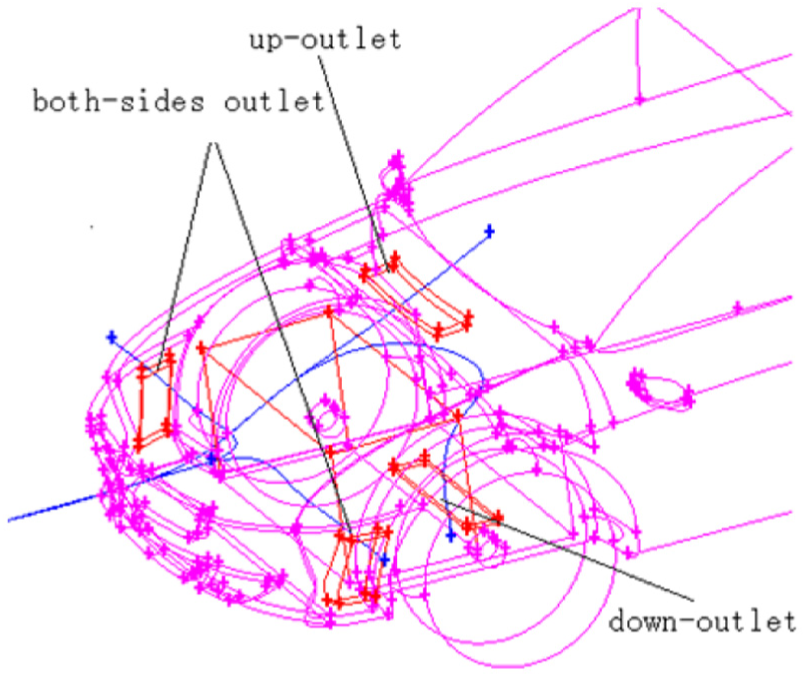
Three air-outlet modes and simplified trace.

Up-outlet with two-holes mode.
Combining with simulation calculation and field synergy analysis method, it is rapid and accurate to choose the best air-outlet mode. Temperature field can be defined as the original field, while the velocity field is the function field. Otherwise, the temperature field and velocity field are no coupling, which is one-way synergy. It can be known that:
According to the field synergy principle, if the local values, including velocity, temperature gradient, and the angle cosine, are large at the same time, the local synergy is good. The airflow in both-sides outlet mode mainly passes from sides of the heat source, so the airflow velocity in the rear is much lower than other place while the temperature difference is large here, which leads to bad local synergy. Another reason is that the airflow direction is almost vertical to the overall direction of temperature gradient, and the heat dissipation effect of airflow also becomes worse to other place. Above all, it could be speculated that both-sides outlet mode has the worst heat dissipation performance.
The heat dissipation performance between up-outlet mode and down-outlet mode could not be simply judged because of the uncertainty of overall temperature gradient direction (up or down).
According to the field synergy principle, the synergy becomes better if the angle between velocity and temperature gradient becomes smaller. The temperature gradient along the vertical direction of narrow area is toward down and its value is bigger than other places. If the airflow goes up, it could reduce the negative synergy between flow field and temperature field through changing up-outlet with one-hole mode into up-outlet with two-holes mode, in order to improve the heat dissipation performance of natural wind cooling.
From the equation,
Calculation method and boundary condition
Mathematical model
Normally, the maximum velocity of electric vehicle is less than 400 km h−1, it means less than one-third sound velocity, so the flow of vehicle body surface could be considered in incompressible flow; the physical parameters of air are constant number. Combining with the phenomenon of air separation by vehicle body complex surface, it should be considered to the turbulent processing. The control equations are as follows:
Continuity equation

Momentum conservation equation

Energy conservation equation

Calculation method
Three-dimensional incompressible Navier–Stokes equations and Realizable k–ε model are used in simulation calculation; second-order upwind difference scheme is applied to obtain the physical quantities of control panel, and Semi Implicit Method for Pressure Linked Equation Consistent (SIMPLEC) method is adapted to iterate.
Boundary condition
The velocity inlet boundary condition is considered, and the velocity value depends on the specific given example, turbulence is 0.1%; pressure outlet boundary condition is considered, the pressure value is standard atmospheric pressure; no-slip boundary condition is considered, and the velocity value is zero.
Thermal power determination of 55 Ah lithium-ion battery
Table 1 shows the thermal physical parameters of 55 Ah lithium-ion battery: the density of electric core is 2123 kg/m3, the thermal conductivity coefficient is 30.6 W/(m·K), and the specific heat capacity is 913 J/(kg·K).
Thermal physical parameters of 55 Ah lithium-ion battery.

Figure 8 shows the arrangement of temperature measuring points and the design of thermal insulation with 55 Ah lithium-ion battery, including two measuring points on bottom and three measuring points on side wall. Heat insulation box is surrounded by three layers of insulating material, in order to ensure good thermal insulation performance.

Temperature measuring points and the design of thermal insulation with 55 Ah lithium-ion battery: (a) temperature measuring points and (b) heat insulation.
Calorific value calculation equation is as follows

where Q means calorific value, cp means specific heat capacity, m means quality, and ΔT means temperature rising.
It could be introduced into the thermal power calculation by using equation (8)
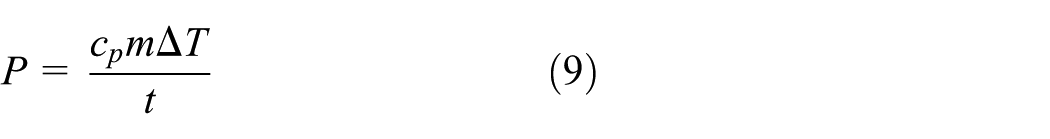
where P means thermal power and t means time.
Constant temperature box is set to suitable temperatures (20°C, 27°C, and 40°C), and the experimental processing is as follow: first, setting 1C charge rate up to 3.65 V; second, turning to constant voltage charge, until 0.05C cutoff; third, setting 1C discharge rate down to 2.50 V.
As a result of the constant temperature box could not be completely insulated, therefore, the measured average temperature rising of lithium-ion battery is less than the temperature rising of actual thermal insulation; it means the calculation value of thermal power is also slightly lower than the actual value. The thermal power of battery on charge and discharge processing is the reference for the heat source setting on simulation calculation.
Heat dissipation performance analysis at different ambient temperatures
Heat dissipation performance indexes
Assessing the heat dissipation performance of battery pack cooling system has two main indexes: the maximum temperature rising and temperature difference. If the maximum temperature rising is too big, it means the environment temperature is relatively poor for battery pack working, and the heat generated by battery pack could not be effectively taken away through the cooling system; if the maximum temperature difference is too big, it means the temperature distribution uniformity of battery pack is poor, so the purpose of battery pack cooling system design should be set to reduce the maximum temperature rising and temperature difference.
20°C ambient temperature
Thermal power of 55 Ah lithium-ion battery at 20°C
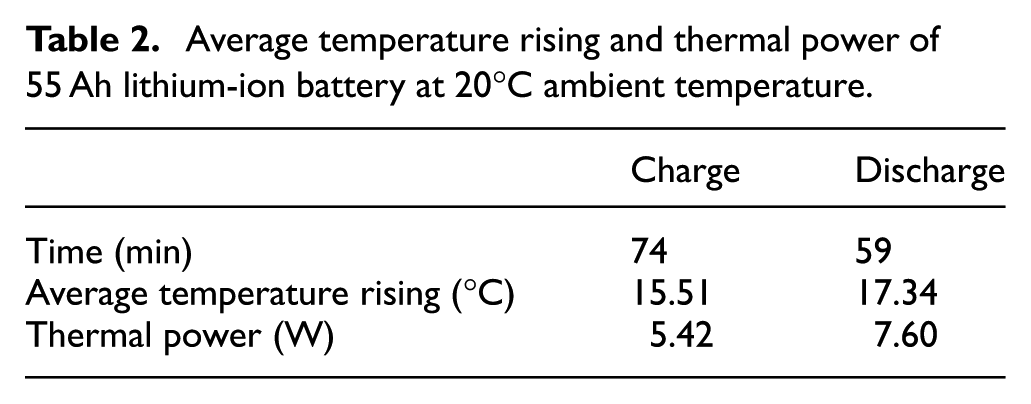
When the ambient temperature is 20°C, and the charge and discharge rate is 1C, Figure 9 shows the average temperature curves of 55 Ah lithium-ion battery. Table 2 shows the average temperature rising and thermal power of 55 Ah lithium-ion battery, the charge time is 74 min, average temperature rising is 15.51°C; the discharge time is 59 min, average temperature rising is 17.34°C. Combining with the thermal physical parameters of 55 Ah lithium-ion battery, it could be obtained that the average thermal power is 5.42 W on charge processing, and 7.60 W on discharge processing, so the average thermal power on charge and discharge processing is 6.51 W.

Average temperature curves of 55 Ah lithium-ion battery at 20°C ambient temperature: (a) charge processing and (b) discharge processing.
Average temperature rising and thermal power of 55 Ah lithium-ion battery at 20°C ambient temperature.
Heat flow field characteristic analysis of different air-outlet modes at 20°C
1. Up-outlet with one-hole mode
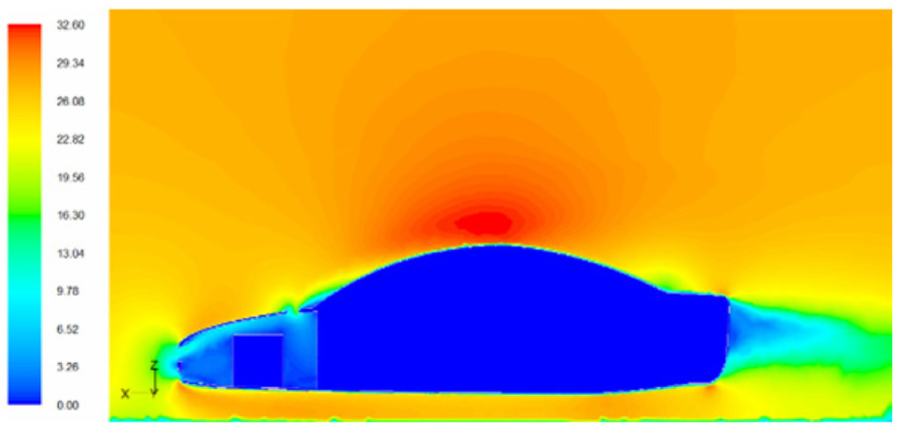
When the vehicle speed is 100 km h−1, Figures 10 and 11 show the velocity field and temperature field distribution of up-outlet with one-hole mode at Y = 0 m section, temperature field distribution, and airflow trace are consistent. It shows that the heat is taken away mainly by the airflow while little heat is taken away by heat conduction. High speed area is on the top of vehicle roof, and high temperature region is on the top of battery pack; the temperature in upper and rear position of battery pack is significantly higher than other place, especially in the area around battery pack. It can be seen from the flow field and temperature field that the angle between velocity and temperature gradient is almost 90° and
Velocity field distribution of up-outlet with one-hole mode at Y = 0 m section.

Temperature field distribution of up-outlet with one-hole mode at Y = 0 m section.
2. Down-outlet mode
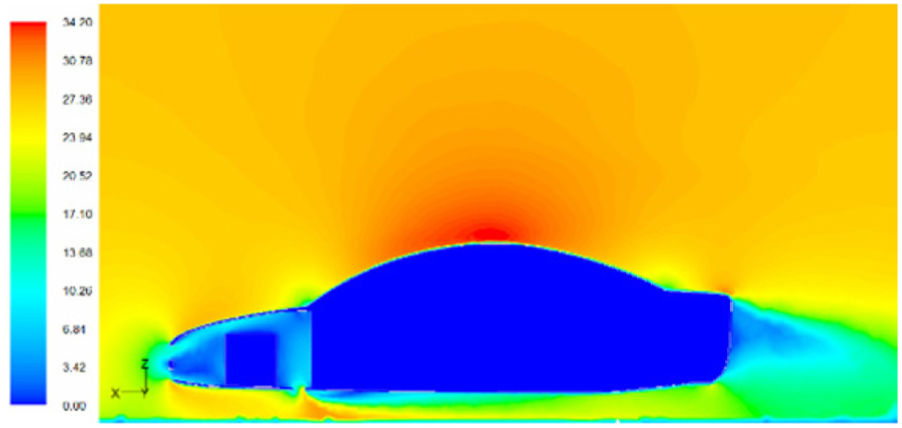
When the vehicle speed is 100 km h−1, Figures 12 and 13 show the velocity field and temperature field distribution of down-outlet mode at Y = 0 m section. Temperature field distribution and airflow trace are still consistent. High speed area is on the top of vehicle roof while high temperature region is on the top and central of battery pack. The airflow downward makes poor consistency of velocity field distribution, which easily forms many vortexes and makes the heat trap inside. It can be seen from Figure 13 that the trajectory of thermal flow is relatively long, which means that the heat dissipation of down-outlet mode is slower than up-outlet with one-hole mode on the bottom of electric vehicle, and increases the drag coefficient. Otherwise, the synergy between flow field and temperature field of down-outlet mode is worse than up-outlet mode with one hole.
Velocity field distribution of down-outlet mode at Y = 0 m section.
Temperature field distribution of down-outlet mode at Y = 0 m section.
3. Both-sides outlet mode
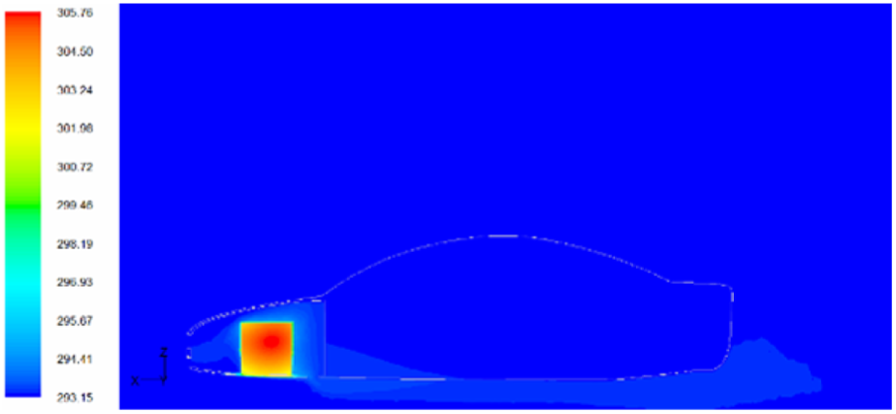
The area of airflow-outlet is same on both sides (1.4 × 104 mm2); Figures 14 and 15 show the velocity field and temperature field distribution of both-sides outlet mode at Z = 0.4 m section. Compared with two modes above, temperature field distribution and airflow trace have large difference. The outlet airflow velocity becomes high while the temperature gets little change. High temperature is obviously concentrated in the power cabin, especially in the rear position of battery pack. Flow field and temperature field have no synergy, which means that little heat is taken away by the airflow. Natural wind cooling has little effect on battery heat dissipation. It could be seen that two obvious eddies locate in the rear of electric vehicle and the trajectory of thermal flow is relatively short, which leads to the quick dissipation of heat.

Velocity field distribution of both-sides outlet mode at Z = 0.4 m section.

Temperature field distribution of both-sides outlet mode at Z = 0.4 m section.
Heat dissipation performance analysis of different air-outlet modes at 20°C
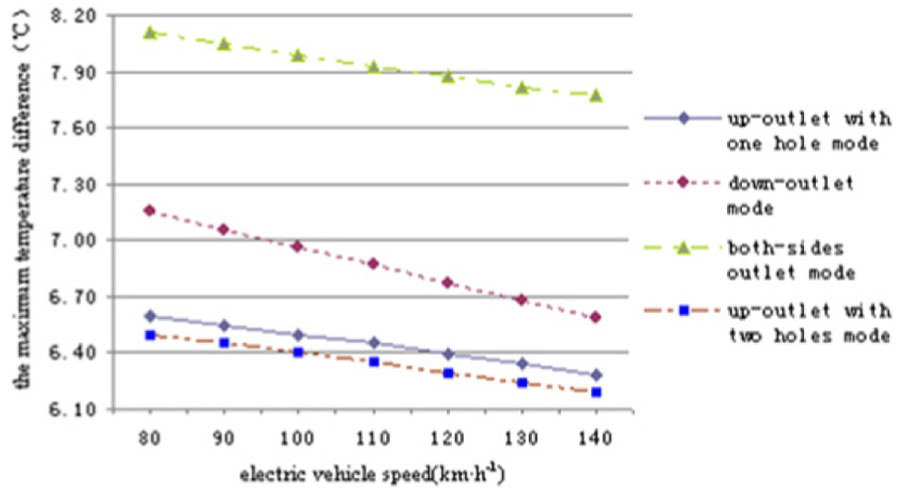
When the ambient temperature is 20°C, Table 3 shows the battery pack temperature data of different air-outlet modes, and Figures 16 and 17 show that the maximum temperature rising and temperature difference of battery pack are both decreased along with increased vehicle speed. At different speeds, the maximum temperature rising of up-outlet with two-holes mode is lowest, and the maximum temperature rising of up-outlet with one-hole mode is closer to up-outlet with two-holes mode (but still slightly higher); the maximum temperature rising of both-sides outlet mode is highest, the maximum temperature rising of down-outlet mode is between up-outlet with one-hole mode and both-sides outlet mode, and closer to up-outlet with one-hole mode. All curves change linear along with vehicle speed. The change tendency of maximum temperature difference along with vehicle speed is similar to the maximum temperature rising; at different vehicle speeds, the order of battery pack maximum temperature difference from low to high is as follows: up-outlet with two-holes mode, up-outlet with one-hole mode, down-outlet mode, and both-sides outlet mode. All curves change linear along with vehicle speed. When the speed is 80 km h−1, comparing with up-outlet with one-hole mode, down-outlet mode, and both-sides outlet mode, the maximum temperature rising of up-outlet with two-holes mode is, respectively, lower by 1.7%, 8.3%, and 16.2%, and the maximum temperature difference is, respectively, lower by 1.3%, 8.7%, and 19.6%; when the speed is 140 km h−1, comparing with up-outlet with one-hole mode, down-outlet mode, and both-sides outlet mode, the maximum temperature rising of up-outlet with two-holes mode is, respectively, lower by 1.0%, 3.2%, and 16.6%, and the maximum temperature difference is, respectively, lower by 1.5%, 5.7%, and 20.5%. The temperature variation trend curve of down-outlet mode is steeper than other air-outlet modes, which shows the more obvious improving ability of heat dissipation performance along with the increased vehicle speed. In conclusion, when the ambient temperature is 20°C, the maximum temperature rising and temperature difference of battery pack are both decreased along with the increased vehicle speed, which meets the judgment of field synergy principle about raising speed value
Battery pack temperature data of different air-outlet modes at 20°C ambient temperature (°C).

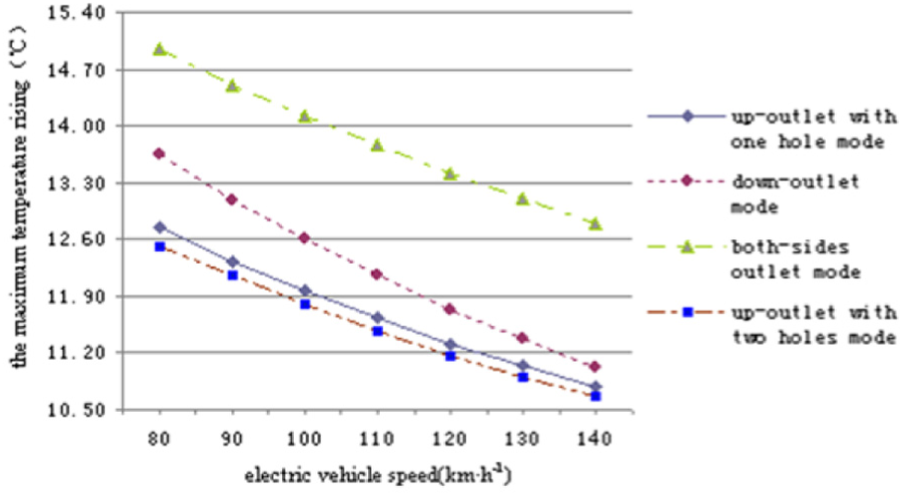
The maximum temperature rising comparison of difference air-outlet modes at 20°C.

The maximum temperature difference comparison of difference air-outlet modes at 20°C.
27°C ambient temperature
Thermal power of 55 Ah lithium-ion battery at 27°C
When the ambient temperature is 27°C, and the charge and discharge rate is 1C, Table 4 shows the average temperature rising and thermal power of 55 Ah lithium-ion battery. It shows that when the battery charges by 76 min, average temperature rising is 12.80°C. When the battery discharges by 60 min, average temperature rising is 14.73°C. Combining with the thermal physical parameters of 55 Ah lithium-ion battery, it could be obtained that the average thermal power is 4.36 W on charge processing, and 6.35 W on discharge processing, so the average thermal power on charge and discharge processing is 5.36 W.
Average temperature rising and thermal power of 55 Ah lithium-ion battery at 27°C ambient temperature.

Heat dissipation performance analysis of different air-outlet modes at 27°C
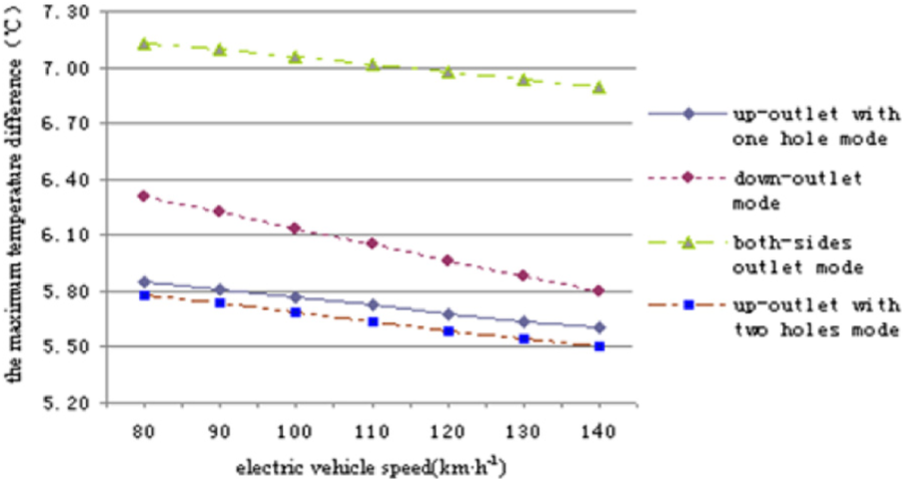
When the ambient temperature is 27°C, Table 5 shows the battery pack temperature data of different air-outlet modes, and Figures 18 and 19 show that the maximum temperature rising and temperature difference of battery pack are both decreased along with the increased vehicle speed. The change tendency of maximum temperature rising and temperature difference following speed are similar to 20°C. At different speeds, the order of maximum temperature rising and temperature difference of battery pack from low to high is as follows: up-outlet with two-holes mode, up-outlet with one-hole mode, down-outlet mode, and both-sides outlet mode. All curves change linear along with vehicle speed. When the speed is 80 km h−1, comparing with up-outlet with one-hole mode, down-outlet mode, and both-sides outlet mode, the maximum temperature rising of up-outlet with two-holes mode is, respectively, lower by 1.8%, 8.1%, and 16.4%, and the maximum temperature difference is, respectively, lower by 1.5%, 9.1%, and 19.9%; when the speed is 140 km h−1, comparing with up-outlet with one-hole mode, down-outlet mode, and both-sides outlet mode, the maximum temperature rising of up-outlet with two-holes mode is, respectively, lower by 0.6%, 2.8%, and 16.3%, and the maximum temperature difference is, respectively, lower by 1.4%, 6.1%, and 20.3%. In conclusion, when the ambient temperature is 27°C, the judgment of field synergy principle about raising speed value
Battery pack temperature data of different air-outlet modes at 27°C ambient temperature (°C).

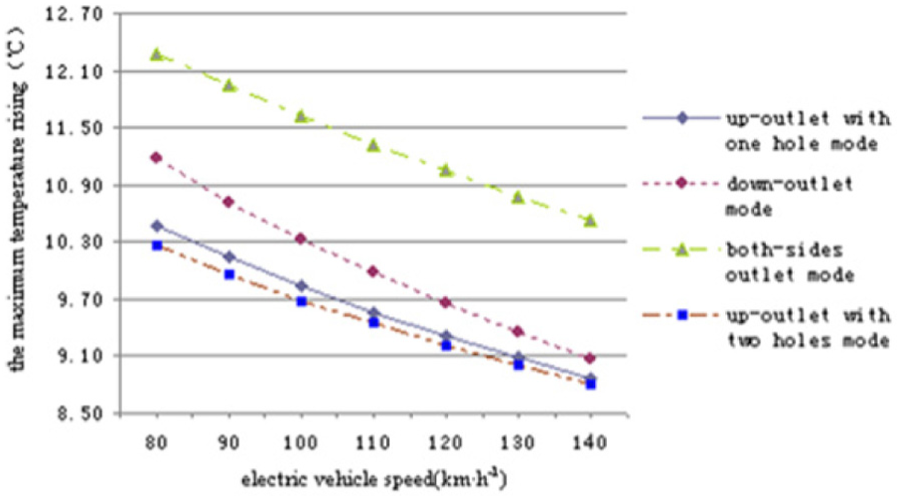
The maximum temperature rising comparison of difference air-outlet modes at 27°C.
The maximum temperature difference comparison of difference air-outlet modes at 27°C.
40°C ambient temperature
Thermal power of 55 Ah lithium-ion battery at 40°C
When the ambient temperature is 40°C, and the charge and discharge rate is 1C, Table 6 shows the average temperature rising and thermal power of 55 Ah lithium-ion battery. It shows that when the battery charges by 79 min, average temperature rising is 10.87°C. When the battery discharges by 62 min, average temperature rising is 13.80°C. Combining with the thermal physical parameters of 55 Ah lithium-ion battery, it could be obtained that the average thermal power is 3.56 W on charge processing, and 5.76 W on discharge processing, so the average thermal power on charge and discharge processing is 4.66 W.
Average temperature rising and thermal power of 55 Ah lithium-ion battery at 40°C ambient temperature.

Heat dissipation performance analysis of different air-outlet modes at 40°C
When the ambient temperature is 40°C, Table 7 shows the battery pack temperature data of different air-outlet modes, and Figures 20 and 21 show that the maximum temperature rising and temperature difference of battery pack are both decreased along with the increased vehicle speed. The change tendency of maximum temperature rising and temperature difference following speed are also similar to 20°C. When the speed is 80 km h−1, comparing with up-outlet with one-hole mode, down-outlet mode, and both-sides outlet mode, the maximum temperature rising of up-outlet with two-holes mode is, respectively, lower by 1.3%, 7.7%, and 16.1%, and the maximum temperature difference is, respectively, lower by 1.2%, 8.4%, and 18.9%; when the speed is 140 km h−1, comparing with up-outlet with one-hole mode, down-outlet mode, and both-sides outlet mode, the maximum temperature rising of up-outlet with two-holes mode is, respectively, lower by 0.5%, 1.8%, and 16.3%, and the maximum temperature difference is, respectively, lower by 2.0%, 5.2%, and 20.2%. In conclusion, when the ambient temperature is 40°C, the judgment of field synergy principle about raising speed value
Battery pack temperature data of different air-outlet modes at 40°C ambient temperature (°C).

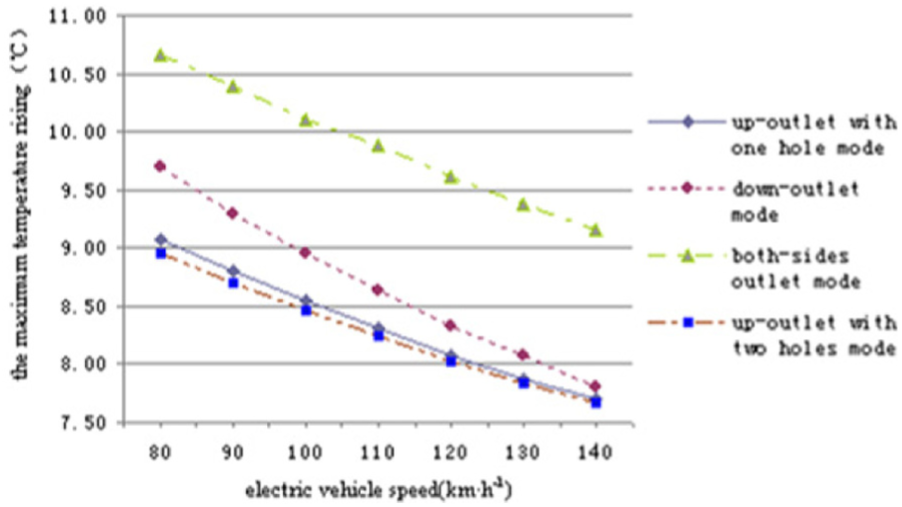
The maximum temperature rising comparison of difference air-outlet modes at 40°C.
The maximum temperature difference comparison of difference air-outlet modes at 40°C.
As considering all ambient temperatures (20°C, 27°C, and 40°C), the heat flow field characteristic analysis of electric vehicle power cabin and air-outlet mode choosing could be obtained by field synergy principle; it means that heat flow field synergy analysis of electric vehicle power cabin is not relevant to ambient temperature.
Heat dissipation performance comparison with different air-outlet modes and ambient temperatures
To study the changing ability of heat dissipation performance following the ambient temperature changing, this article compares the heat dissipation performance with different temperature and air-outlet modes. The up-outlet with one-hole mode is chosen as the reference, and Table 8 shows the heat dissipation performance of all air-outlet modes effected by ambient temperature changing. The order of battery pack maximum temperature rising and temperature difference from low to high is as follows: 40°C, 27°C, and 20°C, which means that high ambient temperature leads to the heat dissipation performance of all air-outlet modes closer to each other, and low ambient temperature is much better to reflect the air-outlet mode with good heat dissipation performance. As considering all ambient temperatures, the difference of maximum temperature rising and temperature difference between up-outlet with one-hole mode and down-outlet mode decreases along with the increased vehicle speed, which means that with the increased vehicle speed, the heat dissipation performance of down-outlet mode improves quickly.
Comparison with the battery pack temperature difference of air-outlet modes at different ambient temperatures (°C).

Design scheme of wind tunnel test
Vehicle wind tunnel and clay model
It could choose Tongji University vehicle wind tunnel as the test wind tunnel (as shown in Figure 22), which has the test capability including wind speed less than 200 km h−1, and ambient temperature from −20°C to 55°C. 1:1 clay model is made and the battery pack is arranged in the power cabin. Four air-outlet modes can be arranged on the side wall of power cabin (including up-outlet with two-holes mode, up-outlet with one-hole mode, down-outlet mode, and both-sides outlet mode); when one air-outlet mode starts, the other three air-outlet modes stops.
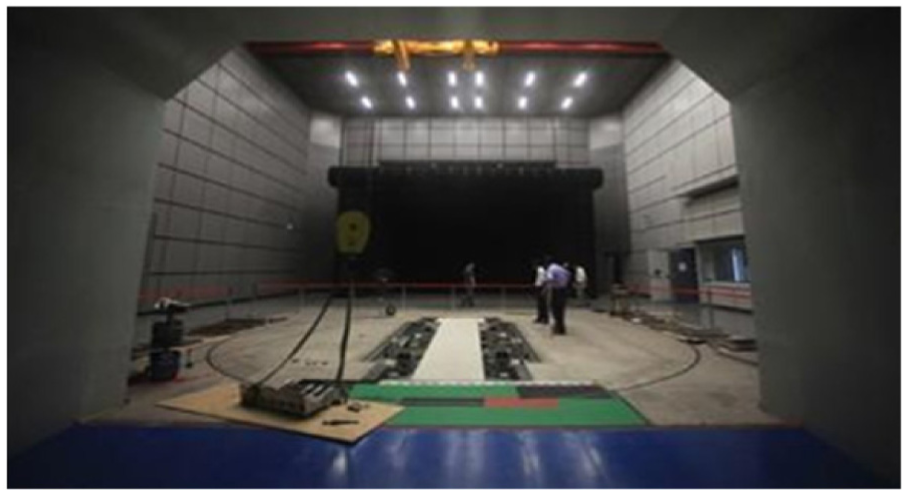
Vehicle wind tunnel.
Equipment and measuring points arranging
It could choose Digatron EVT 250-750-2*80 kW insulated gate bipolar translator (IGBT) as the charge and discharge equipment (as shown in Figure 23), which has the test capability including electric current less than 250 A, charge and discharge voltage both less than 750 V, it could meet the test requirement (when charge and discharge rate is 1C, the electric current is 110 A, charge and discharge voltage is 230.4 V).

Digatron EVT 250-750-2*80 kW IGBT.
It could choose Agilent 34970A as the temperature monitoring equipment (as shown in Figure 24), which has the test capability including temperature measurement precision reaching 0.001°C and the sampling interval setting to 10 s. Because the Agilent 34970A has a total of 20 channels and 2 channels should be as alternate selection, so there are 18 channels used to monitor the temperature of battery pack.

Agilent 34970A.
Charge and discharge processing
Test processing is 100% state of charge (SOC), including three charge and discharge cycles:
Constant current discharge: the electric current is 110 A, until voltage of any battery reaching 2.50 V cutoff;
Shelve 10 min;
Constant current and constant voltage charge: the electric current is 110 A, when the voltage of any battery reaching 3.65 V, it turns to constant voltage charge, until 5.50 A cutoff;
Shelve 10 min;
Circulating one to four steps for three times;
End.
Test content and data processing
As considering the cost and cycle of wind tunnel test, it divides into the basic test and selected test, and the wind speed is 100 km h−1. The ambient temperature of basic test is 27°C, and the charge and discharge rate is 1C with four different air-outlet modes; the ambient temperature of selected test 1 is 27°C, and the charge and discharge rate is 0.8C with four different air-outlet modes; the ambient temperature of selected test 2 is 27°C, and the charge and discharge rate is 1.2C with four different air-outlet modes.
The maximum temperature rising and temperature difference are calculated by the maximum and minimum temperature of battery pack.
Conclusion
Combining with simulation calculation and field synergy analysis method, it is rapid and accurate to choose the best air-outlet mode of electric vehicle power cabin:
Field synergy analysis method points out that under constant temperature gradient value
When the ambient temperatures are different (20°C, 27°C, and 40°C), the heat flow field characteristic analysis of electric vehicle power cabin and air-outlet mode choosing could be obtained by field synergy principle, so the heat flow field synergy analysis of electric vehicle power cabin is not relevant to the ambient temperature.
Temperature variation curve of down-outlet mode is steeper than other air-outlet modes, which shows the more obvious improving ability of heat dissipation performance along with the increased vehicle speed.
Footnotes
Appendix 1
Handling Editor: Jose Ramon Serrano
Declaration of conflicting interests
The author(s) declared no potential conflicts of interest with respect to the research, authorship, and/or publication of this article.
Funding
The author(s) disclosed receipt of the following financial support for the research, authorship, and/or publication of this article: This work was supported by National Natural Science Foundation of China (51505196), Jiangsu Provincial Natural Science Foundation of China (BK20140559), China Postdoctoral Science Foundation (2014M561582), and Jiangsu Province Postdoctoral Science Foundation (1302036B).