
Abstract
Link prediction aims to estimate the existence of links between nodes, using information of network structures and node properties. According to the characteristics of node mobility, node intermittent contact, and high delay of opportunistic network, novel similarity indices are constructed based on CN, AA, and RA. The indices CN, AA, and RA do not consider the historic information of networks. Similarity indices, T_CN, T_AA, and T_RA, based on temporal characteristics are proposed. These take the historic information of network evolution into consideration. Using historic information of the evolution of opportunistic networks and 2-hop neighbor information of the nodes, similarity indices based on the temporal-spatial characteristics, O_CN, O_AA, and O_RA, are proposed. Based on the imote traces cambridge (ITC) and detected social network (DSN) datasets, the experimental results indicate that similarity indices O_CN, O_AA, and O_RA outperform CN, AA, and RA. Furthermore, index O_AA has superior performance.
Keywords
Introduction
Opportunistic network (ON) 1 is a new type of network that is self-organizing and does not require complete connectivity, as communication between nodes is generated by their movement. The data transmission in ON occurs using a “store-carry-forward” routing mechanism. ON has an advantage in many applications compared to the established fully connected networks. Because of the development and low cost, ON has been applied across many fields, such as vehicular ad hoc networks, 2 mobile data diversion, 3 information sharing, 4 and mobile computing. 5
The dynamic characteristics of ON lead to a difficulty in the selection of routing. The point to solve the problem is to predict the link through capturing the change law of network topology so that routing algorithm is supported.
Link prediction is to predict the probability of connection between nodes at the next moment through node attributes, network topology, and network historical information. According to the characteristics of node mobility and intermittent connectivity, this article studies the similarity indices of link prediction. Section “Related work” analyzes the studied reported in the literature to date. Section “Problem description” identifies the problems associated with link prediction. Section “Improvement of similarity indices” constructs improved similarity indices. Section “Experiments and analysis” describes the experimental data and analysis. Section “Conclusion” makes conclusions.
Related work
The methods of link prediction for ON primarily fall into the following categories: predictions based on similarity indices, node moving models, mixed frameworks, matrix and tensor decompositions, and machine learning. The study of similarity indices can be divided into local information similarity indices and path similarity indices.
Based on local information similarity indices
The similarity indices based on local information calculate the similarity between nodes using the following local information, such as the degree of nodes and common neighbors. The method is suitable for large-scale network applications because of its lower computational complexity.
The simplest index is CN6,7 which means common neighbor. If there are many common neighbors between nodes x and y, the nodes x and y are similar, and the CN index is defined in equation (1)

where


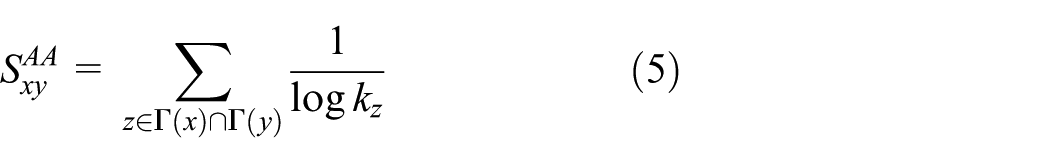
The Adamic/Adar (AA) index11,12 and resource allocation (RA) index13,14 take into account the degree of the common neighbors. The AA index considers that the contribution of the common neighbors with a small degree is bigger than the common neighbors with a large degree. According to the degree of the common neighbors, each node is given a weight, and AA is defined in equation (5)
The RA index is the same as the AA index, with the exception that the weight value of the RA index is equal to the reciprocal of the node degree, which is defined in equation (6)

The difference between the AA index and the RA index is the weight given to the common neighbor. If the network clustering coefficient is small, link prediction primarily depends on the existence of common neighbors between the nodes in the network, resulting in the prediction results of index AA and RA being similar. If the network clustering coefficient is big, and the heterogeneity is large, the two indices are significantly different because of the different methods of weighting. The literature15,16 suggests that the RA index is better in depicting the weighted network and community network.
The literature 17 analyzes the betweenness centrality of the nodes, in combination with the similarity index of CN. At the same time, considering the network topology features and local information of the nodes, and the optimization of the common neighbors weighting, it proposes an improved B-CN index to improve prediction accuracy. In the literature, 18 based on the AA index, it combines the frequency of connection among nodes with the degree of the common neighbors as the similarity index, and the characteristics of network history structure using kernel regression are extracted, improving the prediction accuracy of the link. Another study reported in the literature 19 is based on the AA index. This study proposes a hypothesis for network data flow regions and estimates the similarity among nodes using three stream-based methods. Three kinds of links have been proposed in the literature: 20 periodic and frequent connection, non-periodic but frequent connection, and non-frequent connection. The method of periodic pattern recognition mining, decision tree, and the AA index is used to predict the link. The prediction efficiency and accuracy of the link are improved by selecting the optimal threshold, jitter tolerance ratio, and the time slice length.
Based on path similarity indices
The similarity indices based on the path primarily fall into the following categories: local path (LP) index, 21 Katz index, 22 LHN-II index. 10
The local path similarity index adds the path information with length 3 to the index CN, which is defined in equation (7)

where
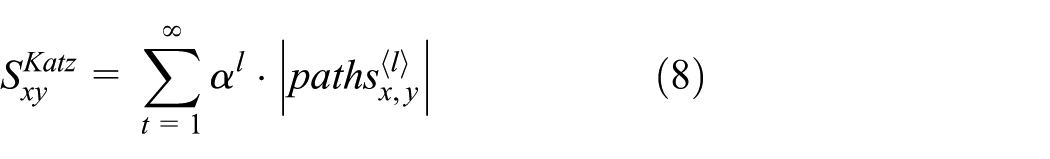
The Katz index considers the n-hop paths, and its computational complexity increases in sequence, which is defined in equation (8)
where

where
A link prediction algorithm based on matrix and tensor decomposition for intermittently connected wireless network has been proposed in the literature.
23
It uses Katz as an index to predict the existence of the link in time slice
Based on the regular equivalence, the LHN-II index has been proposed in the literature. 10 If the neighbors of node x are similar to node y, then nodes x and y are similar. That is, the similarity of the nodes is transitive. LHN-II index is defined as in equation (10)

where
Based on local information, similarity indices and path similarity indices show a good prediction performance for static networks or social networks with topology change slowly. However, these indices are not suitable for ON whose network topology changes over time. In this article, according to the characteristics of node mobility, node intermittent contact and high delay of ON, based on local information similarity indices, similarity indices based on temporal characteristics are proposed, which take the historic information of network evolution into account. Considering the 2-hop neighbor information of nodes, similarity indices based on spatial characteristics are calculated using the neighborhood expansion method. 24 Considering the temporal and spatial characteristics, similarity indices based on temporal-spatial characteristics are proposed, which can obtain better performance for link prediction in the ON.
Problem description
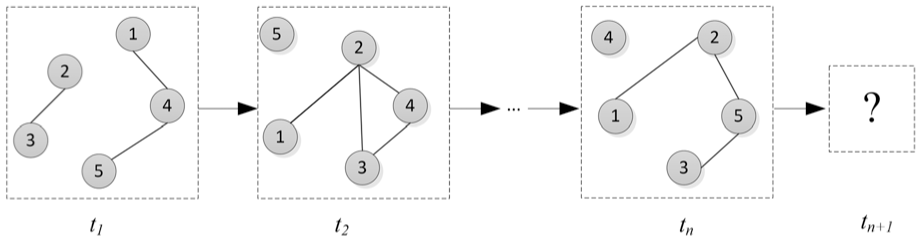
ON is a typical, dynamic network. The network structure changes over time and it is characterized by a sequence of graphs. To depict the dynamic characteristics of ON, the ON is defined as
Link prediction of ON is to predict the network topology at time
ON link evolution.
In equation (11),

The similarity indices based on local information assume that the two frequent communication nodes have highly similarity of behavior in the network, which conform to the communication characteristics of ON.
Improvement of similarity indices
Based on the local information similarity indices, this article proposes improved similarity indices using the temporal, spatial, and temporal-spatial characteristics of ON.
The temporal characteristics of similarity indices
Indices CN, AA, and RA have good performance for link prediction with network topology change slowly. However, ON’s topology changes frequently and link status is time-varied. Therefore, similarity indices are improved by taking the historic information of network evolution into account.
As shown in Figure 2, the network structure at time

Link change.
Based on the local information similarity indices CN, AA, and RA, improved similarity indices T_CN, T_AA, and T_RA are proposed, which take the following historic information of the network into account, such as the total length of contact time, the frequency of contact, and the most recent contact time in the evolution of network topology.
As shown in Figure 3, the length of T time slice

Temporal characteristic of link.
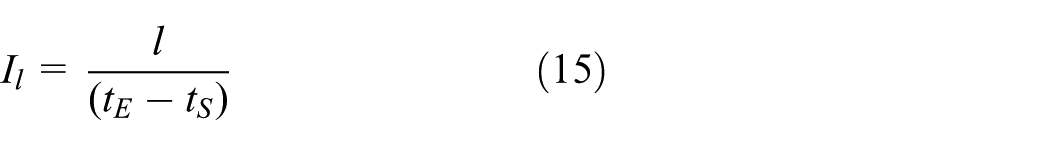
1. The total length of contact time
In equation (12), l denotes the total length of contact time, which is defined below

where
2. The frequency of contact
In equation (13), f denotes the frequency of contact, which is defined below

where
3. The most recent contact time
c is the most recent contact time. As shown in Figure 3, the contact frequency of node pair
The above analysis suggests that the influence coefficient of the time parameters on the link is defined in equation (14)

As an example of node pair
where

where

This article combines the influence coefficient of the time parameters on the link with the indices CN, AA, and RA. Based on temporal characteristics, improved similarity indices T_CN, T_AA, and T_RA are proposed, which are defined in equations (18)–(20)


ON has a complex topology which changes frequently over time. Improved similarity indices of T_CN, T_AA, and T_RA consider the similarities of network structure and network history information of the link, which predicts the links in the ON effectively.
The spatial characteristics of similarity indices
In the ON, node mobility and intermittent contact lead to the network sparse. In a specific time slice, only a few node pairs are connected, and the spatial structure information is insufficient, leading to low accuracy of link prediction. To address the problem, the method of the neighborhood expansion 24 has been proposed. The 2-hop neighbor information of the nodes can improve the indices of CN, AA, and RA.
The network is sparse, and its computational complexity increases as the number of neighbors increases. This article only considers the nodes with 1-hop neighbors and the nodes with 2-hop neighbors.
For arbitrarily node x, we define the 1-hop neighbors in equation (21)

where

The parameters


where the range of
The temporal-spatial characteristics of similarity indices
Similarity indices based on temporal characteristics take the historic information of network evolution into account, whereas similarity indices based on spatial characteristics consider the network spatial structure. Considering the historic information of ON evolution and 2-hop neighbor information of nodes, similarity indices based on temporal-spatial characteristics O_CN, O_AA, and O_RA are proposed.
According to equation (18)–(20) and (23)–(25), O_CN, O_AA, and O_RA are proposed, which are defined in equations (26)–(28)
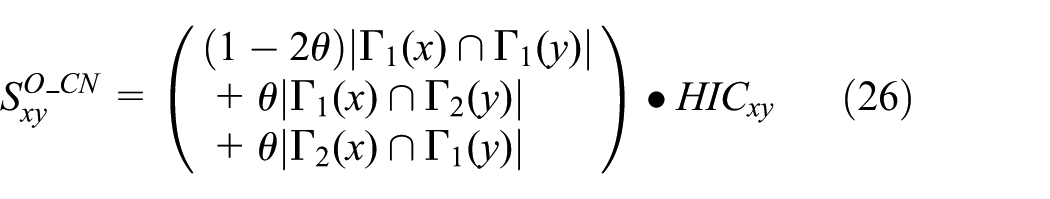
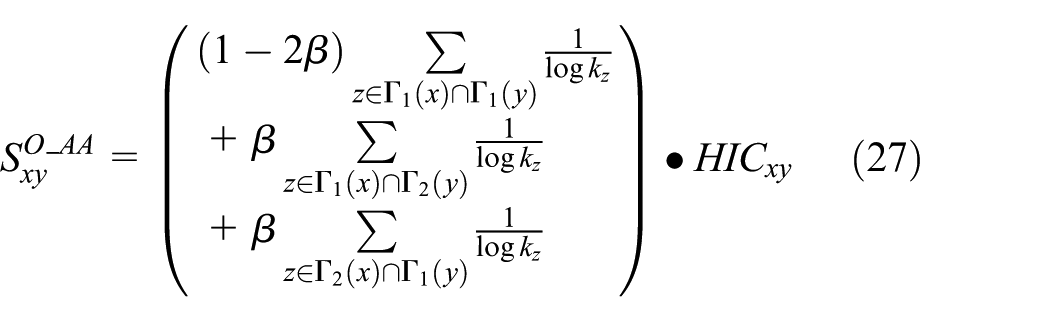

where the range of
Experiments and analysis
In this article, the area under the receiver operating characteristic curve (AUC) and precision of the receiver operating characteristic curve (ROC) are adopted as evaluation indices. In the different datasets, comparison experiments are used to verify the improved similarity indices.
Experimental datasets
The representative real trace datasets imote traces cambridge (ITC) and detected social network (DSN) are selected for the experiments. ITC is a dense dataset, which records the movement and interconnection of students on campus. DSN is a sparse dataset, which records network communication on campus scenes (Table 1).
Information of datasets.

The ITC dataset records a 12-day visual trace of students on the Cambridge University campus. The experiment collects the movement trajectories and interconnection using 50 mobile iMote devices. The dataset is short duration and intensive data. A series of network snapshots of 2 days are selected from the ITC dataset, as shown in Figure 4.
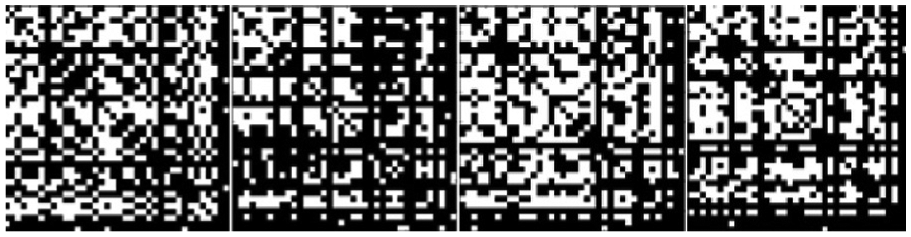
Snapshots of ITC.
The DSN dataset records 79 days of data of students on the St Andrews campus. The experiment collects communication over a wireless network using 27 mobile tMote devices. This dataset is longer and sparse data. A series of network snapshots of 2 days are selected from DSN dataset, as shown in Figure 5.

Snapshots of DSN.
Experimental environment
MATLAB integrates many powerful functions such as numerical analysis, matrix calculation, scientific data visualization, modeling, and simulation of nonlinear dynamic system into an easy-to-use Windows environment. In this article, MATLAB is used to conduct comparative experiments on the similarity index between the indices CN, AA, and RA and the improved similarity indices. In total, 80% for training and 20% for testing are used in the ITC and DSN datasets.
Experimental results and analysis
In the ITC and DSN datasets, the improved similarity indices are compared to the indices CN, AA, and RA, and O_CN, O_AA, and O_RA are also compared.
Comparison with indices CN, AA, and RA
The AUC and precision are adopted to evaluate the performance of these similarity indices.
1. Comparison with index CN
In the ITC and DSN datasets, the different length of time slices is intercepted. The AUC and precision of CN, T_CN, E_CN, and O_CN are calculated. The results are shown in Figures 6–9.
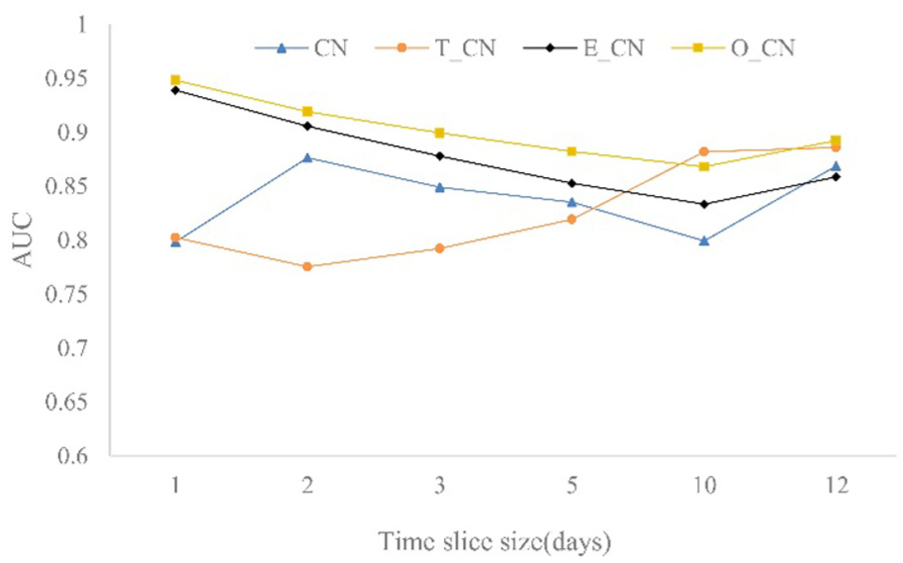
AUC comparison of CN and improved similarity index in ITC dataset.

AUC comparison of CN and improved similarity index in DSN dataset.

Precision comparison of CN and improved similarity index in ITC dataset.
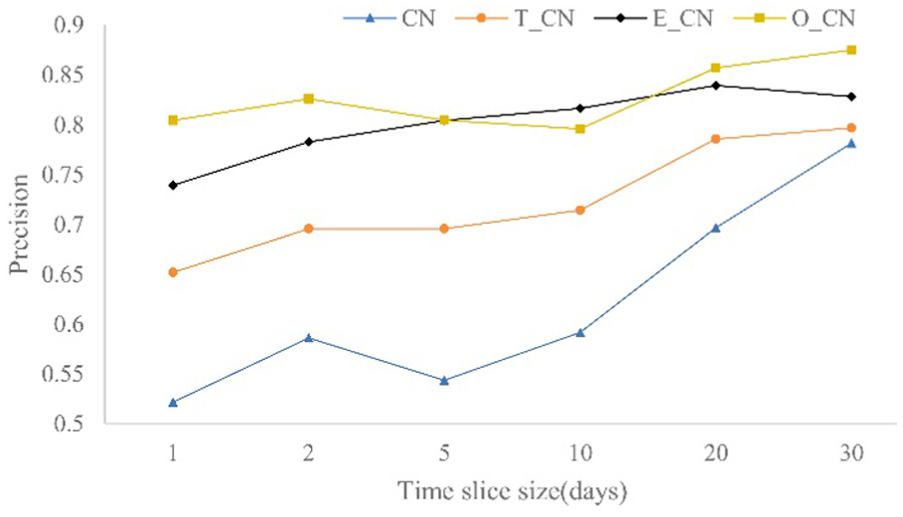
Precision comparison of CN and improved similarity index in DSN dataset.
From Figures 6 to 9, it shows that the prediction accuracy of indices CN, E_CN, and O_CN decreases with the increase in the time slice in the ITC dataset. And the prediction accuracy of four indices increases with the increase in the time slice in the DSN dataset.
The prediction accuracy of T_CN index increases with the increase in the time slice in ITC and DSN datasets, which indicates that the T_CN index is less affected by the degree of network. E_CN has little effect on the similarity of nodes in sparse networks, but has a significant effect in dense networks. In general, compared with the CN index, the similarity indices T_CN, E_CN, and O_CN have better performance, and the prediction accuracy of O_CN is greatest.
2. Comparison with index AA
In the ITC and DSN datasets, the different length of time slices is intercepted. The AUC and precision of AA, T_AA, E_AA, and O_AA are calculated. The results are show in Figures 10–13.

AUC comparison of AA and improved similarity index in ITC dataset.

AUC comparison of AA and improved similarity index in DSN dataset.

Precision comparison of AA and improved similarity index in ITC dataset.

Precision comparison of AA and improved similarity index in DSN dataset.
From Figures 10 to 13, it shows that the prediction accuracy of indices AA, E_AA, and O_AA decreases with the increase in the time slice in the ITC dataset. And the prediction accuracy of four indices increases with the increase in time slice in the DSN dataset.
The prediction accuracy of T_AA index increases with the increase in the time slice in the ITC and DSN datasets, which indicates that the T_AA index is less affected by the degree of network. E_AA has little effect on the similarity of nodes in sparse networks, but has a significant effect in dense networks. In general, compared with the AA index, the similarity indices T_AA, E_AA, and O_AA have better performance, and the prediction accuracy of O_AA is greatest.
3. Comparison with index RA
In ITC and DSN datasets, the different length of the time slices is intercepted. The AUC and precision of RA, T_RA, E_RA, and O_RA are calculated. The results are shown in Figures 14–17.
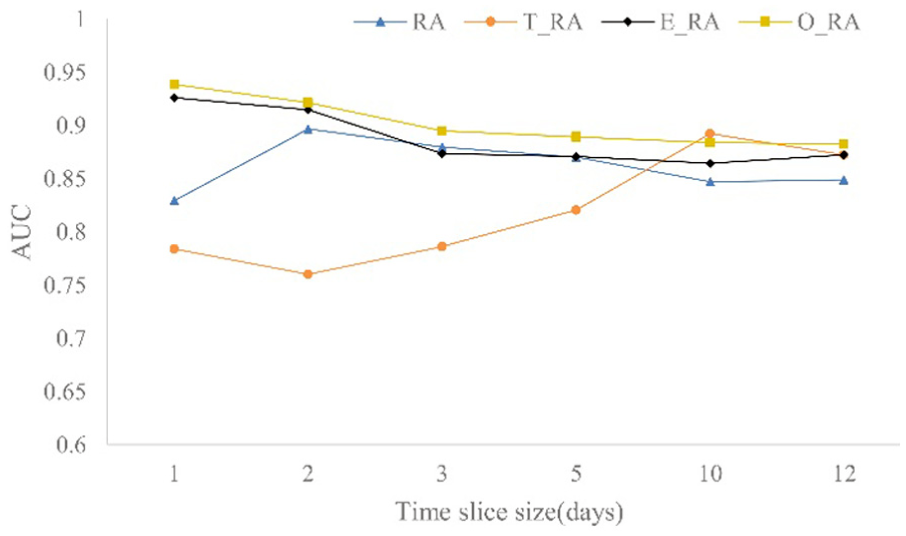
AUC comparison of RA and improved similarity index in ITC dataset.

AUC comparison of AA and improved similarity index in DSN dataset.

Precision comparison of RA and improved similarity index in ITC dataset.

Precision comparison of RA and improved similarity index in DSN dataset.
From Figures 14 to 17, it shows that the prediction accuracy of indices RA, E_RA, and O_RA decreases with the increase in the time slice in the ITC dataset. The prediction accuracy of four indices increase with the increase in the time slice in the DSN dataset.
The prediction accuracy of T_RA index increases with the increase in the time slice in the ITC and DSN datasets, which indicates that the T_RA index is less affected by the degree of network. E_RA has little effect on the similarity of nodes in sparse networks, but has significant effect in dense networks. In general, the similarity indices T_RA, E_RA, and O_RA have better performance compared to the RA index, and the prediction accuracy of O_RA is greatest.
The above experiments suggest that the improved similarity indices perform better in ITC and DSN datasets, comparing to the indices CN, AA, and RA. Particularly, the similarity indices O_CN, O_AA, and O_RA have the best performance.
Comparison with indices O_CN, O_AA, and O_RA
In the ITC and DSN datasets, the different length of time slices is intercepted, and the AUC and precision of O_CN, O_AA, and O_RA are calculated. The results are shown in Figures 18–21.

AUC comparison of similarity index in ITC dataset.

AUC comparison of similarity index in DSN dataset.
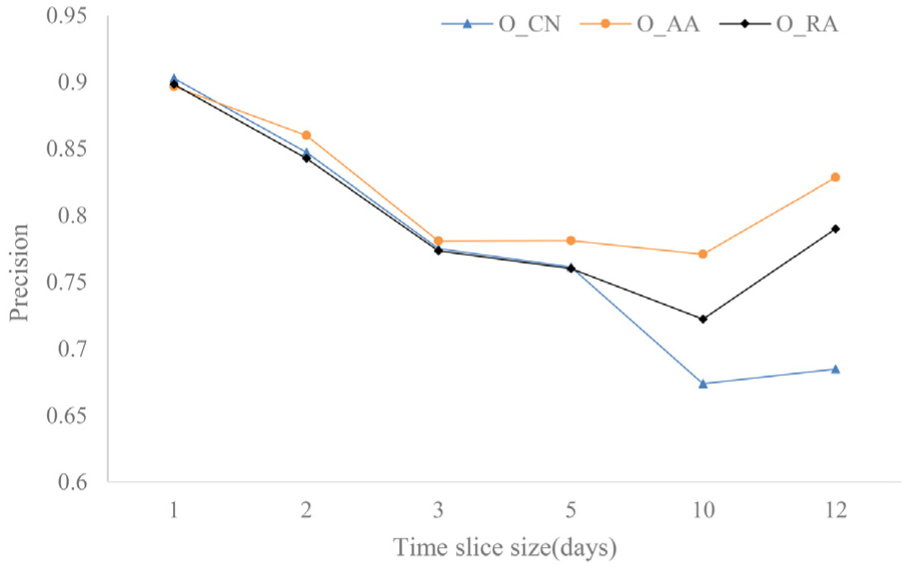
Precision comparison of similarity index in ITC dataset.

Precision comparison of similarity index in DSN dataset.
From Figures 18 to 21, the AUC and precision of O_AA index are better than O_CN, O_RA in the ITC and DSN datasets. Therefore, in the ON, the O_AA index has the superior performance.
Finally, based on the above experimental results, we can conclude that the similarity indices O_CN, O_AA, O_RA are superior to CN, AA, and RA, and the index O_AA is the best in the ON.
Conclusion
In this article, the similarity indices for link prediction of ON are analyzed. According to the temporal-spatial characteristics of ON, improved similarity indices are proposed, which outperform the indices CN, AA, and RA. Furthermore, index O_AA has the superior performance. The primary works in this article are as follows: (1) analyzing the similarity indices based on local information and on path, (2) describing an ON model and defining its network snapshots, (3) proposing similarity indices based on the temporal characteristics, T_CN, T_AA, and T_RA, which take historic information of network evolution into account, (4) proposing similarity indices based on the temporal-spatial characteristics, O_CN, O_AA, and O_RA, which consider the historic information of ON evolution and 2-hop neighbor information of the nodes, and (5) verifying these similarity indices using ITC and DSN datasets.
The shortcomings of this research are time slice segmentation and weight parameters based on temporal-spatial characteristic similarity indices. Therefore, the future research directions include (1) the method of time slice segmentation, and the appropriate time slice improves the accuracy of the similarity indices and (2) the selection of weight parameters. The appropriate weight parameters make the similarity indices represent the similarity between nodes more property.
Footnotes
Handling Editor: Nicolas Garcia-Aracil
Declaration of conflicting interests
The author(s) declared no potential conflicts of interest with respect to the research, authorship, and/or publication of this article.
Funding
The author(s) disclosed receipt of the following financial support for the research, authorship, and/or publication of this article: This work was supported by the National Natural Science Foundation of China (61762065,61363015, 61262020), the Natural Science Foundation of Jiangxi Province (20171ACB20018, 20171BAB202009, 20171BBH80022), and the Innovation Foundation for Postgraduate Student of Jiangxi Province (YC2017-S344).