
Abstract
The development of potential failure mode analysis and risk analysis has greatly improved the state-of-practice for the safety of dams. Risk analysis are well developed in many industries (such as building design, medicine, and insurance) and has greatly advanced in the dams industry over the last 40 years. Engineers and scientists are now deeply investigating and thinking about failure mechanisms associated with operating dams and the probabilities of dam failures. As such, the condition of dams and the risks associated with their operation are now being portrayed better than ever before to dam safety officials and decision-makers. Accurate and adequate risk analyses for a portfolio of dams is extremely important in today’s environment to manage limited budgets and potentially save (or redirect) expensive rehabilitations to identified and critical needs. The goal is to reduce risks of a portfolio of dams in an efficient and cost-effective manner. This article provides a review on risk-based dam terminology and bridging the semi-quantitative and numerical simulation. Moreover, a review of the current state-of-practice for prioritizing a large portfolio of dams subjected to seismic loadings and potential risks is provided. As a potential application, the seismic risk of the 18 dams (which have been experienced relatively large earthquakes) all over the world is evaluated. The semi-quantitative approach is contrasted with finite element model for one of the selected dams.
Introduction
As of 2017, more than 90,580 dams operate across the United States, which makes hydropower the biggest source of renewable energy. The US Army Corps of Engineers (USACE) National Inventory of Dams (NID) defines three hazard category for dams: low, significant, and high. Figure 1 illustrates this classification for all the country’s dams. It also shows the fast growth of high-hazard dams in need of remediation from 2001 to 2009. Moreover, the Federal Emergency Management Agency (FEMA) reported a total of 15,500 high-hazard dams as of 2016 in the United States. 2
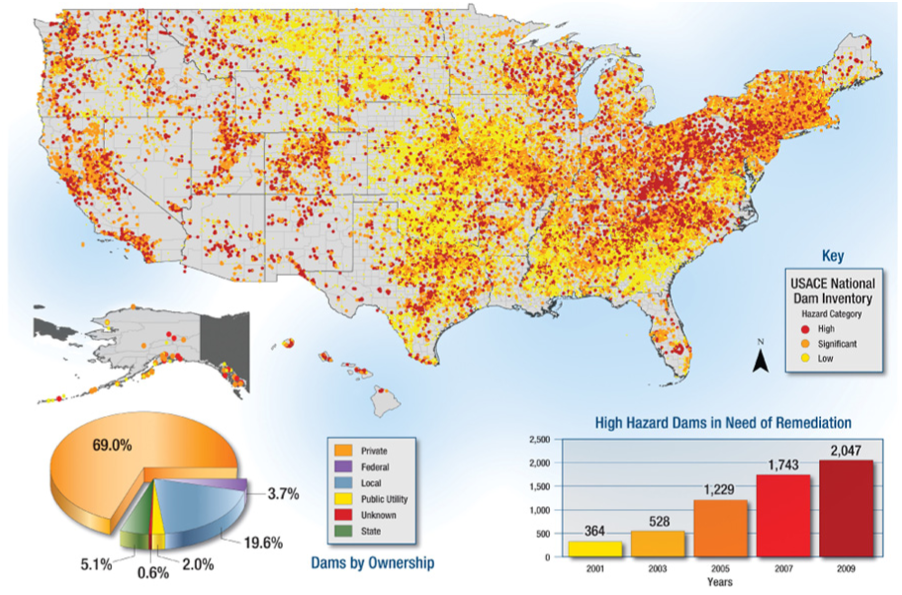
Classification of US dams by how hazardous they are; adopted from Federal Emergency Management Agency. 1
According to the 2017 American Society of Civil Engineers (ACSE), the average age of dams in the United States is over 56 years old, and by 2025, 70% of dams will be more than 50 years old. The Association of State Dam Safety Officials (ASDSO) estimates that the nation’s non-federal and federal dams will require a combined total investment of US$64 billion for rehabilitation. Given the limited budget for repair and maintenance, national infrastructures require a comprehensive emergency action plan for assessment of dam safety.3,4
There have been already several attempts in order to prioritize the decision-making methodologies in dam safety. For example, Harrald et al. 5 categorized a series of methods as follows: (1) preliminary hazard analysis, (2) preliminary risk analysis, (3) what-if/checklist analysis, (4) failure modes and effects analyses, (5) hazard and operability analysis, (6) fault tree analysis, (7) event tree analysis, (8) relative ranking/risk indexing, (9) coarse risk analysis, (10) Pareto analysis, (11) root cause analysis, (12) change analysis, (13) common cause failure analysis, and (14) human error analysis.
Different levels of risk assessments can be implemented on a portfolio of dams. A portfolio is a group of dams for which a single owner or regulator is responsible for. 6 Qualitative, semi-quantitative, and fully quantitative techniques have been introduced for dam safety risk management.
A semi-quantitative method is introduced by International Commission on Large Dams (ICOLD) 7 and Bureauand and Ballentine 8 which is mainly based on a statistical model on the historical data. They compiled the performance of the dams during the past earthquakes between 1900 and 2001. The information of over 350 dams worldwide were gathered mainly from US Committee on Large Dams (USCOLD)9,10 (note that the 3rd volume of this report is published as US Society on Dams (USSD) 11 which can be used to update the data and empirical models). This method quickly rates the total seismic risk of the dam at a particular site. This method was originally used for the dams in South Carolina (in United States) and its neighbor states. 12 Due to its simplicity, it is adopted by different researchers to provide a general (yet comprehensive) evaluation of dams in different countries such as Turkey,13,14 India, 15 South Africa, 16 and Argentina. 17 Moreover Chen and Lin, 18 developed a method for total risk analysis of dams under the flood hazard. All the steps are similar to the seismic hazard proposed by Bureauand and Ballentine; 8 however, they altered all the parameters properly for the flood hazard.
On the other hand, there have been proposed many techniques for quantification of risk in dam failure analysis. Cheng et al. 19 recommended using the probabilistic methods for safety analysis of US dams. Bowles 20 advocated for employing the quantitative risk analysis (QRA) to solve the dam safety problems. Furthermore Bowles et al., 21 compared the standard- and risk-based dam safety evaluations in the context of comprehensive risk management. Kostov and colleagues22,23 developed a model for quantitative seismic risk of two concrete gravity dams and one arch dam using a detailed finite element model (FEM).
Bowles and colleagues6,24 explored the concept of portfolio risk assessment (PRA) of dams. This method is based on the overall business context and objectives for PRA, agreement on the business requirements, engineering and risk assessment of dams, evaluating the risk reduction alternatives, and integrating dam safety results into business risk. Chauhan and Bowles 25 proposed a framework for uncertainty analysis in dam safety risk assessment including some useful features such as the confidence level associated with meeting tolerable risk guidelines.
Different computer programs were developed to facilitate dam safety risk analysis: risk assessment methodology dams (RAM-D) SM by Matalucci, 26 risk analysis and prioritization of dams in Italy by Meghella and Eusebio, 27 LIFESim by Bowles and Aboelata, 28 and DAMRAE-U by Srivastava et al. 29
Smith 30 developed a technique for dam risk analysis based on Bayesian networks, which allows to account for the inter-relations between the failure mechanisms, the uncertainties, and the expert judgments. Serrano-Lombillo et al. 31 developed a model to calculate the incremental risks at the dams in the context of an event tree analysis. Su and Wen 32 combined the risk analysis with fuzzy mathematics to evaluate the stability of concrete dams. Cloete et al. 33 proposed the rational quantitative optimal approach, which was a robust risk evaluation model to produce a definitive result for the risk mitigation at dam site. Finally, Serrano-Lombillo et al. 34 proposed a risk reduction indicator which allows to prioritize the sequences of investments while maintaining an equilibrium between equity and efficiency principles.
In this review article, a semi-quantitative technique is reviewed and revised for seismic risk prioritization of a large portfolio of dams. All the dam- and reservoir-dependent parameters as well as the downstream risk parameters are accounted for. The parameters involved in damage and loss analysis are contrasted with those recommended in performance based earthquake engineering (PBEE), 35 and the necessary adjustments are applied. Subsequently, a hierarchical review is provided on the different numerical simulation techniques for high-hazard dams.
Review of dam safety terminology
The first step in any state-of-the-art review article is to define a unified terminology. 36 This section briefly discusses the differences and similarities among six widely-used concepts in seismic analysis of infrastructures. Some of these concepts have a root in Pacific Earthquake Engineering Research (PEER) Center PBEE methodology, 37 some others in potential failure mode analysis (PFMA), 38 and others in general earthquake engineering.
Reliability
In reliability analysis, the failure probability,

where R and S are resistance and stressor, respectively;
Hazard
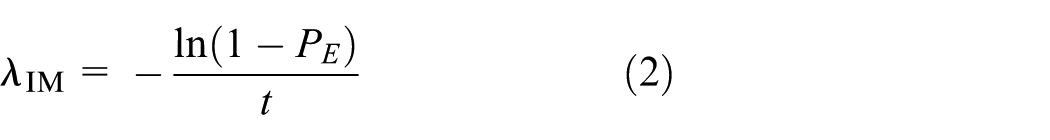
Seismic hazard refers to an uncertain relationship between some level of seismic intensity measure (IM) and the frequency or probability of a particular location experiencing at least that level of excitation.
43
Usually, a probabilistic seismic hazard analysis (PSHA) is performed to derive the hazard curve. It expresses a plot where the horizontal axis is the IM at a site, and the vertical one is annual frequency of exceedance,
where

Comparison of different terminologies involved in safety assessment of concrete dams: (a) reliability, (b) hazard, (c) risk, (d) fragility, (e) vulnerability, and (f) resilience.
Risk
In the context of the dam safety, risk can be defined as “Measure of the probability and severity of an adverse effect to life, health, property, or environment. In the general case, risk is estimated by the combined impact of all triplets of scenario, probability of occurrence and the associated consequence.” 45 Risk can be quantified as 46

where
Risk assessment is the process of deciding whether existing risks are tolerable and if not, whether alternative risk control measures are justified or will be implemented. 47 Tolerable risk means different things to different people and organizations. Some focus on economic risks to their company or organization (e.g. insurance, offshore oil, and gas) while others focus on loss of life. 4 Most of the technical codes4,47–49 use a so-called “risk curve” (either in the form of f-n or F-N chart). 50 An example of Canadian Dam Association (CDA), 49 societal risk guideline is shown in Figure 2(c) (where ALARP stands for “as low as reasonably practicable”).
Fragility
Fragility is a continuous function showing the probability of exceedance of a certain LS for a specific level of ground motion IM, im,51,52Figure 2(d)

where D is the demand parameter and
Fragility analysis is one of the main steps in PBEE 37 and can be derived from analytical simulations, experimental data, or expert opinion. The fundamentals of fragility analysis of concrete dams can be found in the work of Hariri-Ardebili 53 with a comprehensive state-of-the-art literature review by Hariri-Ardebili and Saouma. 54
Vulnerability
Vulnerability is different from fragility. 43 The former measures loss (in terms of dollars, deaths, and downtime), while the latter measures probability. A vulnerability curve expresses the loss as a function of IM. Three major types of vulnerability curves are
Measuring repair cost: in such a case the repair cost is normalized by the replacement cost new and is called damage factor. The expected value of damage factor conditioned on IM parameter is called mean damage factor, Figure 2(e).
Measuring life safety: in such a case, the number of casualties is normalized by the number of indoor occupants and expressed as a function of IM parameter.
Measuring downtime: it is measured in terms of fraction of a year during which the structure cannot be used.
Resilience
Community resilience is the ability to prepare and plan for, absorb, recover from, and more successfully adapt to actual or potential adverse events.
55
Cimellaro et al.
56
define resilience as a normalized function indicating capability to sustain a level of functionality or performance,

where
Next, this article reviews the most important qualitative, semi-quantitative, and quantitative approaches in the context of risk-based safety assessment of dams. Harrald et al. 5 discuss several tools and categorized them as
Dam safety risk assessment, for example, risk-based profile system (RBPS);
Dam safety priority indexing, for example, technical priority rating (TPR) and condition indexing (CI);
Dam safety risk assessment and priority indexing, for example, PRA and CI;
Dam security risk (and vulnerability) assessment, for example, RAM-D and the Electric Power Research Institute (EPRI) tool.
USBR qualitative risk analysis
The US Department of the Interior Bureau of Reclamation (USBR) RBPS was developed in 1997, which could be used to characterize the risk associated with individual loading conditions or sums the total risk imposed by a given structure. 59 The “Failure Index” (FI) is the foundation of RBPS, in which the dam is assessed by assigning a maximum of 1000 points based on four categories: static (300 points); hydrologic (300 points); seismic (300 points); and operation, maintenance, and safety (100 points). The higher the point total, the greater the potential risk. To determine the FI, a series of worksheets need to be completed which address the full range of loading and physical conditions of the dam.
The FI is further multiplied by a loss of life factor (LoLF) to characterize the consequences associated with a failure and is called the “Risk Index” (RI). The LoLF is determined based on several factors including the total population at risk, the location of this population below the dam, the severity of the flooding, and the severity of the failure mode. The RI is calculated separately for each category of FI and then summed to represent the total RI. 59
The final scoring for any particular dam is calculated by comparing its score to the highest score found for all the dams in Reclamation’s inventory, expressed as a percentage. This is a deterministic method based on qualitative assessment and heavily depends on the failure modes analysis. It falls under index prioritization approach category because the ranking is based on the calculated indices from a combination of weights, which are assigned to capture various attributes of dam safety deficiencies. 5 This technique is more suitable for initial screening of a portfolio of dams or a comparison to other forms of risk analysis.
USACE-USBR semi-QRA
The semi-quantitative risk analysis (SQRA) is a joint effort by USACE and USBR to establish a methodology for some projects at the beginning of an Issue Evaluation Study (IES) to re-evaluate the incremental risk and urgency of action. 4 This approach is mainly built on four concepts: (1) failure likelihood, (2) consequences, (3) confidence level, and (4) risk matrix. First each of those three is briefly described, then the step-by-step procedure for SQRA is discussed.
Failure likelihood categories
The following failure likelihood categories and descriptors were proposed for SQRA in dam safety: 4
Remote: the annual failure likelihood is more remote than
Low: the annual failure likelihood is between
Moderate: the annual failure likelihood is between
High: the annual failure likelihood is between
Very high: the annual failure likelihood is greater than
Consequences categories
In the USACE-USBR SQRA, the failure consequences is typically evaluated using potential life loss, with the idea that the broader socio-economic, environmental, and property damages would be generally commensurate. The following broad consequence categories are used for SQRA: 4
Confidence level
The confidence level that the evaluating team has in the previous categories, should be determined using the following qualitative descriptors: 4
High: the team is confident in the order of magnitude for the assigned category.
Moderate: the team is relatively confident in the order of magnitude for the assigned category.
Low: the team is not confident in the order of magnitude for the assigned category, and it is entirely possible that additional information would change the estimate.
Risk matrix
The risk matrix simply represents the relationship between the failure likelihood and incremental consequences (Figure 3). The “Annualized Life Loss” (i.e. social risk) is represented by the diagonal dashed line, while the “Annual Probability of Failure” (i.e. individual risk) is represented by the horizontal dashed line. The identified potential failure modes (PFMs) are supposed to fill a particular cell (e.g. PFM1 with yellow box) or even cross several cells (e.g. PFM2 with green box), refer Figure 3.

USACE-USBR incremental risk matrix; adopted from USACE-USBR 4
SQRA procedure
The following steps summarize SQRA: 4
Review basic statistics and key features of the dam.
Review normal operating condition loadings.
Review available seismic hazard curves, more specifically the ground motions associated with
Review inundation studies including probable impacts to downstream dams, roads, bridges, and so on.
Develop the PFM.
Develop the factors making the PFM more likely and less likely to occur.
Elicit failure likelihood categories from each team member, along with the reasoning behind their estimate.
The facilitator or designated recorder captures the information, including the likelihood category and the rationale for its assignment (including the confidences).
A similar elicitation process is repeated to arrive at a consequence category for each PFM.
Semi-quantitative seismic ranking of dam portfolio
As it is stated in “Introduction” section, a semi-quantitative method is introduced by Bureauand and Ballentine
8
on the basis of some initial risk analysis metric published in ICOLD.
7
In this empirical method, various risk factors and different weights are incorporated in total risk factor,
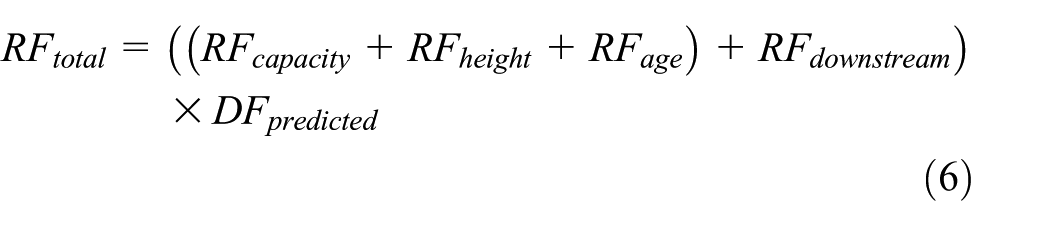
where RF refers to the risk factor. The first three terms include the dam-dependent factors (i.e. capacity, height, and age), while
Three factors quantify the risk of a dam and the reservoir and are shown in Figure 4(a)–(c). Each of the plots include the original proposed threshold, as well as the updated and smoothed versions.
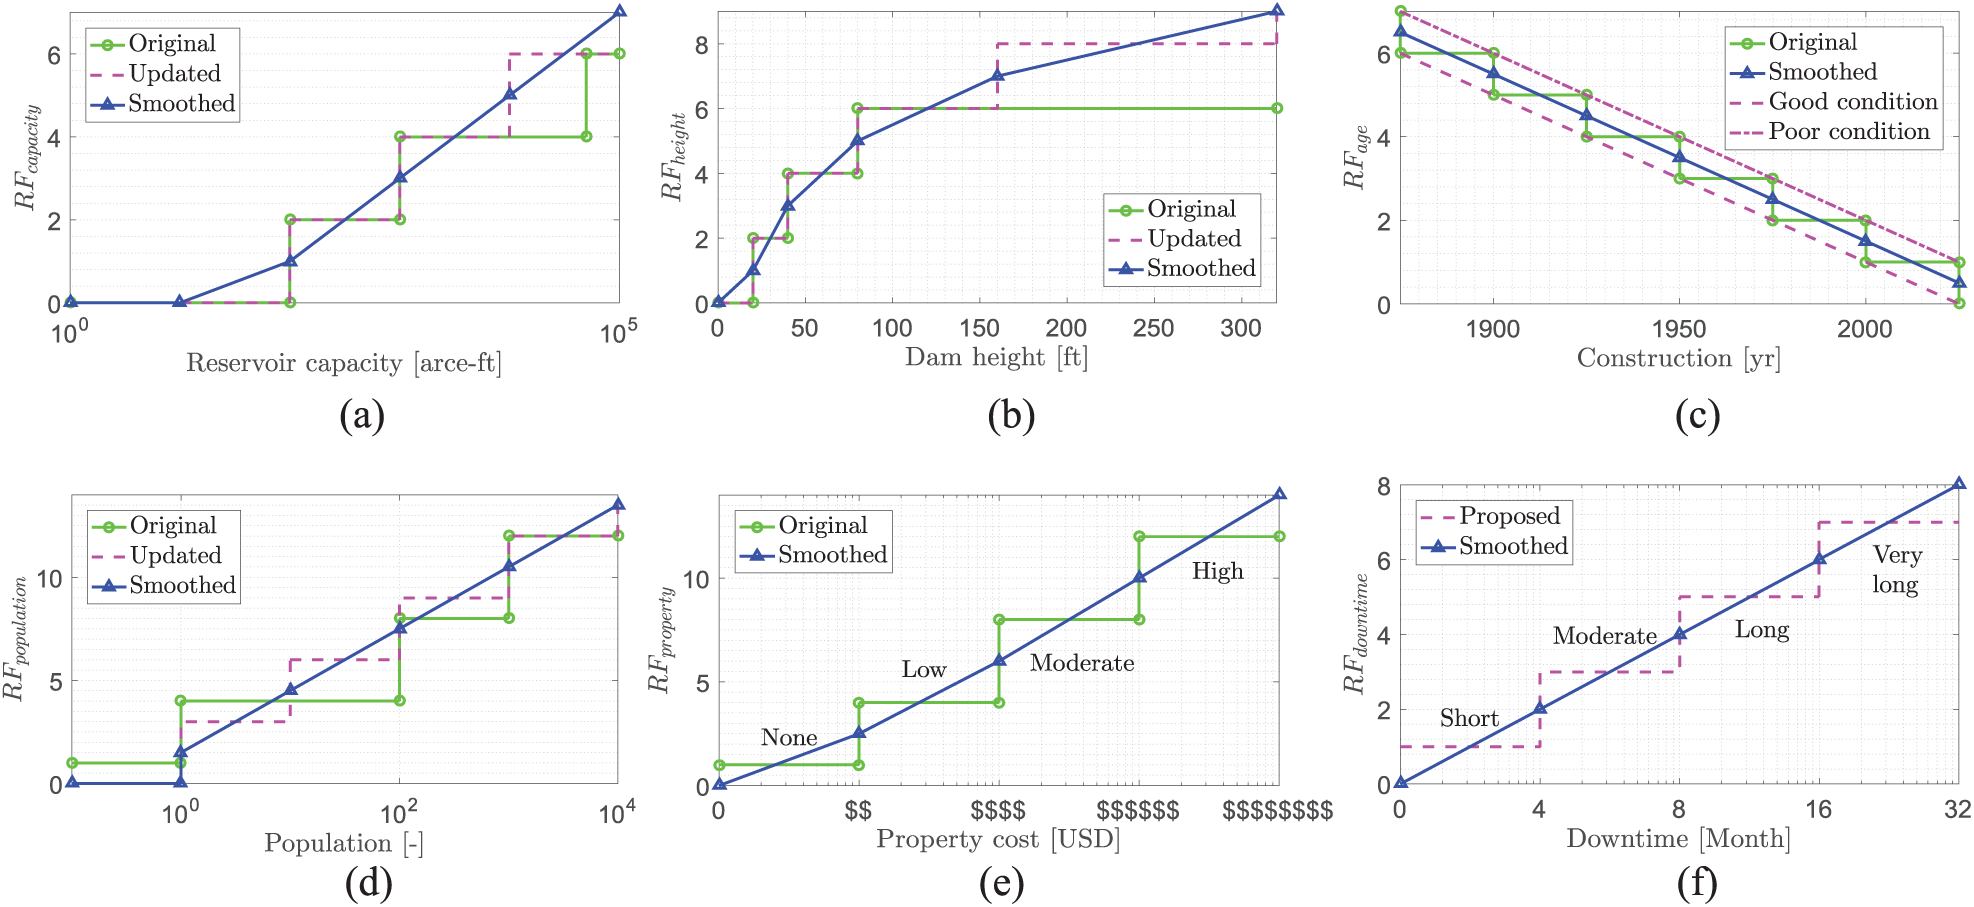
Quantification of dam-dependent and downstream risk factors: (a) reservoir capacity factor, (b) dam height factor, (c) age and construction factor, (d) evacuating population factor, (e) property cost factor, and (f) downtime factor.
On the other hand, the overall downstream risk factor

where
Since 1850, there have been 63 known dam failure in the United States (exclusive of tailings dams) that have involved fatalities (Figure 5). 63 It corresponds to the frequency of occurrence of 0.38 per year of dam failure. Range on the number of fatalities is 1–2209, and the average number of fatalities per year over the period of recording (i.e. 167) is about 20.6–22.4.

Location of dam failures including fatalities in the US (1850–2016), adopted from the National Performance of Dams Program. 63
The USBR developed a procedure to estimate the loss of life using data from every dam failure in the United States that resulted in more than 50 fatalities and every post-1960 US dam failure that resulted in one or more fatalities. The information such as warning time, population at risk, flood severity, and fatality rates were used for this purpose. The procedure is comprised of seven steps: 64
Determine dam failure scenarios to evaluate.
Determine time categories for which loss of life estimates are needed.
Determine flooded area for each dam failure scenario.
Estimate the number of people at risk for each dam failure scenario and time category.
Determine when dam failure warnings would be initiated.
Select appropriate fatality rate for estimating life loss. The fatality rate is based on the flood severity, the warning time, and the flood severity understanding.
Evaluate uncertainty in various parameters which lead to uncertainties in the life loss estimates.
Although both
Note that when it is not cost-effective to obtain
Downstream risk factor based on NID.
The only remaining term in equation (6) is

where PGA is peak ground acceleration in g, and
Quantification of elements in

Two-percent probability of exceedance in 50 years map of PGA for USA (left) and California (right).
Next,

Earthquake hazard dependents on the location of dam site with respect to the seismic sources and, regional and site-specific geologic characteristics. It is characterized by identification of all the potential earthquake sources (e.g. faults or areal seismic source zones). Local topographic conditions (e.g. hills, valleys, and canyons) can also modify the character of earthquakes. Next, attenuation relationships (also known as ground motion prediction equations—GMPE) are used to derive earthquake intensities to be used in performance assessment. This step is usually refereed to as PSHA. GMPEs provide estimated values of ground shaking intensity parameters (e.g. PGA) for user-specified combinations of earthquake magnitude, M, and site-to-source distance, R. 68 The most famous functional form for GMPEs is 69

where IM is intensity measure,
Atkinson and Boore 71

where PGA is in g, and
For randomly oriented horizontal component:
For larger horizontal component
Moreover
For
For
For
Pezeshk et al. 72

where PGA is in
Having

where the coefficient 2.5 was empirically selected by Bureauand and Ballentine. 8
Note that in equation (6), the term

where
Indicator of historic damage to dams.

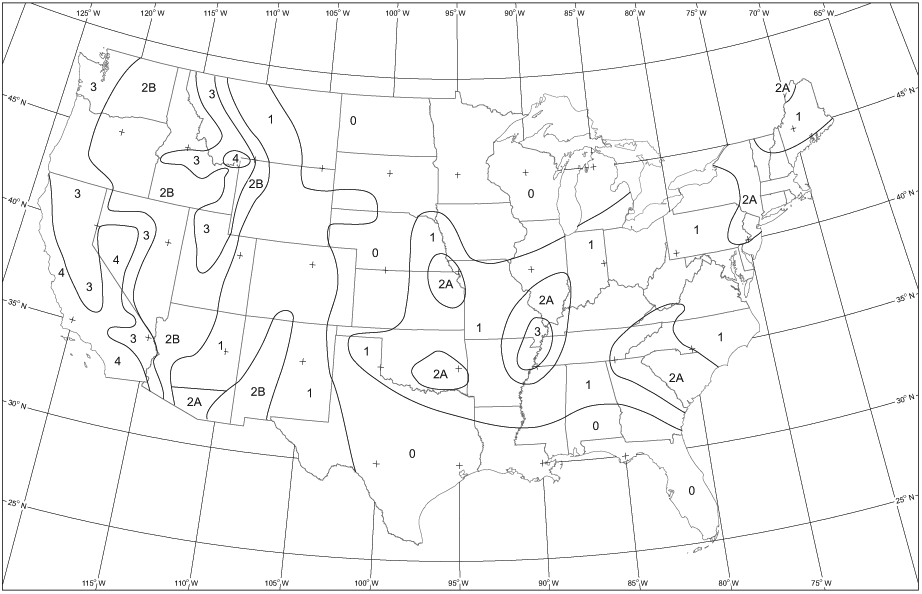
1994 Uniform Building Code zone map, zones are identified from 0 to 4.
UBC-based site classification.
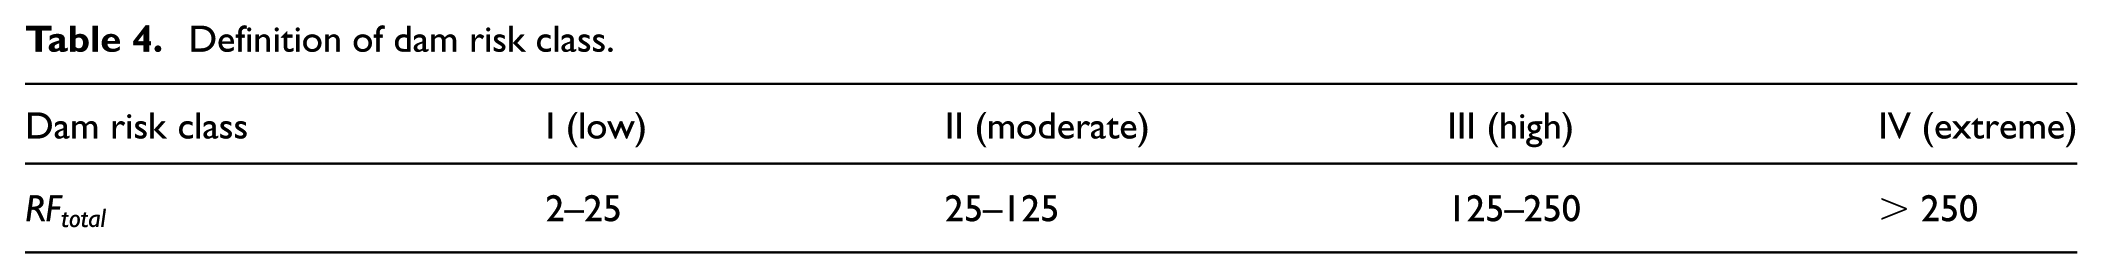
Finally, the risk class of different dams can be obtained based on the total risk factor and Table 4. Moreover, it is possible to compare
Definition of dam risk class.
Application on severely shaken dams
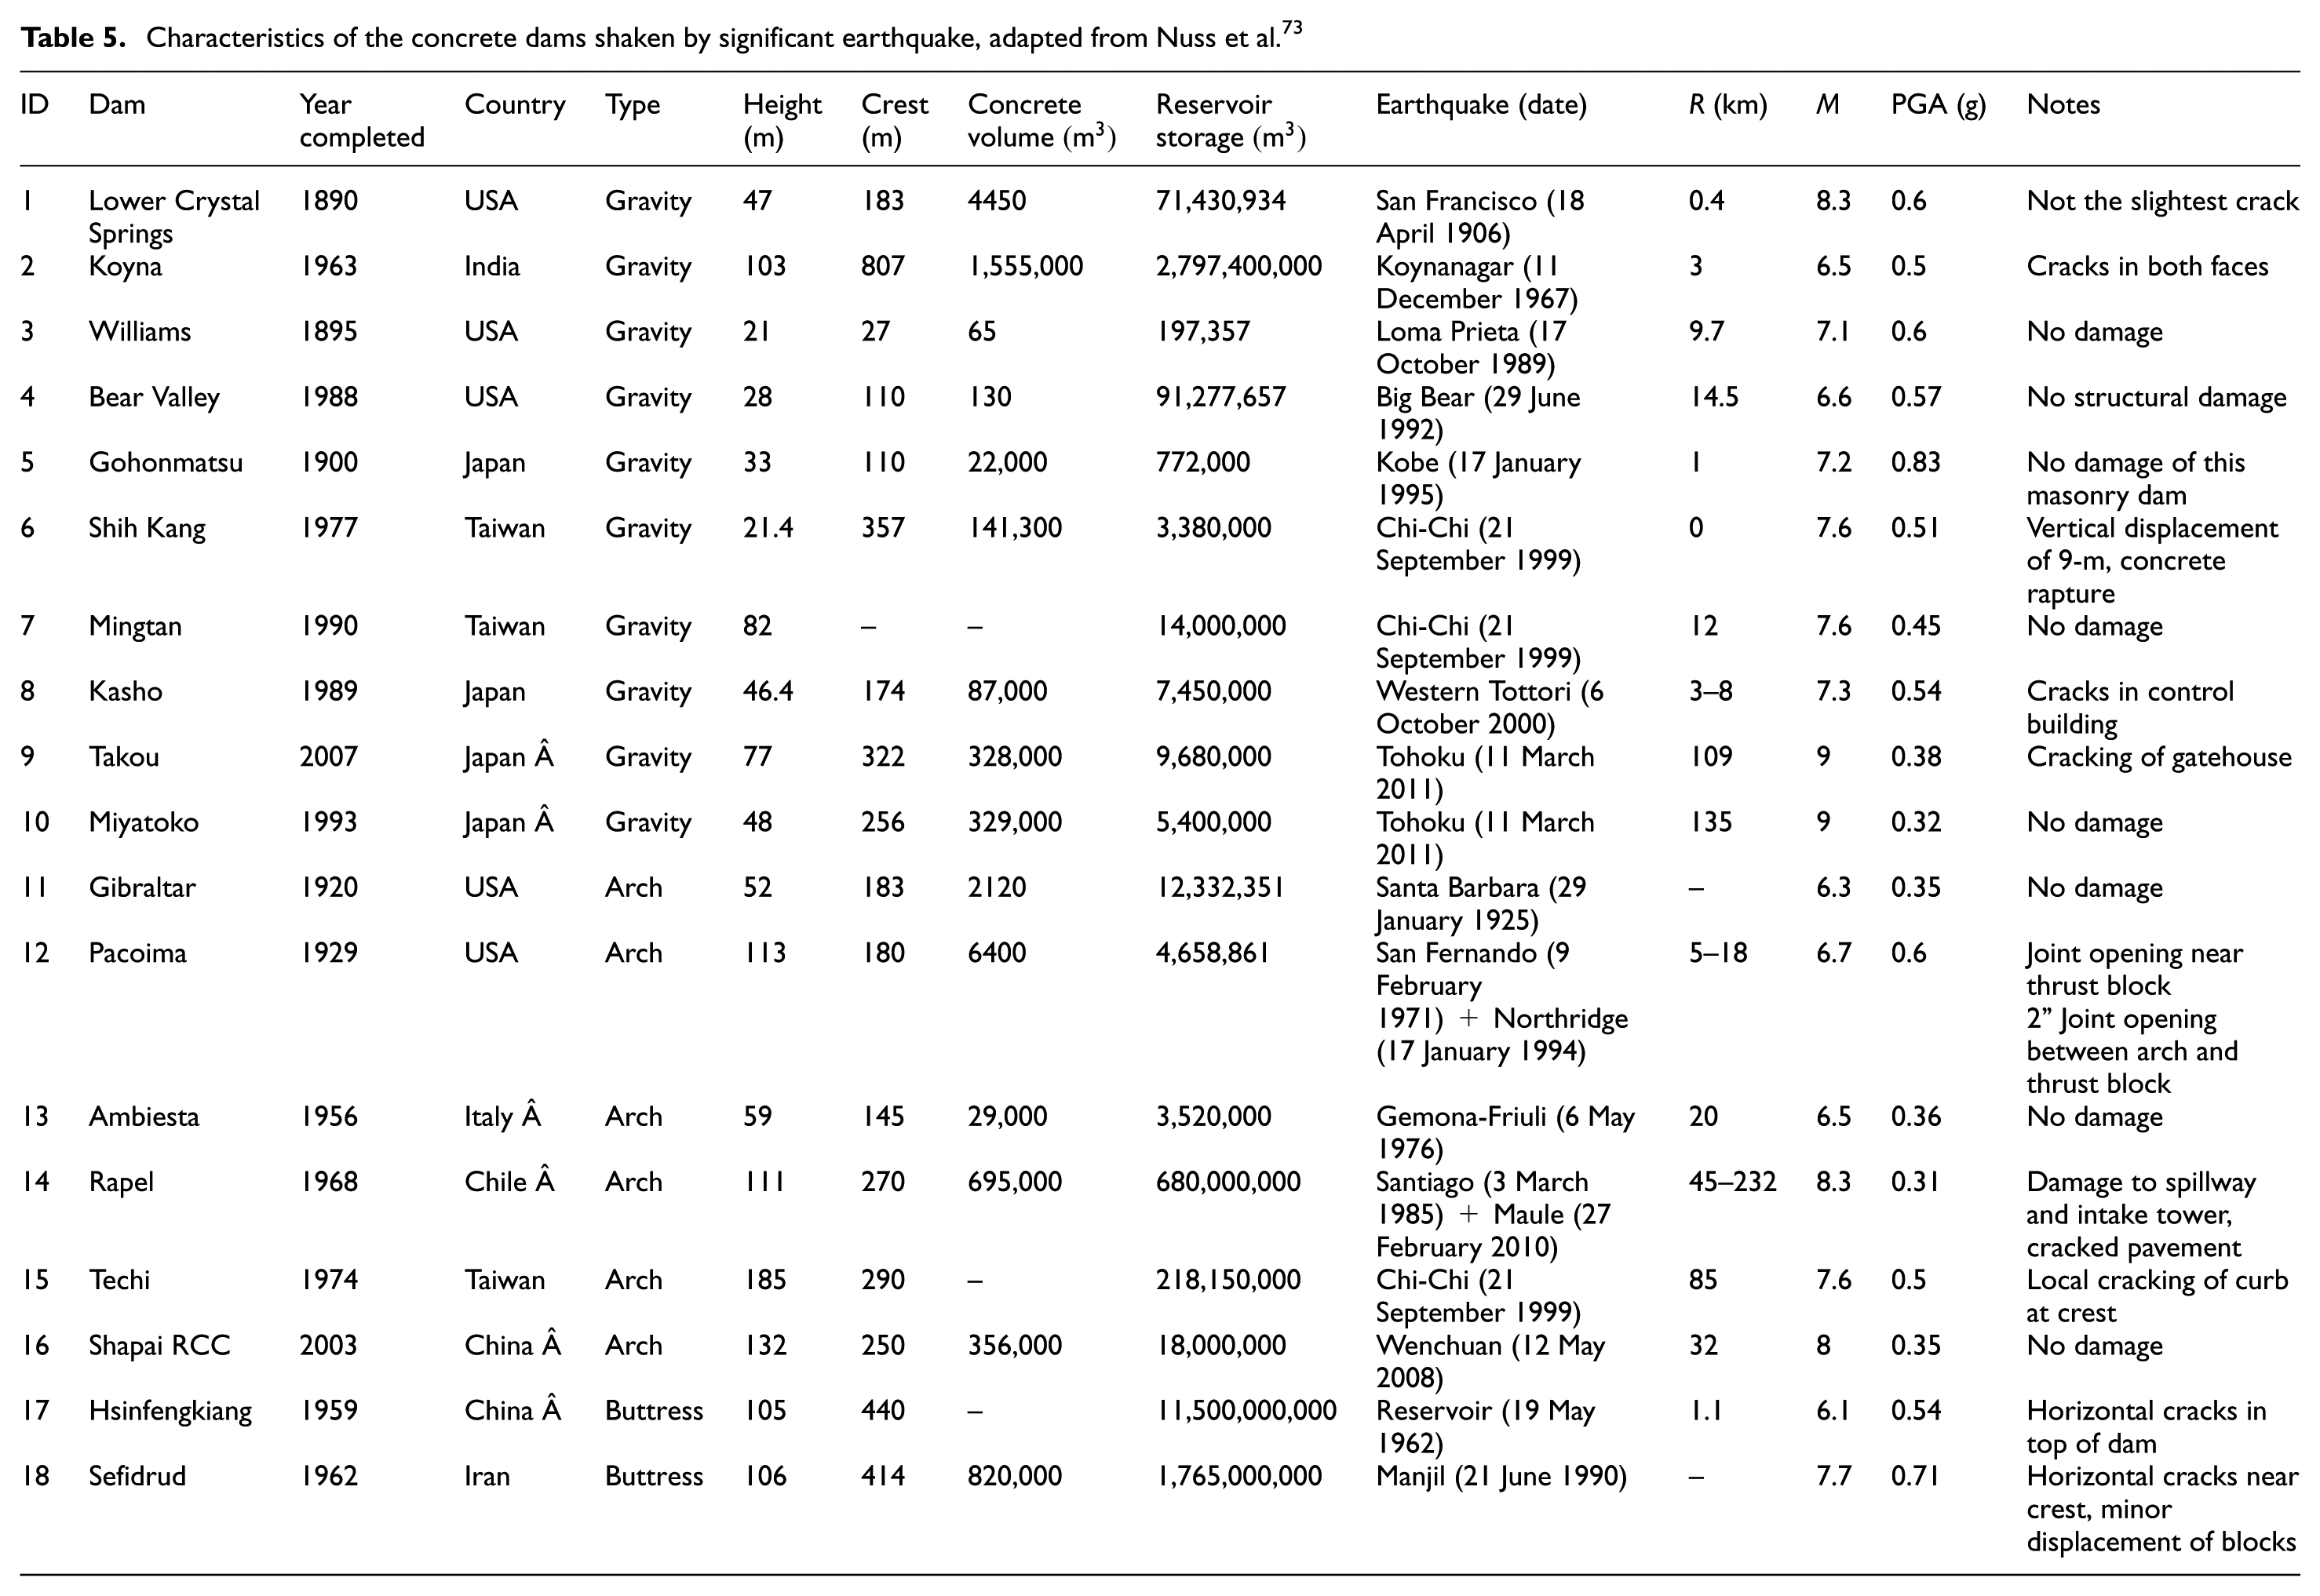
The revised methodology in the previous section is applied to a group of concrete dams shaken by relatively strong motions as reported by Nuss et al. 73 The list of these dams including their structural properties are summarized in Table 5. Furthermore, the earthquake event (including the PGA and magnitude) which is occurred at the dam site and the observed damage (if any) are reported in Table 5 as well.
Characteristics of the concrete dams shaken by significant earthquake, adapted from Nuss et al. 73
The semi-quantitative method is implemented on the selected dams and all the intermediary terms are summarize in Table 4. Note that the information on the population and property at risk are collected from available information on the web and also pictures taken by Google map, Figure 9. In majority of terms, the smoothed proposed curves are used. Downstream risk factor is computed based on the detailed method,
Dashed lines in this figure correspond to the dam risk class in Table 4. The major observation is that the risk factors computed by the
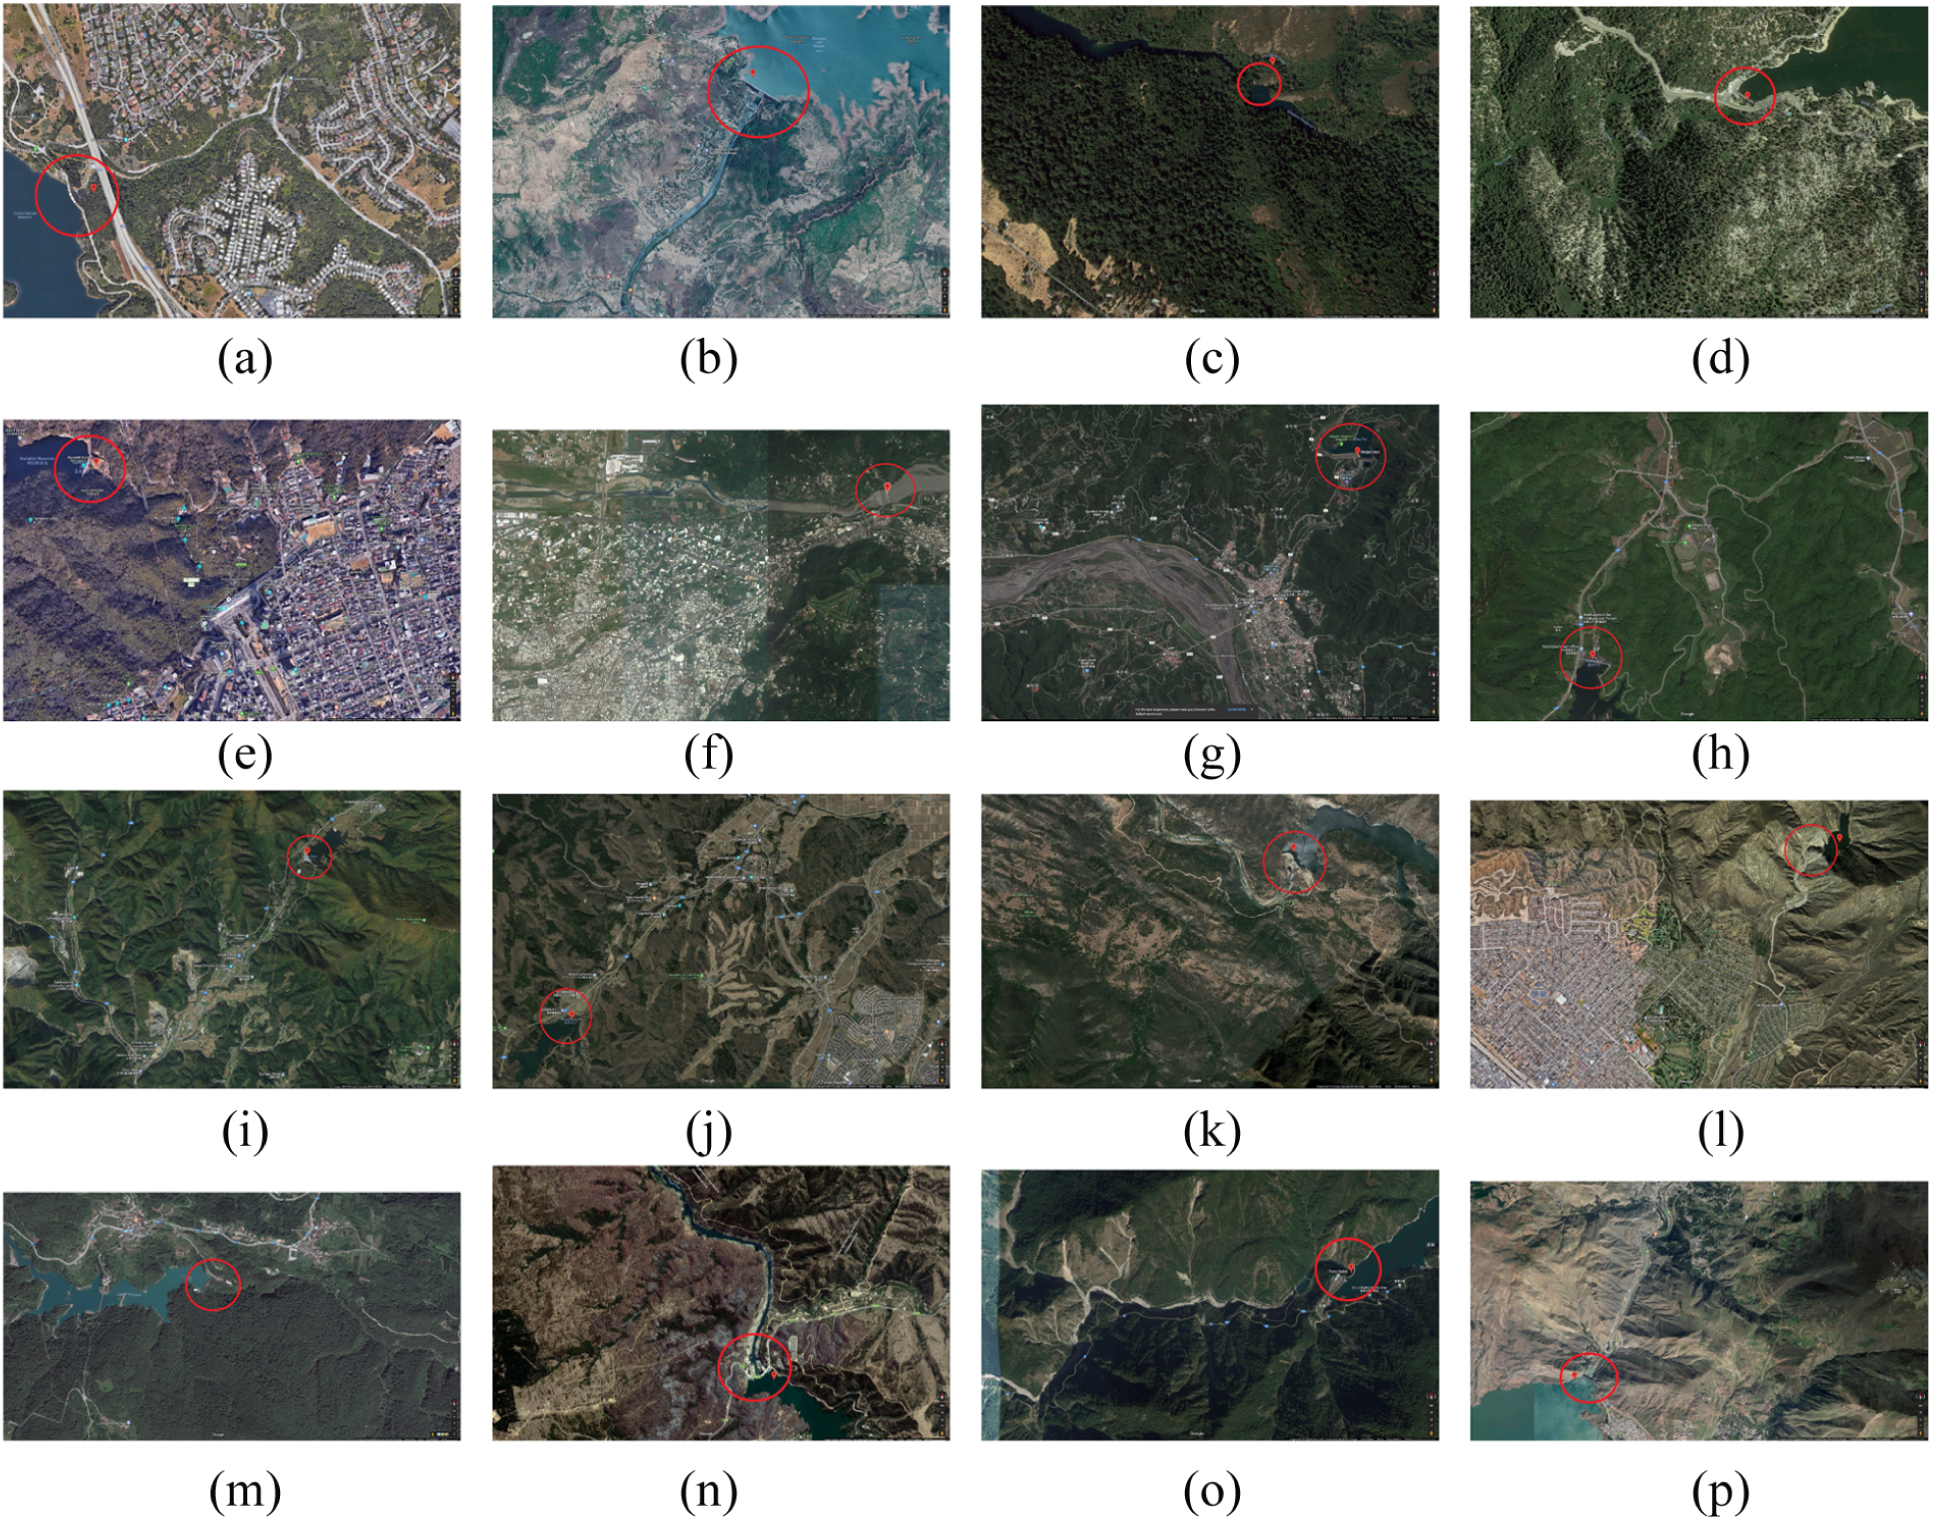
Google map of the selected dams and the downstream development: (a) ID 1, (b) ID 2, (c) ID 3, (d) ID 4, (e) ID 5, (f) ID 6, (g) ID 7, (h) ID 8, (i) ID 9, (j) ID 10, (k) ID 11, (l) ID 12, (m) ID 13, (n) ID 14, (o) ID 15, and (p) ID 18.
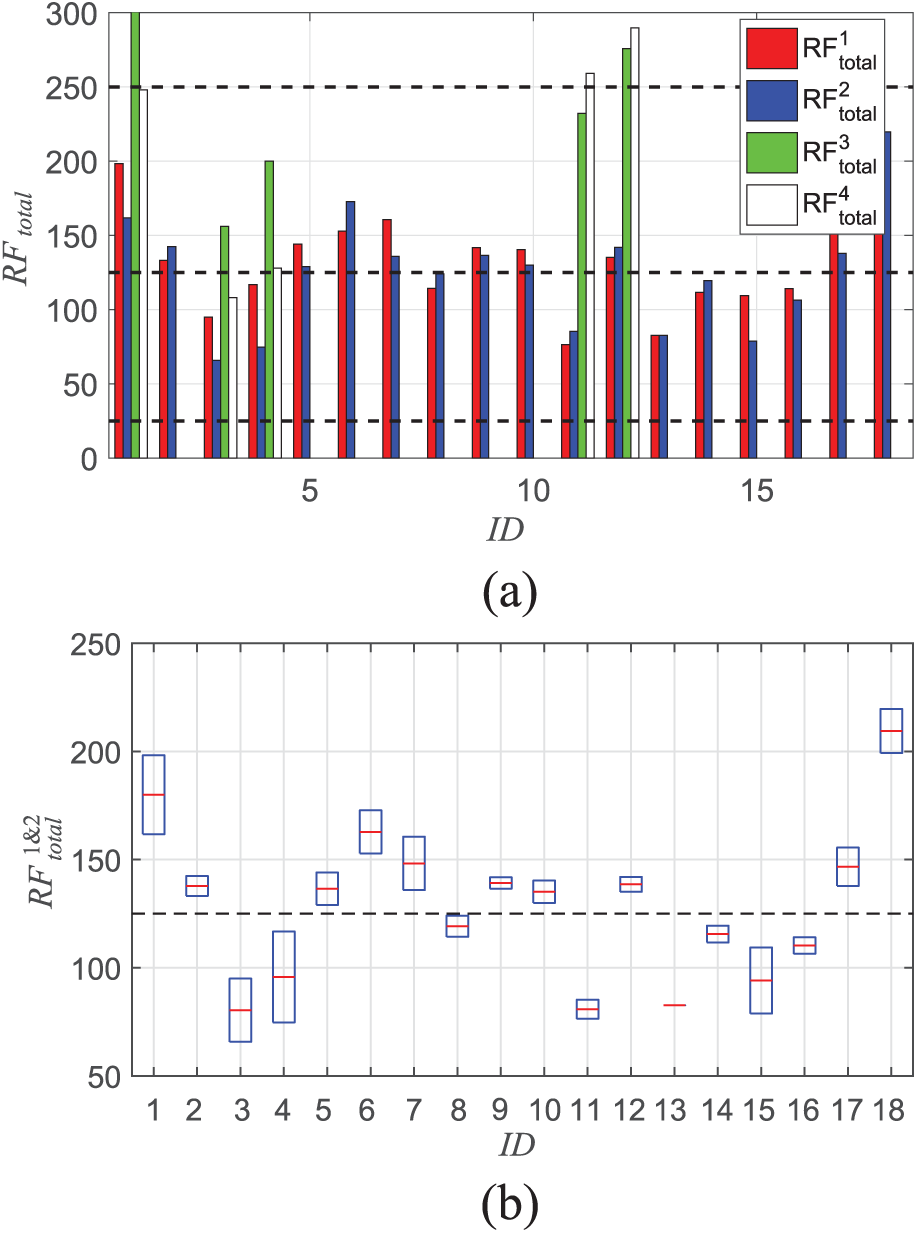
Total risk factor of the studied dams: (a) comparison of four models and (b) uncertainty of RF total.
Google map photos of dams
Detailed finite element simulation of high-hazard dams
After the initial screening and classification of a dam portfolio, those with highest
Staged construction process 83
Thermal loads and thermal analysis? 90
Ice load 91
Aging of concrete 92
Alkali-aggregate (-silica) reaction 93
Creep 94
Concrete fracture and joint modeling 95
Concrete cracking and crushing 96
Concrete heterogeneity 97
Developing a reliable FEM for linear or nonlinear analysis of dams is a challenging task and should be calibrated using the existing condition of the dam. Calibration is usually utilized on the static and thermal properties of the material. The dynamic properties estimated either using the laboratory tests or statistics of the existing literature. Results of the finite element simulations should be compared with those recorded during the operational period of the structure. Figure 11 proposes a general methodology for system identification and calibration of the dam structure. Finally, Figure 12 is proposed for detailed seismic performance evaluation and risk assessment of dams in the context of fragility analysis. The procedure starts by evaluating the current condition of the dam by including details as much as possible/economic. Next, the outputs from finite element simulations are compared with pre-defined criteria. It is quite difficult and challenging. For instance, what constitutes failure? Many dam guidelines specific that the dam cannot have an uncontrolled release of the reservoir. Is an uncontrolled release of the reservoir a trickle of water, a spurt, a steady flow that drains the reservoir, a flow that is above downstream capacity, or a large total sudden release of water? If the potential damage exceeds the threshold one, extra studies are required on repair cost, downtime, and so on.
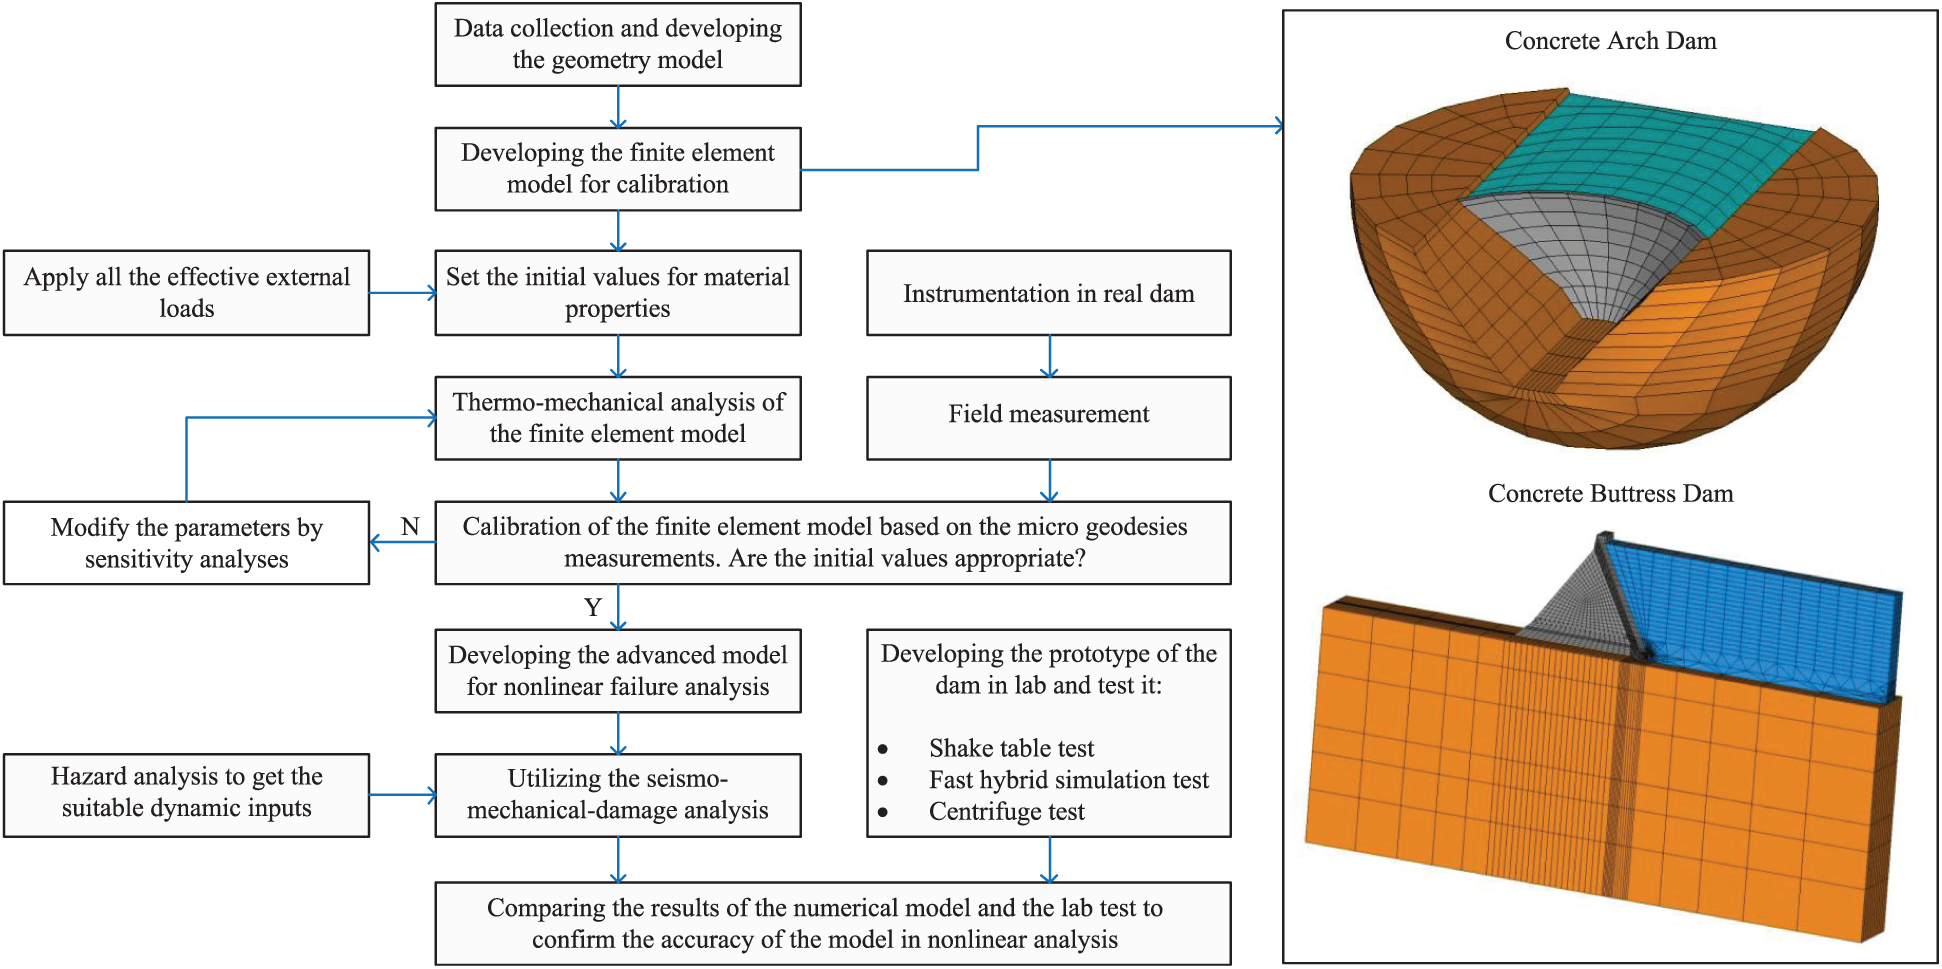
System identification and model calibration of dams. 98

Big picture for seismic performance evaluation of dams and risk assessment.
It is important to take into account the uncertainties associated with different different finite element inputs (e.g. material parameters, loading, and damping), modeling assumptions (e.g. pressure-based and displacement water simulation), software, and solution techniques. Accounting for these uncertainties is a daunting task and is not typically taking into account. Different researchers might use different approaches and get various answers for a same problem. Example, of this variation is shown in Figure 13 for the natural frequencies and crown cantilever displacement of a benchmark arch dam during the ICOLD12 workshop. 99 Even for a linear elastic analysis of an arch dam, there is a considerable variation in the reported outputs by 12 participants.
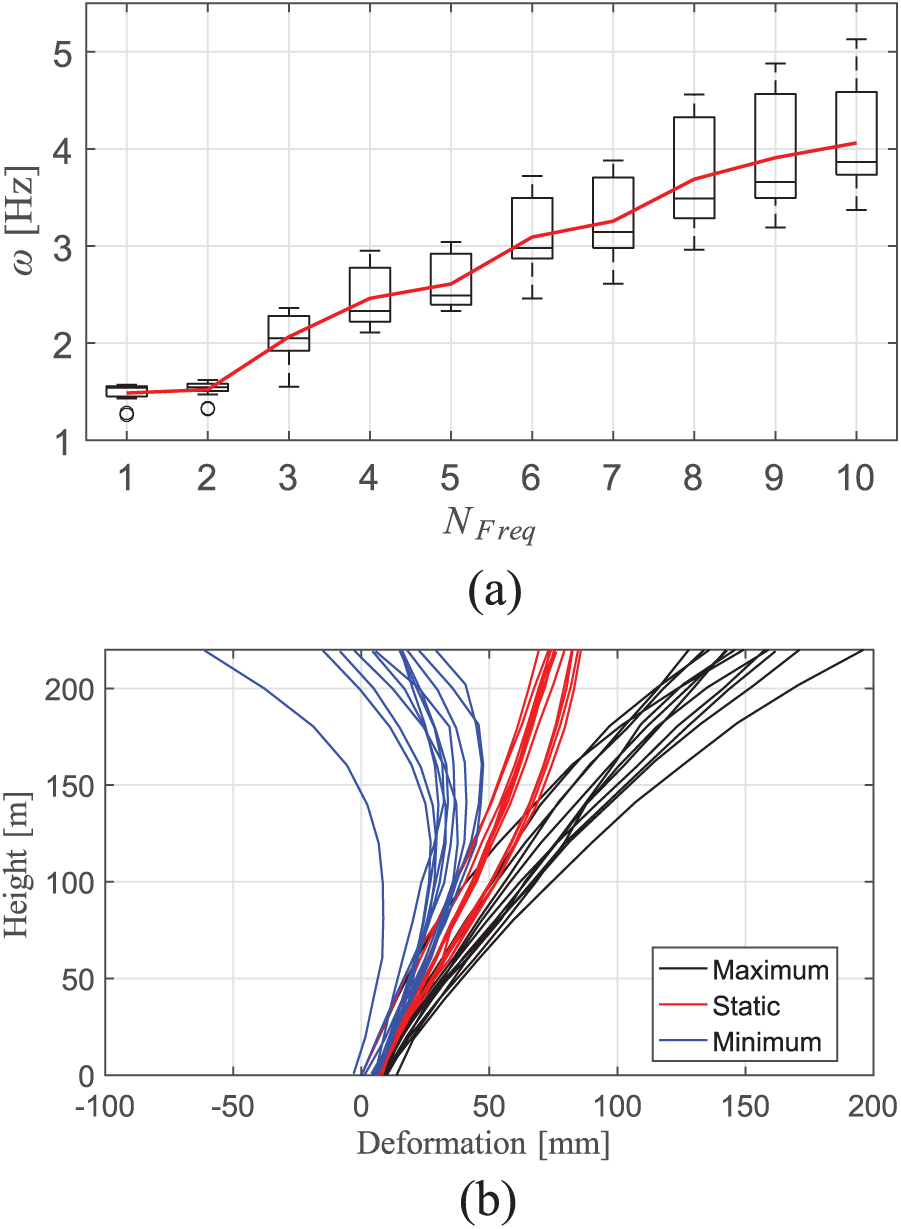
Summary of ICOLD12 Benchmark Workshops: (a) natural frequency and (b) displacement.
In order to support the field observations (Table 5) and semi-quantitative method (Table 6) and to integrate the numerical simulations in this context, 1 of the 18 case study dams is numerically analyzed. Koyna gravity dam is selected as a vehicle for this comparison. It is the most famous case study among the dam researchers. Nearly all the existing papers follow the 2D model of the dam. Detailed nonlinear analysis of this dam by the authors can be found in works of Hariri-Ardebili and colleagues.66,100 However, in order to add the uncertainty quantification on top, the results of the damage analysis by more than 15 researchers are illustrated in Figure 14. In all these studies, the damage is localized to the neck area and the concrete–rock interface. Except some minor differences in material properties, the major features in each simulation can be summarized as follows:
Ghrib and Tinawi 101 used damage mechanics approach for concrete, along with rigid foundation and added mass water.
Cervera et al. 102 compared the rate-dependent and rate-independent isotropic concrete damage models. Water and foundation effects were taken into account.
Lee and Fenves 96 used a new plastic-damage model with plane stress formulation. Dam-water interaction was included by an added mass for incompressible water, while the foundation was assumed to be rigid.
Guanglun et al. 103 developed a fracture mechanics model for concrete cracking with the re-mashing ability. Foundation was assumed to be rigid, and apparently, the fluid-structure interaction was ignored.
Mirzabozorg and Ghaemian 104 analyzed the three-dimensional (3D) unit-thickness finite element mesh with a proposed smeared crack model. Hydrostatic load was considered; however, the water and foundation interactions were neglected.
Calayir and Karaton105,106 applied two different models of coaxial rotating crack model with biaxial failure envelope, and an orthotropic damage model. Lagrangian approach was used for fluid-structure interaction, while the foundation was rigid.
Pan et al. 107 used three models of plastic damage, Drucker–Prager elasto-plastic, and extended finite element for damage analysis. Reservoir was modeled by Westergaard added mass, along with rigid foundation.
Omidi et al. 108 developed a 3D plastic-damage model with constant and damage-dependent damping mechanism. Eulerian approach was used for reservoir, along with rigid foundation.
Hariri-Ardebili et al. 100 compared the rotating smeared crack model with and without fracture energy effects. Pressure-based fluid elements were used with massless foundation.
Zhang et al. 109 used concrete damage plasticity including the strain hardening or softening. Model had a rigid foundation with Westergaard added mass.
Hariri-Ardebili and Saouma 66 used damage plasticity for concrete and Drucker–Prager elasto-plastic for rock including water–rock–dam interaction.
Huang 110 used damage plasticity model to evaluate mesh size dependency.
Chen et al. 111 used 3D polyhedron scaled boundary finite element method for damage simulation. Added mass approach was used with rigid foundation. Quadrilateral and triangular elements were compared.
Huang 112 used an extended finite element method including the effects of branching and intersecting cracks for damage analysis. Foundation and reservoir interactions were also taken into account.
Poul and Zerva 113 used the concrete damage plasticity with two foundation types: standard massless and massed foundation.
Seismic risk ranking of concrete dams shaken by significant earthquake.


Crack profile of the Koyna Dam computed by different researchers under various assumptions.
Summary
As can be seen, there are numerous methods to prioritize a portfolio of dams subjected to potential seismic loadings. This article is intended to compile the current state of practice. It is not known at this time the effectiveness of these various methods. However, the authors believe PFMA, risk analyses, and portfolio prioritizations have greatly improved the dam safety process and has helped portray the condition of dams to dam safety officials and decision-makers. A lot still has to be accomplished, but the dams industry seems to be headed in the right direction by using risk-based approaches to prioritize portfolios of dams. Without these methods, the industry would probably be wastefully spending limited funds on unnecessary rehabilitations. It is apparent that there is uncertainty in the risk methods, in the analytic methods that feed information into the risk process, and in the decision criteria. Addressing the uncertainties seems like an important next step and area of study.
Footnotes
Acknowledgements
M.A.H.-A. would like to express his sincere appreciation to his former advisor (and current mentor), Professor Victor E. Saouma at the University of Colorado Boulder for his enthusiastic guidance and advice. The authors would like to thank the reviewers for their helpful and constructive comments that greatly contributed to improving the final version of the paper.
Handling Editor: Elsa de Sa Caetano
Declaration of conflicting interests
The author(s) declared no potential conflicts of interest with respect to the research, authorship, and/or publication of this article.
Funding
The author(s) received no financial support for the research, authorship, and/or publication of this article.