
Abstract
To improve the fuel efficiency and battery life-span of plug-in hybrid electric vehicle, the energy management strategy considering battery life decay is proposed. This strategy is optimized by genetic algorithm, aiming to reduce the fuel consumption and battery life decay of plug-in hybrid electric vehicle. Besides, to acquire better drive-cycle adaptability, driving patterns are recognized with probabilistic neural network. The standard driving cycles are divided into urban congestion cycle, highway cycle, and urban suburban cycle; the optimized energy management strategies in three representative driving cycles are established; meanwhile, a comprehensive test driving cycle is constructed to verify the proposed strategies. The results show that adopting the optimized control strategies, fuel consumption, and battery’s life decay drop by 1.9% and 3.2%, respectively. While using the drive-cycle recognition, the features of different driving cycles can be identified, and based on it, the vehicle can choose appropriate control strategy in different driving conditions. In the comprehensive test driving cycle, after recognizing driving cycles, fuel consumption and battery’s life decay drop by 8.6% and 0.3%, respectively.
Keywords
Introduction
There are two power sources in plug-in hybrid electric vehicle (PHEV), including an engine and an electric motor. PHEV can improve its emission behavior while ensure driving performance through the coordination of different energy sources. Compared with the traditional hybrid electric vehicle (HEV), PHEV has a promising market because of its grid charging capacity and larger all-electric range. However, the frequent charge/discharge in PHEV’s power battery may reduce battery life irreversibly, which poses adverse effects on the vehicle performance and cost, so it is of great significance to consider battery life in the establishment of PHEV’s energy management strategy.
In the study of HEV’s energy management strategy, Pontryagin’s minimum principle (PMP) was used to do some optimization, which reduced the working frequency of battery by adjusting battery life weight coefficient in the penalty function.1,2 This method can reduce battery life decay effectively, and it is of great significance when the ambient temperature and driving conditions are particularly severe. But since the battery capacity and the depth of charge in HEV are less than those in PHEV, their battery models are quite different. From the research on PHEV’s energy management strategy, when making estimation of battery’s state of charge (SOC) value, the effect of battery life decay on charge/discharge current and internal resistance was considered; the battery life factor was introduced into the battery equivalent model to realize the adaptive estimation of SOC value to the battery aging. 3 Besides, a battery life prediction model of PHEV under variable driving conditions was established, and this model can analyze and manage conditions affecting the battery life. 4 However, the studies in Lin 3 and Dong 4 focus too much on theoretical research about factors affecting battery life, but their theories have not yet been used in energy management strategy. The PHEV’s energy management strategy presented in Padovani et al. 5 was optimized by equivalent consumption minimize strategy (ECMS) while considering the influence of temperature on battery life, temperature penalty coefficient was used to reduce battery life decay, but this method did not consider the high discharge rate. In Xu et al., 6 on the basis of minimum fuel consumption, the energy management strategy in commuter PHEV took consideration of the effect of battery life on vehicle fuel economy, which can also reduce battery life decay greatly. However, this energy management strategy depends heavily on the known traffic information and has poor adaptability to different driving conditions. The energy management strategy of battery/supercapacitor (SC) hybrid energy storage system (HESS) was studied in Song et al.; 7 this research was taken battery capability reduction into consideration; the convective heating method is integrated into the dynamic programming (DP) process, which has achieved less battery capacity loss after optimization. In the establishment of energy management strategy for HEV equipped with a continuously variable transmission (CVT), 8 DP was adopted to solve the tradeoffs between fuel consumption and battery capacity loss. However, the DP used in Song et al. 7 and Tang and Rizzoni 8 depend on the certain duty cycles, and it would take the long calculation time; 9 hence, it is not the best candidate for a real-time system.
Therefore, in this paper, battery life model is introduced in PHEV’s energy management strategy, and this strategy is optimized, aiming for the minimum fuel consumption and battery life decay. Meanwhile, the driving patterns are recognized with probabilistic neural network (PNN), aiming to established an energy management strategy which can adapt to different duty cycles and can be implemented in the real-time. The optimized energy management strategy is simulated and verified under the constructed test driving cycle.
Powertrain structure and working modes
PHEV’s powertrain structure
In this research, a series-parallel PHEV is studied, and the configuration of the powertrain is shown in Figure 1. The parameters of some main components, such as engine, integrated starter generator (ISG) motor, main motor, and battery, are listed in Table 1. According to the state of clutches, engaged or released, this system can realize different working modes: series driving, parallel driving, regenerative braking, and so on.
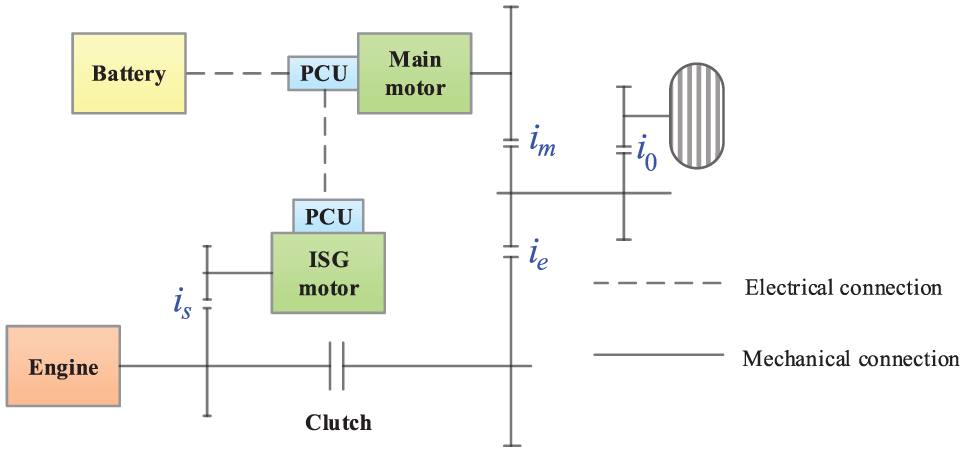
Powertrain configuration of PHEV.
Basic parameters and performance targets of vehicle.

ISG: integrated starter generator.
Working modes
Due to the difference of power requirement, battery’s SOC value, and engine efficiency in PHEV, the main motor and engine may work solely or together according to the driving conditions, and there are also some driving charging and energy regeneration conditions. To improve the efficiency of powertrain system, according to the path of energy flow, the working modes are divided as follows: four driving modes: (1) pure electric driving mode, (2) series hybrid driving mode, (3) parallel hybrid driving mode, (4) engine driving mode; two driving charging modes: (5) series driving charging mode, (6) parallel driving charging mode; and (7) regenerative braking mode. The specific working modes are illustrated in Figure 2.

Working modes of PHEV.
Rule-based energy management strategy
Driving modes
To achieve higher battery charge/discharge efficiency, the driving modes in section “Working modes” should be divided according to battery’s SOC value. Here, the driving modes are divided into charge depleting (CD) mode and charge sustaining (CS) mode.
In CD mode, powertrain prefers to make the best use of battery’s energy charged in power grid, so driving modes in section “Working modes” would be adopted reasonably: when vehicle is running at medium or low speed, pure electric driving mode is mainly used to consume battery’s energy; when the vehicle speed or required power is much higher, series and parallel driving modes would be used to meet the vehicle’s power demand. In CS mode, vehicle is mainly driven by engine, main motor provides auxiliary power, and the engine would try to work in high-efficiency area. The division of different working modes in CD mode and CS mode is shown in Figure 3. The power allocation and switching condition between CD and CS modes are determined according to battery’s SOC, vehicle’s driving speed v, and required power Pr; the rule-based energy management strategy is depicted in Table 2.
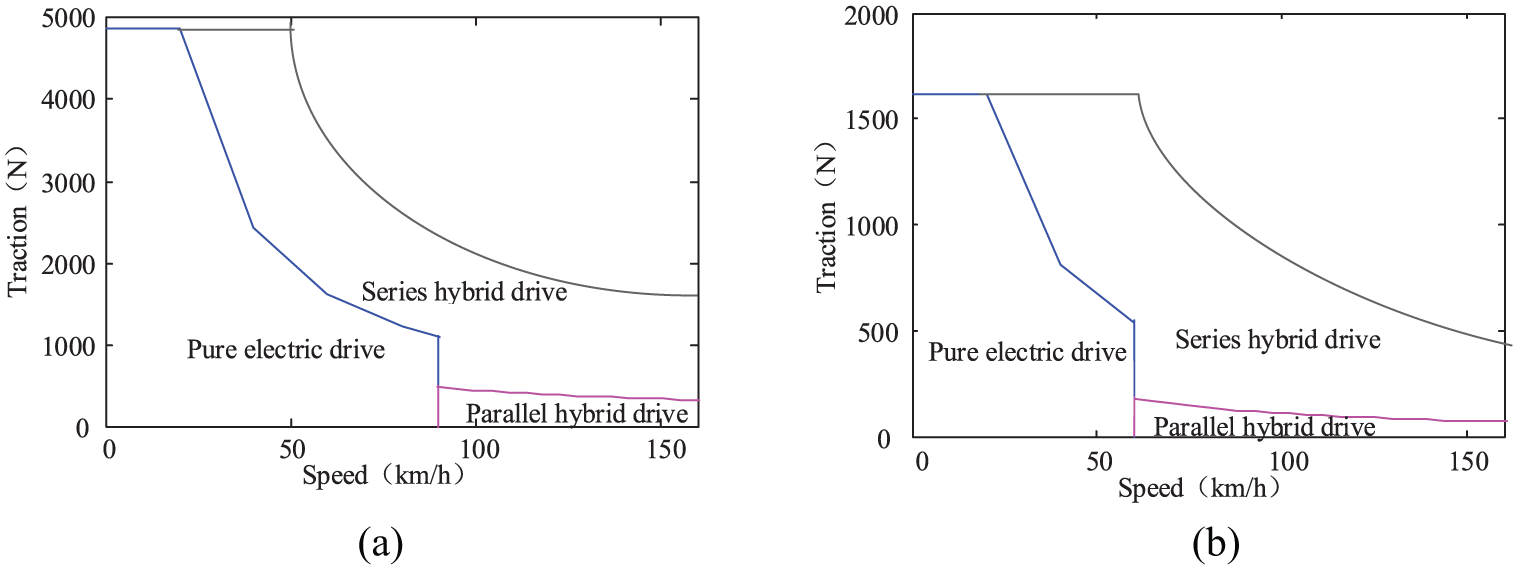
PHEV driving modes division in CD and CS mode: (a) CD mode and (b) CS mode.
PHEV driving modes and power allocation in CD and CS modes.

PHEV: plug-in hybrid electric vehicle; CD: charge depleting; CS: charge sustaining; ISG: integrated starter generator; SOC: state of charge.
Pe, Pemax, Popt, Pm, Pisg are the engine power, the maximum engine power, engine power in high-efficient area, main motor power and ISG motor power, respectively, while SOCup, SOCdown, Pup, Pdown, vup, vdown represent the upper and lower limits of battery’s SOC value, vehicle’s required power, and driving speed in CS mode.
Braking modes
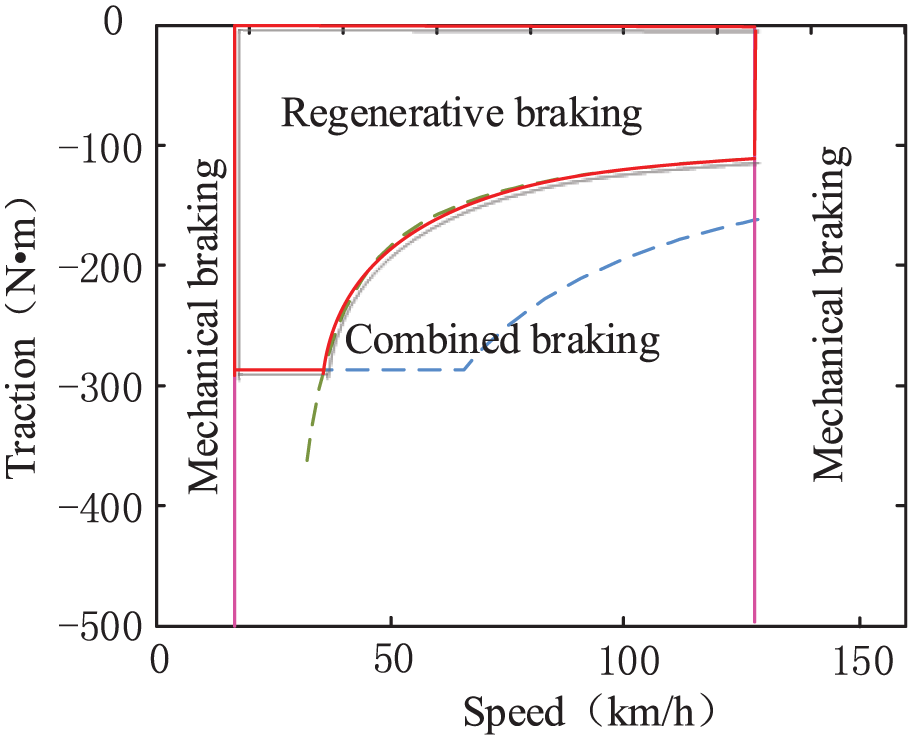
In the division of braking modes, when safe-operating demand is satisfied, powertrain system should recover energy as much as possible. When vehicle speed is too low that the regenerative braking function is failure, or the speed is too high to ensure braking safety, mechanical braking mode would be only adopted. When vehicle speed is within the permitted range of energy recovery, and braking torque is not only within the working range of main motor but also within the maximum recovery torque range of battery, regenerative braking mode would be used; otherwise, combined braking mode would be activated.
In this powertrain system, main motor is used to recover energy only. According to the parameters of selected components, the maximum recovery torque curves of main motor and battery can be obtained (shown in Figure 4), and the division of braking modes is shown in Figure 5.

The maximum recovery torque of battery and main motor.
PHEV braking modes division.
Multi-objective optimized energy management strategy
Analysis of battery life decay
In above energy management strategies, battery has many conditions, such as driving charging, driving discharging, and energy recovery. Frequent charge/discharge is the key factor that affects battery life, and battery life has great influence on vehicle performance and cost, so it is necessary to optimize the energy management strategy aiming at the least battery life decay.
As pointed out in Smith et al. 10 and Dai et al., 11 battery aging is characterized by the increase of internal resistance and the decline of capacity. For high-power battery, which can withstand higher discharge current, the increase of internal resistance is used to measure its aging, while high-capacity battery, whose capacity is much higher, the decline of capacity would be used in the aging measurement. High-capacity battery is adopted in this study, so the decline of capacity would be the only measurement factor in the study of battery life.
Battery life model
Until now, there has been no unified battery life prediction method under various working conditions. Most of researches mainly focus on the data-processed battery life model, and these data are gotten from the setting-constant-conditions experiments. In Marcicki et al., 12 battery life model was divided into physicochemical model and empirical model. The empirical model includes a set of formulas to describe battery aging process, whose parameters are from fitting aging test data, and the simplified physical relation is also taken into account.13,14 For simplicity and accuracy, the empirical model is much suitable for this research.
In this research, the life model of lithium-ion battery presented in Cordoba-Arenas et al. 15 is adopted; the model is given as
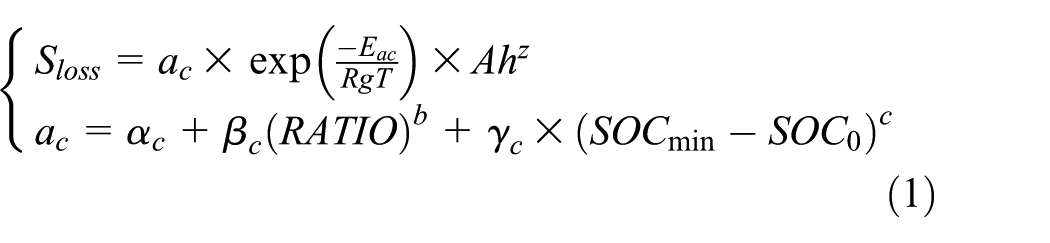
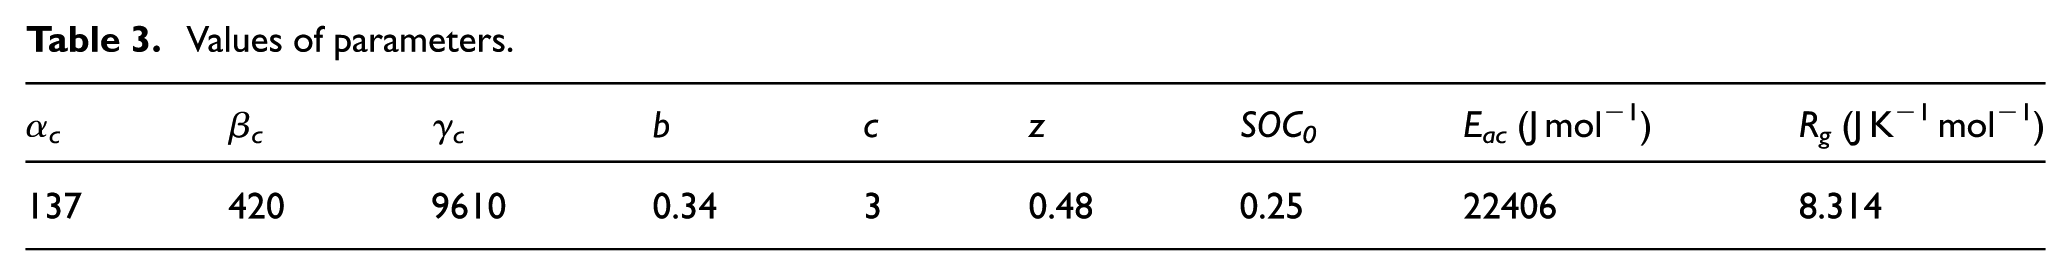
where Sloss is the battery capacity degradation; αc, βc, γc, b, c, z, and SOC0 are some constant coefficients; Eac is activation energy of capacity degradation; Rg is the gas constant; T is the absolute temperature; ac is a influence coefficient which reflects the impact of different depths of discharge and different working modes on battery life decay; SOCmin is the SOC threshold between CD mode and CS mode; Ah is the charge-discharge battery capacity during working; some of their values are shown in Table 3.
Values of parameters.
Besides, to reflect the influence of CD mode on battery life degradation, the parameter RATIO in equation (1) is the ratio of running time in CD mode to the total running time; it is determined as

RATIO = 1 means that vehicle only runs in CD mode, while RATIO = 0 means only in CS mode, and 0 < RATIO < 1 means vehicle runs not only in CD mode, but also in CS mode. From the life model, three important factors are considered in the analysis of battery capacity degradation: temperature, time ratio in CD mode, SOC threshold between two driving modes.
Multi-objective optimized energy management strategy
While optimizing the energy management strategy, the selection of optimization method may have great influence on the optimal result. The genetic algorithm (GA) can obtain a good global optimal solution instead of a local one. Besides, it can also do distributed calculation easily by using its parallel structure. Here, GA is used in the design of linear quadratic optimal controller, and optimization targets are minimum fuel consumption and minimum battery capacity degradation; the mathematical expressions are as follows

where
There are mainly three solutions for the multi-objective problem. The first one is the multi-objective optimization using GA directly. The second one is the liner weighted method. The third method is to transfer the multi-objective problem into single objective. However, GA may take a long time to process the multi-objective optimization. And in the liner weighted method, the solutions must be the convex set. Due to the above disadvantages, the third method is adopted in the optimization process.
Battery life model is added to the penalty function in optimal control, it is defined that when battery capacity reduces 20% of the original value, battery life ends. Battery life under rated condition can be measured by the total charge/discharge electrical energy before the end of life; 2 meanwhile, influence factor is also introduced to quantify the aging degree of other working conditions to the rated condition. So the rated battery life is calculated by equation (4), and the influence factor is defined by equation (5)

where

where σ is the influence factor.
The rated condition is defined as RATIO = 0, T = 298.15 K, SOCmin = 0.25, so the rated battery life is Г = 2736964.8 Ah. When battery works under high-load condition, the life influence factor is greater than 1, and battery may have a shorter life.
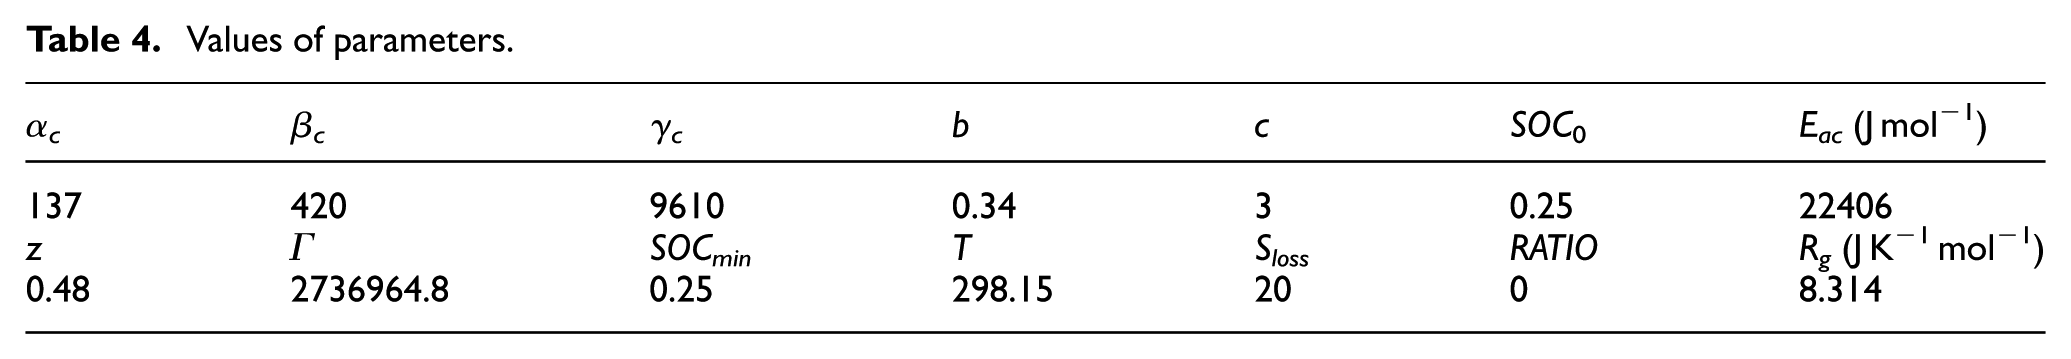
Battery life under different working conditions is given by equation (6), the battery life influence factor is given by equation (7) and the parameters are shown in Table 4


Values of parameters.
In order to describe battery life degradation accurately, the effective charge/discharge electrical energy is defined as
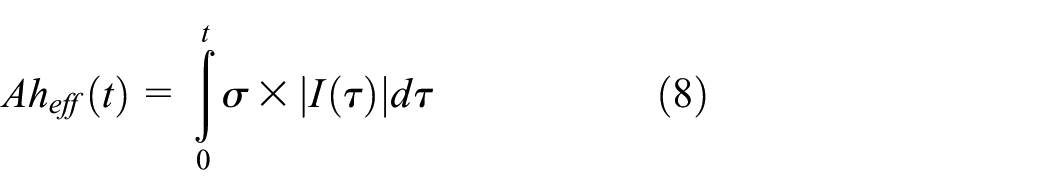
where
Therefore, to optimize the battery life degradation is to minimize the item Aheff. When Aheff = Г, it means the effective charge/discharge electrical energy equals to that under the rated condition.
After transformed by goal programming method, the optimization objective function is

where M is the maximum reference fuel consumption rate, Λ is the maximum reference value of σ(t) × |I(t)|, and α is the weight coefficient of fuel consumption. To eliminate the influence of sample singular points on calculation, the value of M and Λ would be chosen when their cumulative distribution function is equal to 0.98. The cumulative distribution function is the integral of the probability density function, which is used to describe the probability distribution of a random variable. The probability density function is expressed as

Using the rule-based control algorithm, fuel consumption rate and instantaneous value of σ(t)×|I(t)| under NEDC are obtained. Based on statistics analysis, the value of M is 0.0022 L/s and Λ is 1262 A.
Simulation analysis
Simulation results and analysis of rule-based energy management strategy
To validate the rule-based energy management strategy, vehicle performance is simulated on the MATLAB/Simulink platform; the simulation driving cycles are constructed by 10 NEDC, and the initial value of SOC is 0.9. After the simulation, the changes of vehicle speed and SOC value are shown in Figure 6; the total fuel consumption is 2.27 L, electrical energy consumption is 5.42 kW h, and battery capacity degradation is 0.375%. Figure 7 shows the output powers of engine, ISG motor, and main motor. Figure 8 illustrates the fuel efficiency contour and the engine working points. The engine has the highest fuel efficiency in the central part of the contour; specifically, the fuel consumption is small in the center, while it is large in the outskirts. From Figure 7, the battery is full of charge before 6000 s, where the vehicle works in CD mode. The engine seldom works and all working points are on the center of the contour; ISG motor transfers the spare engine power into electricity. After 6000 s, CS mode would be shifted due to the low level of battery SOC; the vehicle works mostly in parallel hybrid driving mode. From Figure 8, several engine working points locate outside the center of contour, which means that the engine efficiency reduces, but the working points are still within high-efficient area. Thus, the energy allocation of each power source is distributed effectively in this rule-based energy management strategy.

Curves of speed and battery’s SOC in NEDC.

Output powers of engine, ISG motor and main motor.

Distribution of engine operation points.
Simulation results and analysis of the multi-objective optimization
To validate the effectiveness of the multi-objective optimized energy management strategy, the simulation of the optimized control strategy is done under 10 NEDC duty cycles. To estimate the influence of weight coefficient of fuel consumption α on the optimization performance, the optimization process is conducted under four different conditions, namely, α = 0.3, α = 0.5, α = 0.7, and α = 0.9. The changes of SOC before and after optimization are illustrated in Figure 9; besides, the values of some items are listed in Table 5; they are the fuel consumption rate: Fuel, battery cumulative charge/discharge energy: Ah, the battery delivered energy weighted by influence factors: Ahw, capacity degradation: Sloss, and objective function value: J.

SOC value curves before and after optimization.
Values of parameters for different

From the simulation results, it can be found that the smaller α is, control strategy trends to reduce battery capacity degradation; otherwise, the greater α is, control strategy trends to reduce fuel consumption. When α = 0.3, the capacity degradation is minimum, because in this case the value of RATIO is the smallest (about 0.586), the vehicle runs more in CS mode; there is only a little change in SOC, battery cumulative charge/discharge energy is also small (about 42.71 Ah), which may help to extend battery life. When α = 0.9, the vehicle almost runs entirely in CD mode, for the value of RATIO increases to 0.98. In this condition, the battery is used mostly, and engine seldom works, so fuel consumption is lower (only about 1.7 L). But in this case, battery works long hours and its depth of discharge is larger, which may do harm to the battery life. The capacity degradation in α = 0.9 is 1.3 times that in α = 0.3; thus, it may be known that the establishment of energy management strategy has great influence on the battery life. Therefore, it is necessary to balance the fuel consumption and battery life degradation, and it depends on α.
From the simulation results, the change rates of fuel consumption and battery capacity degradation before and after optimization under different α can be obtained, as shown in Figure 10. When fuel consumption is as important as battery life, to optimize control parameters, the value of α is chosen at the value of the intersection of two lines, that is, α = 0.6273. This value of α is adopted in the optimization process; the initial values and the optimization limits are listed in Table 6. Table 6 also illustrates the optimized value of each parameter, which would be used in the optimized energy management strategy.

Change rates of fuel consumption and capacity loss before and after optimization.
Values of parameters before and after optimization.

After optimization, the fuel consumption is 2.229 L, which is 1.9% lower than that in rule-based control strategy, and the battery capacity degradation is 0.363%; there is a 3.2% decrease. The optimized boundary parameters are listed in Table 6.
Energy management strategy based on drive-cycle recognition
Drive-cycle recognition based on PNN
The above optimization is done only in NEDC; however, the vehicle may work in various conditions in the real world. To acquire better drive-cycle adaptability, the drive-cycle recognized control strategy is studied further.
Standard driving cycles and characteristic parameters. The standard cycles are divided into three types; according to their driving area and traffic conditions, 16 they are urban congestion cycle, highway cycle, and urban suburban cycle. The characteristic driving cycles are selected from standard cycles as the representative. NYCC and MANHATTAN are selected form urban congestion cycle; HWFET and US06_HWY form highway cycle; UDDS and ECE_EUDC_LOW from urban suburban cycle. The analysis of characteristic parameters is the theoretical foundation of drive-cycle recognition; based on the principle described in Qin et al., 17 five important parameters are selected: they are (1) cycle average speed um; (2) average driving speed without parking time umr; (3) ratio of parking time η; (4) average acceleration αacc; and (5) average deceleration αdec.
Result of drive-cycle recognition. A comprehensive test cycle is constructed, which includes seven different kinds of driving cycles. It is consisted of NYCC, MANHATTAN, HWFET, and WVUSUB driving cycles. To test the recognition quality further, four new cycles are added; they are NEW_YORK, YORK_BUS, WVUSUB, and INDIA_HWY_SAMPLE. This test cycle spans 83.1 km and the duration is 7019 s, as shown in Figure 11. To improve sample numbers in the recognition and increase recognition quality, equisection method is used to process the samples, 16 and PNN is adopted to calculate characteristic parameters. The result of drive-cycle recognition is shown in Figure 12; cycle types 1, 2, and 3 represent urban congestion cycle, highway cycle, and urban suburban cycle, respectively. From the simulation result, this recognition method has high accuracy in drive-cycle recognition.

Comprehensive test driving cycle.

Recognition result of comprehensive test driving cycle.
Simulation results and analysis of energy management strategy based on drive-cycle recognition
To acquire the optimal fuel economy and battery life, different parameters of energy management strategy should be used in different driving cycles. GA is used to optimize three typical cycles: MAN HATTAN, HWFET, and UDDS; the optimized result is listed in Table 7. From the optimized results, in MANHATTAN cycle, fuel consumption decreases by 4.3%, and by 1.5% for battery capacity degradation; in HWFET cycle, fuel consumption decreases by 32.86%, battery capacity degradation decreases by 1.6%; while the figures for UDDS are 4.7% and 0.3%, respectively.
Optimization results of MANHATTAN, HWFET, UDDS driving cycles.

MANHATTAN*, HWFET*, and UDDS* mean the optimized one.
To validate the control effect of the drive-cycle recognition-based energy management strategy, simulation is done in the constructed comprehensive test cycle; meanwhile, simulation is also done without drive-cycle recognition (use rule-based control strategy). Simulation results are listed in Table 8. From these results, using the drive-cycle recognition-based control strategy, battery capacity degradation drops by 0.3%, and fuel consumption decreases by 8.6%. The change of SOC is shown Figure 13, from which, it can be found that the vehicle may allocate energy more reasonably after drive-cycle recognition.
Values of parameters with and without driving patterns recognition.


Curve of SOC value.
Conclusion
In this article, the energy management strategy considering battery life decay is proposed, and this strategy is optimized by genetic algorithm. The following highlights the results of the study:
Based on the structure of powertrain system, the energy management strategy of PHEV is established. Two driving modes are divided according to the battery SOC value, vehicle required power, and vehicle speed; besides, the braking modes are divided according to the maximum recovery torques of the main motor and battery. Some simulations are done on MATLAB/Simulink platform to prove the validity of energy management strategy.
Aiming at the minimum fuel consumption and battery life degradation, GA is adopted to optimize the energy management. The reasonable parameters are chosen according to the change rates of fuel consumption and capacity degradation; after the optimization, the fuel consumption decreases by 1.9%, while the battery capacity degradation drops by 3.2%.
The standard driving cycles are divided into urban congestion driving cycle, highway cycle, and urban suburban cycle. The characteristic parameters of each cycle are extracted, and the actual working condition is recognized by PNN; simulation results show that this recognition method works precisely.
The optimized control strategies of three characteristic driving cycles are established, respectively, the recognition method based on PNN is adopted, simulation is done in the constructed test driving cycle. After optimization, the fuel consumption decreases by 8.6%, and battery capacity degradation drops by 0.3%.
Footnotes
Appendix 1
Acknowledgements
These projects offered all the cost of this series researches. The authors appreciated for their support on these researches.
Handling Editor: ZW Zhong
Declaration of conflicting interests
The author(s) declared no potential conflicts of interest with respect to the research, authorship, and/or publication of this article.
Funding
The author(s) disclosed receipt of the following financial support for the research, authorship, and/or publication of this article: This research was supported by the National Key Research and Development Program of China (grant number 2016YFB0101402), the Chongqing Natural Science Foundation (grant number cstc2015jcyjA60005), and the Fundamental Research Funds for the Central Universities (grant number 106112016CDJXZ338825).