
Abstract
Plug-in hybrid electric vehicle is one of the potential candidates to tackle the stringent fuel economy standards. Many previous studies focus on optimal fuel economy by coordinating primary power source and assistant power source in plug-in hybrid electric vehicles, which usually neglects vehicle dynamic performance. All-wheel-drive plug-in hybrid electric vehicle has advantages both in fuel economy and dynamic performance. However, when all-wheel-drive plug-in hybrid electric vehicle is traveling on low cohesive roads, how to balance the conflict between traction performance and fuel economy undoubtedly will be the crucial problem. To address the issue, an integrated control strategy is proposed for all-wheel-drive plug-in hybrid electric vehicle in this article, namely, traction control system–integrated energy management strategy. A charge depletion/charge sustaining strategy is employed to realize the torque distribution mainly according to the engine optimal working region to achieve better fuel economy. Traction control system is integrated to prevent slipping of the wheels during starting and acceleration by applying engine throttle control, motor torque control, and active braking control, which improves the vehicle dynamic performance. The traction enhancement is beneficial to the improvement of fuel efficiency. By the co-simulation of MATLAB/Simulink and AMESim, the results demonstrate the effectiveness of the proposed integrated control strategy, which increases the vehicle velocity greatly and optimizes fuel economy as well.
Keywords
Introduction
With regulations on vehicle exhausts becoming increasingly strict, designing high fuel efficiency cars is one of the most challenging goals for automotive engineers. 1 Hybrid electric vehicle (HEV) provides an effective route to improve fuel economy by providing the flexibility in optimizing engine operation, regeneration of braking energy, and engine downsizing. 2 Plug-in hybrid electric vehicle (PHEV) outpaces most of the current non-plug-in hybrid vehicle versions with an alternative choice of obtaining electric energy from the power grid, rather than being charged by engine when the state of charge (SOC) is too low. 3 Meanwhile, in order to guarantee traction performance, all-wheel-drive (AWD) PHEV has wonderfully potential application because of its clear advantages both in fuel economy and dynamic performance.
Energy management strategy (EMS) is very crucial for PHEV to achieve better fuel economy without deteriorating the performance of the vehicle in other aspects such as acceleration, and the impressive role has sparked worldwide interest and research in this area. 4 There are some strategies which have been successfully used in hybrid powertrains as supervisory control algorithms. Charge depletion/charge sustaining (CD/CS) strategy has been used by virtue of its practicability. 5 This strategy can be divided into two stages: the propulsion is mainly or exclusively provided by the electrical motor when SOC is high, namely, CD mode; SOC is confined to a predefined small range once the threshold is reached, and the vehicle is powered by the motor and engine like the conventional HEV, namely, CS mode. 6 Only suboptimal result is expected to be achieved with this strategy, because the threshold is unlikely to meet all the driving conditions. Equivalent fuel consumption minimization strategy (ECMS) improves CD/CS strategy by continuously computing the equivalent fuel consumption cost for different power splits between the internal combustion engine and the electric motor as a basis to select the most efficient operating point. 7 However, the result is sensitive to the equivalence factor values that are usually constant once defined. And high computation load is required for implementing ECMS, which limits its application. 8 In many proposed algorithms, dynamic programming (DP) algorithm has been used to meet the target of realizing the optimal fuel economy successfully. 9 But the cycle information should be pre-fetched. 10 A trip-oriented stochastic optimal EMS which combines DP part and ECMS can achieve better fuel economy. 11 But this type of EMS only works effectively at a fixed route. In addition, artificial intelligence has also founded extensive application in EMS, which realizes the torque distribution by adopting neural network, 12 fuzzy control,13,14 model predictive control (MPC), or genetic algorithm. 15 However, only strategies based on instantaneous vehicle state information can be implemented to on-line systems. This means that some tempting strategies are not practical in real-time system, such as DP algorithm. Although inferior fuel economy can be obtained by applying CD/CS strategy in comparison with DP algorithm, CD/CS strategy has the property of outstanding real-time performance.
It is necessary to define that fuel economy is not only affected by internal control rules, but also external conditions. Around the energy conversion efficiency of PHEV, much research has been carried out. 16 The strategies related above mainly focus on the approach to obtain the optimal torque distribution internally. But in some cases, such as when the vehicle slips excessively on low cohesive road, the fuel is squandered no matter what kind of strategy is applied, and the vehicle cannot move forward. Worse still, traffic accidents may occur.
Earlier studies have suggested that the vehicle has potential to obtain good dynamic performance by keeping the slip rate (SR) in an appropriate scope; 17 otherwise, the road adhesion coefficient will deteriorate. 18 In essence, traction control system (TCS) is designed to limit the SR, and this technology has already matured into an important method for improving vehicle traction. 19 Engine throttle control used to regulate the engine output torque is effective to enhance traction by controlling the amount of air inflow into the engine. 20 The engine throttle control included in a fuzzy proportional–integral–derivative (PID) traction control algorithm has been proposed. 21 However, the performance of TCS is susceptible to some variable affecting factors, such as the road and wheel inertia. To prevent possible failures caused by these factors, a fault-tolerant traction control was proposed. 22 Besides, motor torque control is also available in HEVs and results showed that the algorithm works effectively during take-off and acceleration by controlling motor torque. 23 In addition, active braking control 23 and differential control 24 also have been introduced to TCS. From the above analysis, we can see that previous studies have successfully applied TCS to traditional vehicle and HEV. In order to improve dynamic performance on low cohesive road, AWD system is an effective technique. Hence, since AWD PHEV can greatly enhance the vehicle performance not only in fuel economy but also dynamic performance, it is more and more widely used, especially for some high-end cars such as the BMW i8, the Range Rover, and the Volvo S60L. However, as for AWD PHEV, which is driven by multi-power sources, the TCS designing process is more complex because it should not only consider the road conditions, speed, and other factors but also the power system operation modes. And because it is a four-wheel drive system, how to coordinate the multi-axis movement becomes another major difficulty. 25 But the publications devoted to application of TCS in AWD PHEV are rather scarce. Therefore, the article attempts to overcome the obstacles that hinder the successful application of TCS in AWD PHEV so that the fuel consumption will be decreased further besides boosting the traction. Meanwhile, the association of TCS and EMS helps the integration of automobile electronic control system, which reduces costs and improves product competitiveness.
This article makes an in-depth study for introducing TCS to parallel AWD PHEV while decreasing fuel consumption by applying CD/CS strategy. The integrated control strategy is called traction control system–integrated EMS (TCS-EMS). The engine works at its high efficiency points with the help of the CD/CS strategy by coordinating the engine and electric motor. TCS controller included in the present strategy is designed to keep the SR in a proper range by engine throttle control, motor torque control, and active braking control. Finally, the vehicle model and the control strategy model are established by co-simulation of MATLAB/Simulink and AMESim. Simulation results show that the new integrated control strategy is effective and improves the dynamic performance in comparison with the general CD/CS strategy.
EMS of TCS-EMS
Structurally, PHEVs mainly include series, parallel, and series–parallel configurations. As presented in Figure 1, the parallel AWD PHEV studied in this article is retrofitted by adding an additional electric powertrain, which contains a motor, an inverter, and the power battery, to the rear axle of a conventional vehicle.

Vehicle powertrain configuration.
There is no direct connection between the two axles of this vehicle, instead of being connected to the engine and motor, respectively. Therefore, the power demand can be satisfied by only the engine, only the power battery, or both simultaneously. The vehicle acts as an AWD PHEV only when the two energy sources output torque at the same time. However, in other cases, it is a front-wheel-drive or rear-wheel-drive vehicle.
The TCS-EMS is proposed to overcome the difficulty that hinders the achievement of expanding TCS to AWD PHEV, which contributes to enhancing the vehicle traction and obtaining an achievable reduction in fuel consumption simultaneously. The hierarchical control system can be divided into three layers, as depicted in Figure 2, where Treq, Te, Tm, and P represent the required torque, engine torque, motor torque, and brake pressure, respectively. The torque allocation and the optimal powertrain operation mode are obtained through the primary control. The first layer outputs are the engine torque demand (Te_req) and motor torque demand (Tm_req). The second control layer is used to determine the optimal traction control method according to the powertrain operation modes, road pattern, and vehicle speed, so that the vehicle runs steadily with an excellent traction performance, which is the focus of this article. The third layer is used to control relevant actuators, including engine, motor, and the braking system.

Principle diagram of TCS-EMS.
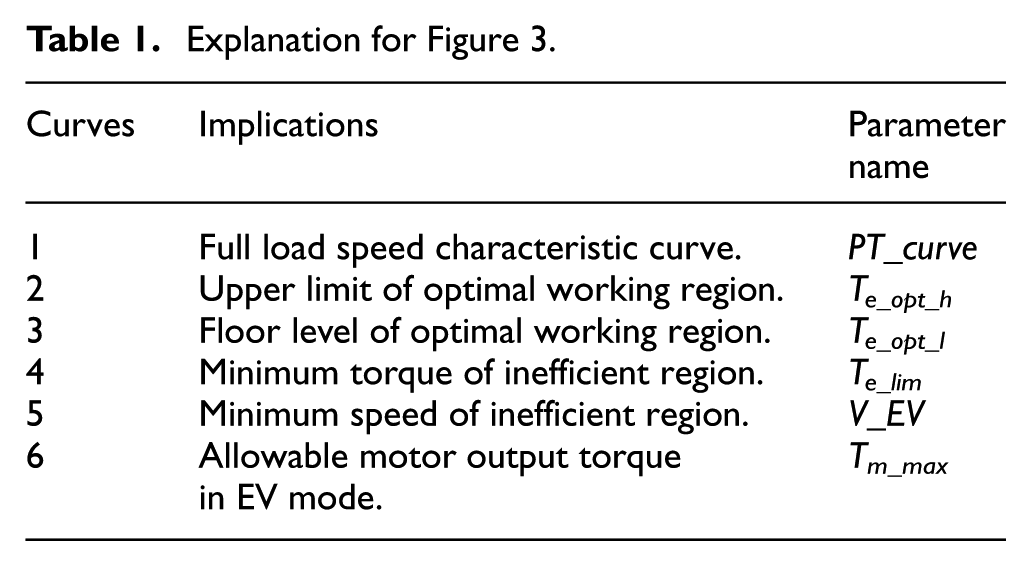
The CD/CS strategy developed in this article helps the engine to operate at its high efficiency points mainly according to the engine map. As shown in Figure 3, the engine map is divided by six curves, and the engine optimal working region is the goal in CS mode. Table 1 is the explanation of these curves. The SOC is confined to the predefined range. The thresholds mentioned in EMS are shown in Table 2.
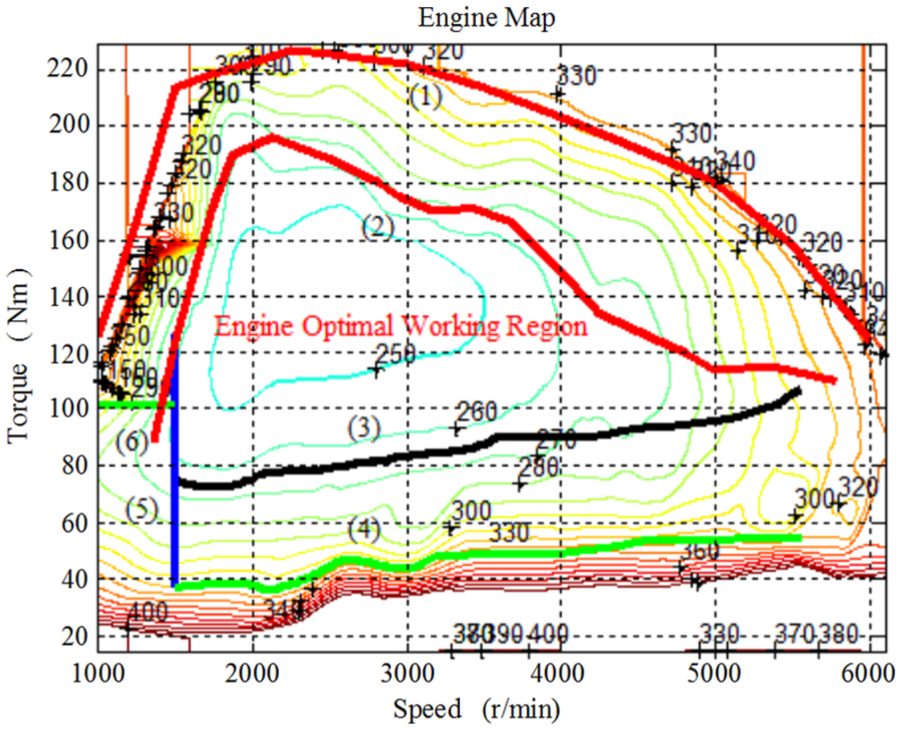
Division on engine operation range.
Explanation for Figure 3.
SOC threshold.

There are several possible operation modes according to energy flow, summarized in Table 3. In engine drive-charge mode, the vehicle is driven by the engine, while the motor adds resistance to the rear wheel at the same time for recharging the battery, namely, CHEV mode. Also, BHEV and EV represent the boost drive mode and motor-only drive mode, respectively, ICE is the engine-only drive mode. There are two other modes in CD stage: MEV and MICE. The former denotes that the vehicle is mainly propelled by the motor and engine acts as the assistant when the motor cannot meet torque demand. In the latter mode, contrarily, the engine acts as the primary power source while motor as the assistant to ensure the engine work at its high efficiency area.
All the available modes.

CD: charge depletion; CS: charge sustaining.
The most striking feature of PHEV is the ability to obtain electric energy from the grid through external power supply. It can be seen from Table 3, the vehicle has three available operation modes in CD mode, based upon driving requirements and system operating efficiency. Given that the parameter-matching is implemented on the basis of satisfying almost all the working requirements only by the motor, EV mode is suitable to achieve good fuel economy in CD stage. After being fully charged from the grid, the vehicle starts to travel and the power system operates in CD stage in which it uses the electric energy in the battery to drive the vehicle. When the battery SOC drops to the threshold SOC_cs, it is indicated that the battery power is low and then the power system starts to work in CS mode. In CS stage, the engine starts to cooperate with the motor and the vehicle may works in EV mode, ICE mode, CHEV mode, or BHEV mode, which maintains balance of the SOC for the best fuel economy. At this time the electricity consumed by motor is no longer from the power grid, but almost from the electricity transformed from fuel consumption of the engine or from the recovered braking energy. As shown in Figure 4, the CS mode control strategy switches modes according to the driver torque demand (Treq), the engine optimal working region, battery SOC, and so on.

Flowchart of CS mode control strategy.
TCS of TCS-EMS
The vehicle power analysis should consider the feasible longitudinal and lateral range limits imposed by the tire. The adhesion coefficient is susceptible to the changeable driving environment. This means that TCS controller has to respond quickly to control the vehicle satisfyingly. Otherwise, the vehicle may emerge yaw moment rapidly. Besides, the operation modes have great influences on TCS. Different control methods should be chosen to ensure the best vehicle dynamic performance in different operation modes. In particular:
Uniform adhesion roads: both driving torque control and active braking control are used at low speeds; only driving torque control is applied at moderate and high speeds.
Step-μ roads: TCS will be turned off quickly when the vehicle drives from low-µ to high-µ; however, TCS must be switched on rapidly from high-µ to low-µ; both driving torque control and active braking control are used at low speeds; driving torque control is appropriate at moderate and high speeds.
Split-μ roads: at low speeds, the maximum μ among all the wheels is chosen as the reference adhesion coefficient, and active braking control is appropriate; at moderate and high speeds, the minimum μ is chosen as the reference adhesion coefficient, and driving torque control is employed.
EV mode or CD mode: in order to decrease the fuel consumption, motor torque control is only employed.
CHEV: in order to decrease the driving torque to regulate the SR, the recharging torque is increased within the bounds exerted by the battery protection system. If the maneuver cannot meet the control requirements, the engine throttle control will be activated to reduce the output torque.
ICE: when the wheel slips excessively, engine throttle control will be adopted. The motor will be started for a better dynamic performance if SOC is high.
BHEV: when the SR of driving wheel is too big, the engine throttle control will be applied, as well as the motor torque control.
As mentioned above, the road surface and operation mode need to match the control methods. The details of these technologies will be discussed in the following sections. There are some affecting factors as well, and the reference speed and the target speed have great impacts on the performance of this integrated strategy. Therefore, both of them will also be analyzed in detail.
Driving torque control
PID control, the most widely used method in automobile industry, has advantages in performance, robustness, and convenience for application, and its schematic diagram is presented in Figure 5. The PID controller is adopted to control the engine throttle or motor torque. The input of PID controller is the velocity tracking error. The controller is mathematically defined as formula (1)
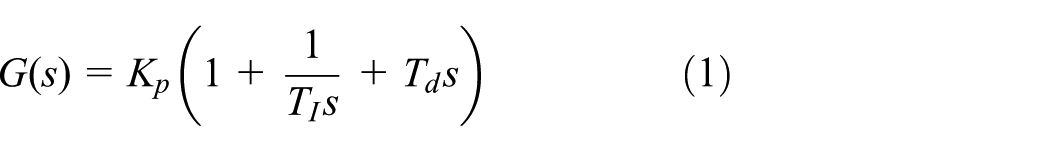
where G(s) is the output, Kp is the proportional gain, TI represents the integral gain, Td denotes the derivative gain, and s is the Laplace transform variable.

PID controller.
In case the driving wheels slip excessively, TCS is started swiftly. By reducing driving force, the SR is controlled within an appropriate range. The control principle used to compute the engine throttle or motor torque is derived as formula (2)

where u(t) represents the engine throttle or motor torque; Vtarget and Vactual are the target wheel speed and the actual wheel speed, respectively.
Active braking control
Braking the driving wheels contributes to improving vehicle traction and fuel economy by regulating the SR and eliminating the waste of fuel. For this purpose, the available speed range is divided into several levels by thresholds, and the best choice is made from several available methods in different regions according to status of the driving wheels. In the active braking control process, the braking system is controlled in the states of pressure maintaining, decompression, or pressurization according to the thresholds of target speed and the acceleration or deceleration of the driving wheels, which make the actual speed track the target speed. The control flowchart of active braking control is elaborated in Figure 6, where Vt represents the target speed, V0 and Vt1 denote the corresponding logical thresholds of target speed, aw is the acceleration of the wheel, Flag_brake is the control flag (Flag_brake = 1 in braking; otherwise, Flag_brake = 0). The analyses about this figure are as follows:
If the vehicle velocity is high (represented by V ≥ V0), or the vehicle tends to stop (represented by V < Vt), the maneuver of braking should be avoided for safety.
If Vt < V < Vt1, and Flag_brake = 1 at the same time, the vehicle enters the state of pre-pressurization. Else if Vt < V < Vt1, but Flag_brake = 0, reducing the pressure of wheel cylinders is required.
If Vt1 < V < V0, and aw ≥ 0, pressurizing will be exerted. If Vt1 < V < V0 and aw < 0, which means that the speed of the driving wheel tends to decrease, the operation of maintaining the pressure of the wheel cylinders is desired.

Flowchart of active braking control.
Reference speed
The TCS-EMS must be able to obtain the reference speed as there is no speed sensor in this system, and the accuracy of reference speed contributes greatly to the performance of this integrated strategy. Commonly used methods to determine the reference speed consist of the maximum wheel speed method, minimum wheel speed method, slope method, and comprehensive method.26,27 The maximum and minimum speeds of all the wheels are taken as the reference speed in the maximum wheel speed method and minimum wheel speed method, respectively. But the reference speed from the two methods is directly affected by the wheel speed signals and the error is large. Formulas (3) and (4) provide a way to calculate the reference speed Ve by the slope method; where Vc is initial velocity; a and Vx are the acceleration and actual speed; and t is the time interval


The reference speed calculated by the slope method can approach the vehicle speed better. But if the acquisition errors of initial velocity and the acceleration are large, the reference speed estimation will be inaccurate. Therefore, in this article, the reference speed is obtained by mixing minimum wheel speed and slope method. This comprehensive method not only reduces the influence of wheel speed fluctuation from the minimum wheel speed method but also makes it easy to determine the initial velocity and can accurately estimate the reference speed. The principle is shown in Figure 7, where Vfl, Vfr, Vrl, and Vrr denote the front left, front right, rear left, and rear right wheel speed, respectively. The calculating process is described below:
At the beginning, the initial velocity Vc is determined by the minimum wheel speed method by collecting the wheel speed signals. In the subsequent calculating process, the initial velocity of the slope method is adjusted in real time using the reference speed value obtained in the previous step.
If
If

Flowchart for determining the reference speed.
Target speed
As shown in Figure 8, with given conditions, the longitudinal adhesion coefficient is a nonlinear function of SR with a distinct maximum, while the lateral adhesion coefficient decreases continuously as SR increases. In order to reach the best compromise, the value of SR = 0.2 is suggested since both longitudinal and lateral adhesion coefficients are satisfactory at this point. So, the control target of TCS is to keep the SR around 0.2, and the speed at this point is assumed to be the target speed. Formula (5) provides a method for calculating the target speed by reference speed Ve and target SR St. Therefore, the speed, which is able to reveal the excessive slip, is chosen as the direct control variable instead of the SR in this article. What’s more, the speed is able to display the control effect visually

where Vt is the target speed, St denotes the target SR.

Relationship between μ and slip rate.
Modeling the AWD PHEV
In order to verify the TCS-EMS, the simulation models are established on the platform of AMESim and MATLAB/Simulink. The main parameters of this parallel AWD PHEV and the power sources are shown in Table 4.
Main parameters of the vehicle.

A 14-degree-of-freedom vehicle dynamics model and power sources model
Taking all the factors into account is nearly impossible when modeling the vehicle, because the actual circumstance is too complex. So, the vehicle must be rationally simplified. A 14-degree-of-freedom (DoF) vehicle dynamics model is employed in this article, depicted in Figure 9. The kinetic equations of formulas (6)–(8) describe its dynamic characteristics, which are derived according to Newton’s second law and the moment of momentum theorem
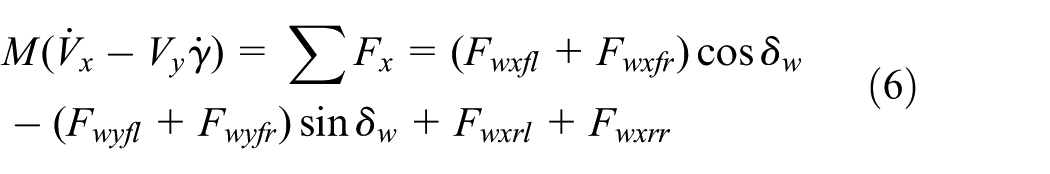
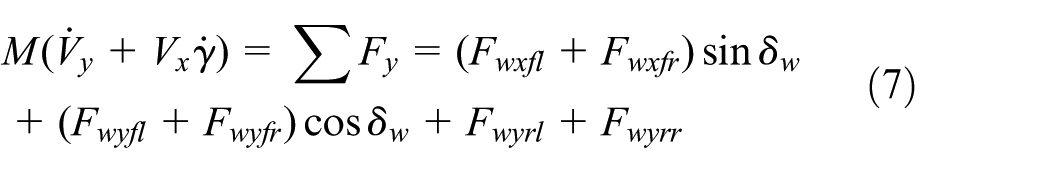

where M is the mass of vehicle;

Vehicle dynamics model.
The vehicle driving forces are provided by the two power sources, engine, and motor.The key variables in the engine model are calculated by formulas (9) and (10)

where Peff is the effective power, TX is the corrected value of output torque, and ωe is the output speed

where Ttable is the torque from the table data of the engine map, and Tlosses is the total torque losses. The output torque in the motor model (Tm) is calculated by formula (11)
where tr is the time constant, and Tlim is the limited input torque.
Models built in AMESim and Simulink
The tires do not only suspend other parts of the vehicle, passenger, and cargo but also act as the function element for moving, and its working states are essential to driving performance. Some typical tire models have already been proposed, such as Taehyun analytical tire model, Pacejka magic formula empirical model, UniTire model, and UA tire model. 29 G Gim tire model is employed in the article because of its advantages in quick calculation and good operating-mode adaptability. Since G Gim tire model is widely used in this engineering field, and it is very easy to find relevant information, 30 this article does not intend to explain its principle.
As shown in Figure 10, the simulation models can be grouped into two major parts, the AMESim models and the Simulink models, and they are connected through the interface icon. The closed-loop control system is formed by realizing the data exchange through S function. The inputs of AMESim models are the instant velocity and control variables (e.g. engine load, engine on/off command, and gear and motor torque), and the outputs are the brake command, engine speed, and SOC. Models built in MATLAB/Simulink include the 14-DoF vehicle dynamics model, tire model, and other component models. The outputs of Simulink models are obtained through vehicle model and CD/CS strategy if TCS is shut down; otherwise, they are gained through vehicle model and TCS.

Software architecture of co-simulation.
The TCS controller is formed in MATLAB/Simulink, as well as data processing model and the operation mode selection strategy. Since the principle of integrating TCS into CD/CS strategy is the main emphasis of this article, it is necessary to illustrate the TCS controller. As shown in Figure 11, TCS is comprises the TCS on/off model, control flag selection, target speed, and reference speed model. The TCS controller is required to meet the requirements mentioned in section “TCS of TCS-EMS” to make full use of its traction. Besides, TCS has to exit if driver depresses the brake pedal, which is represented by brake_on = 1, detailed in Figure 12, where T_on is the time threshold. The threshold Vd, T_on, time interval Ti, and count n are set to reduce the failures caused by wheel speed signal noise, which helps to improve the reliability of TCS controller.

TCS controller.

Control flow of flag of TCS on/off.
Analyses of simulation results
In order to fully validate the effectiveness and reliability of this TCS-EMS, simulations were implemented on uniform adhesion, split-μ, and step-μ roads to guarantee the credibility of the simulation results. The fuel economy is described first, since it is the basis of research on the traction enhancement.
Simulation results of fuel consumption
New European Driving Cycle (NEDC), which is shown in Figure 13, is chosen for investigating the fuel consumption. As shown in Figure 14, when the SOC decreases from 100% to about 47.92%, the vehicle has covered a distance of almost 50 km on pure electric mode under NEDCs. The parallel AWD PHEV operates in CD stage before SOC depletes to a certain level (40% in this study) and then the SOC decreases slowly since the vehicle works in CS mode in which it tries to sustain SOC. The all-electric range in CD mode is more than 55 km. The total fuel consumption (J) during the defined driving event can be acquired according to formula (12). The simulation result of fuel consumption is shown in Table 5 and it maintains a low fuel consumption level

where tf is the total time of the driving event,

New European Driving Cycle (NEDC).

SOC and distance.
Fuel consumption.

Uniform adhesion road
Simulations are conducted here to verify the performance of this AWD PHEV on low-μ. The value of adhesion coefficient is assumed to be 0.1 to simulate the ice and snow road. The results in different operation modes are as follows:
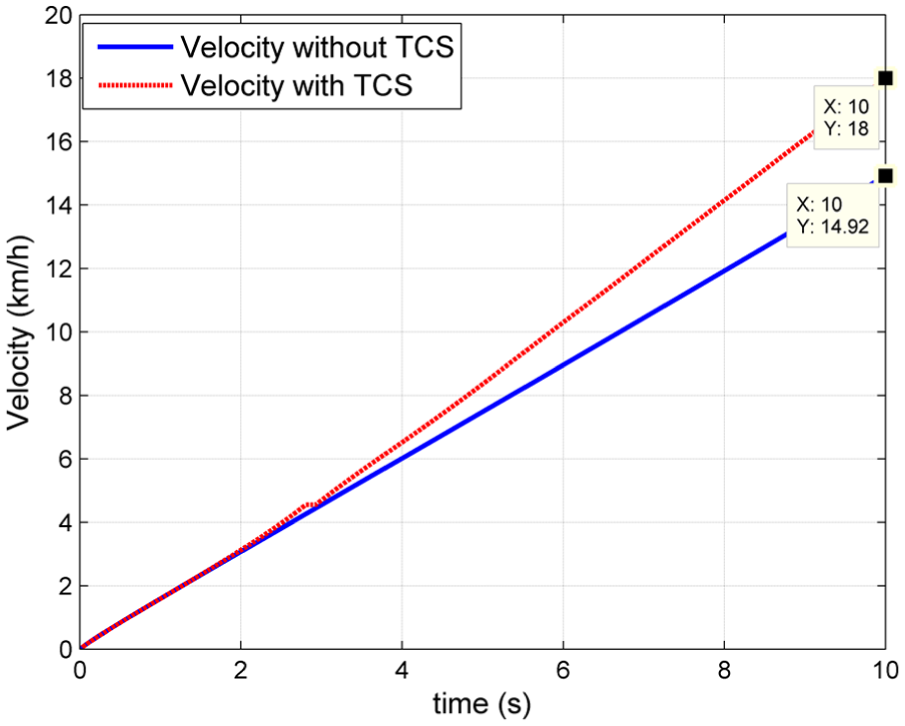
ICE mode: the initial velocity is zero, the accelerator pedal is held at 50% stroke, and SOC is high. Figures 15(a) and (b) and 18(a) and (b) show the performances of the AWD PHEV with and without TCS, respectively. Where fl, fr, rl, and rr are the four wheels of the vehicle (i.e. the front left, front right, rear left, and the rear right wheel, respectively), and Vfl, Vfr, Vrl, and Vrr denote their speeds; V is the velocity of the vehicle; and Vt is the target speed. The vertical axes of Figures 15(a), (b), 18(a), and (b) represent the wheel speed, brake pressure, engine load, and motor torque, respectively. Since the relationship between the speed and the SR satisfies formula (5), the speed is chosen as the direct control variable. In the ICE mode, as the driving force of the engine output is greater than the ground adhesion, the front driving wheels slip overly. Before TCS is applied, as shown in Figure 15(a), the speeds of front wheels are significantly bigger than the vehicle velocity, while the speeds of rear wheels coincided with that of the vehicle. After detecting that, TCS responds quickly to regulate the front wheel by applying engine throttle control and active braking control, as shown in Figures 16(b) and 17(b). In order to improve the vehicle traction, the motor will also be turned on if SOC is high (Figure 18(b)). Under the control of TCS, as shown in Figure 15(b), the speeds of front wheels track around the target speed, which reflects that the SR is well controlled to stay within the prescribed safe range. As the wheel speeds do not slip seriously, the engine load and motor torque return to the initial state, but the active braking control still works to maintain the SR. From Figure 19, we can learn that the speed increases from 14.92 to 18 km/h at 10 s after applying TCS during starting on low cohesive roads, which verifies the effectiveness of TCS.
BHEV mode: the initial velocity is zero, the accelerator pedal is held at 100% stroke, and the battery is fully charged. By comparing Figures 20(a), (b), 23(a), and (b), it is safe to draw the conclusion that the four wheels slip excessively before TCS is applied (Figure 20(a)). However, not all the wheels reach the same degree of slip due to the engine torque, and the motor torques are different. But, the wheel speeds are regulated in a pre-set range after TCS is working (Figure 20(b)) and the wheel speeds are well controlled around the target speed compared with the results without TCS in Figure 20(a). As SOC is high, the active braking control (Figure 21), engine throttle control (Figure 22), and motor torque control (Figure 23) are applied to improve the vehicle velocity, and they decide whether to work or not according to the vehicle driving state to maintain the control effect. The brake pressure is different, and the engine and the motor start working at different times because of the unequal SRs. In addition, in the control process of BHEV mode, the torque demand of the engine and the motor change significantly. In order to reduce the torque fluctuation, the coordinated control of the engine and the motor is considered. As response time of the engine torque is long, while the motor torque responds fast, the idea of the coordinated control is that the engine is controlled to output stable torque, and the motor is used to compensate for the rest torque to meet driver’s torque demand, thereby reducing the torque ripple and the vehicle impact. In order to intuitively analyze the strategy’s contribution to the vehicle performance, the velocity is shown in Figure 24. In which the velocity increases from 26.93 to 33.80 km/h at 10 s after introducing TCS, and the 25.52% increase is a recognition of the proposed strategy.
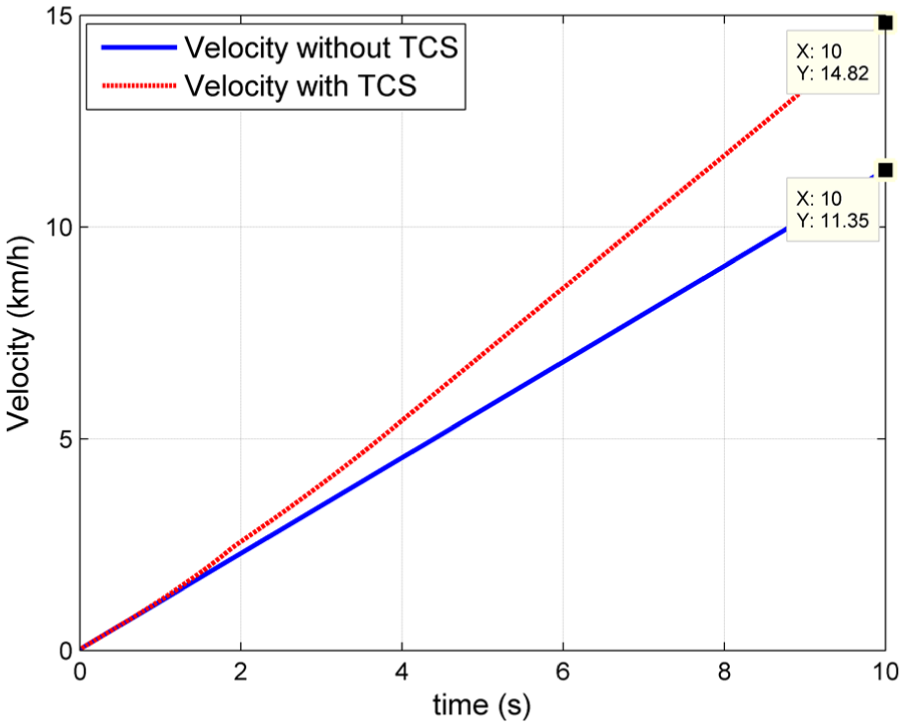
EV mode and CHEV mode. Initial conditions are set as follows: EV mode: the initial velocity is zero, and the accelerator pedal is held at 100% stroke under the condition that SOC is high. CHEV mode: The initial velocity is zero, the accelerator pedal is held at 30% stroke and SOC is lower than the threshold (30% in this study). Taking the velocity as the evaluation index, the comparisons of both simulations are shown in Figures 25 and 26, respectively.

Wheel speeds in ICE mode: (a) without TCS and (b) with TCS.

Brake pressures in ICE mode: (a) without TCS and (b) with TCS.

Engine loads in ICE mode: (a) without TCS and (b) with TCS.

Motor torques in ICE mode: (a) without TCS and (b) with TCS.
Velocity in ICE mode.

Wheel speeds in BHEV mode: (a) without TCS and (b) with TCS.

Brake pressures in BHEV mode: (a) without TCS and (b) with TCS.

Engine loads in BHEV mode: (a) without TCS and (b) with TCS.

Motor torques in BHEV mode: (a) without TCS and (b) with TCS.

Velocity in BHEV mode.
Velocity in EV mode.

Velocity in CHEV mode.
With comparison of the performances before and after the TCS is applied in EV mode shown in Figure 25, we can conclude that the strategy incorporates the capabilities of improving the vehicle traction greatly in this condition. Where the velocity has been improved remarkably from 11.35 to 14.82 km/h.
The vehicle is propelled by the engine under the control of CD/CS strategy in CHEV mode. However, the velocity is limited by the excessive SR. The TCS-EMS makes a difference by applying throttle control, motor torque control, and active braking control, not just apply CD/CS strategy. As illustrated in Figure 26, the velocity increases from 14.63 to 17.61 km/h at 10 s, which verifies the effectiveness of this strategy.
The simulation results above conducted on uniform adhesion road in all the powertrain modes show that the strategy investigated in this article is able to response quickly to control the engine throttle, motor, and braking system compatibly. As a result, the vehicle’s traction has been improved remarkably.
Other kinds of road
According to the principle mentioned above, simulations are conducted on split-μ road and step-μ road. Results demonstrate that the TCS-EMS works effectively. The velocities at 10 s after the vehicle is started are summarized in Table 6, where V1 represents the velocity without TCS, and V2 is the velocity at 10 s after TCS is applied.
Simulation results.

SOC: state of charge.
From the simulation results above, it can be concluded that the vehicle’s dynamic performance is improved enormously after the TCS-EMS is employed in any of the operation modes. As the adhesion coefficient is in the range of common roads, the integrated strategy has a good performance in increasing vehicle speed. As a result, the wasted energy by over-slip decreases, and there is no doubt that the energy is used more effectively. So, there is reason to believe that the TCS-EMS is proved to be able to fulfill the demands of fuel efficiency and power, according to the above simulation results.
Conclusion
A parallel AWD PHEV configuration is described in this article, which is easy to reconfigure from a traditional vehicle. An integrated strategy is proposed in this article for the AWD PHEV to realize the efficient fuel using. A CD/CS strategy is adopted to realize the power management based on the optimal operation curve of engine. TCS is integrated into the CD/CS strategy to enhance the vehicle traction, considering the AWD PHEV’s particularity. Traction enhancement helps to save the unnecessary fuel consumption indirectly under certain conditions, such as low cohesive roads. The strategy is carried out on uniform adhesion, split-μ and step-μ roads using the computer simulation environment of AMESim and MATLAB/Simulink. Results show that the velocity is increased by an average increase of more than 24% on low cohesive roads, which signifies that the dynamic performance is improved remarkably during launching on low cohesive roads. And, fuel consumption results show that the vehicle has the potential of maintaining low fuel consumption about 2.5 L/100 km under NEDC.
Compared with the CD/CS strategy generally applied in automobile engineering, the newly developed integrated strategy provides a better terrain adaptability. Not only can the general operation requirements be satisfied under the control of EMS (CD/CS strategy in this article) but also the dynamic performance is improved through TCS in severe conditions.
This article tries to fill the insufficiency of TCS application in PHEV research. The AWD PHEV contained the integrated strategy is more complex compared to traditional vehicle. The design method illustrated in the article is of certain reference value for the study on other configurations of PHEV. The integrated strategy helps to strengthen the vehicle controller and cut down the number of ECUs. Finally, the control strategy improves the competitiveness of the AWD PHEV itself.
Continuing this work, future research will be explored in the following areas: considering the yaw moment and the dynamic performances to strengthen the TCS-EMS; vehicle tests on different roads.
Footnotes
Appendix 1
Handling Editor: Haiping Du
Declaration of conflicting interests
The author(s) declared no potential conflicts of interest with respect to the research, authorship, and/or publication of this article.
Funding
The author(s) disclosed receipt of the following financial support for the research, authorship, and/or publication of this article: This work was supported by the National Natural Science Foundation of China (grant nos 51675214 and 51575221), the Science and Technology Development Projects of Jilin Province, China (grant no. 20160519008JH), and Project 2017127 supported by the Graduate Innovation Fund of Jilin University.