
Abstract
In this article, a numerical model for predicting spring-back in U-draw bending of DP350 high-strength steel sheet was presented. First, the hardening models were formulated based on combined isotropic–kinematic hardening laws, along with the traditional pure isotropic and kinematic hardening laws. A simplified method was proposed for determining the material parameters. Comparison of stress–strain curves of uniaxial tests at various pre-strains predicted by the numerical models and experiment showed that the combined isotropic–kinematic hardening model could accurately describe the Bauschinger effect and transient behavior subjected to cyclic loading conditions. Then, a finite element model was created to simulate the U-draw bending process using ABAQUS. Simulations were then conducted to predict the spring-back of DP350 high-strength steel in U-draw bending with geometry provided in the NUMISHEET’2011 benchmark problems. It was shown that the predictions of spring-back using the proposed model were in good agreement with the experimental results available in the literature. Finally, the effects of various tool and process parameters such as punch profile radius, die profile radius, blank holding force, and punch-to-die clearance on the spring-back were investigated. The simulation results suggested the significance of tool and process parameters on the final shape of the formed parts influenced by the spring-back.
Introduction
Spring-back causes geometric change to a part occurred at the end of the forming process, which consequently affects the dimensional accuracy of a finished part. As a result, the metal forming industry has been faced with a crucial problem: predicting the final part geometry after spring-back. Nowadays, spring-back is still one of the major issues in metal forming and manufacturing, which has attracted significant researchers’ attention. 1
Advanced high-strength steels are being used increasingly in automotive and other stamping applications to replace conventional steels because of the increasing requirements in light-weighting, safety performance, and energy saving products. Advanced high-strength steel sheets have higher strength, lower weight, and more cost effectiveness in production compared to other alloys of the same density, which can be used in automotive applications. 2 However, advanced high-strength steels bring additional undesired formability concerns, in particular a significant increase in elastic spring-back. Meeting the dimensional specifications of tool and process parameters to produce parts made of these materials is challenging. Therefore, predicting the spring-back through accurate simulation is becoming more important to reduce the production cost by lowering the invested time and tryout loops.
The prediction of spring-back using numerical methods has received considerable attention by researchers. Among many numerical methods, the finite element (FE) method is currently the most popular approach, thanks to its flexibility for different shapes of specimen and process parameter adjustment. 3 Scientific advances in spring-back prediction can be broadly divided into two categories. The first category concerns with developing a finite element model (FEM) for spring-back prediction. In general, the accuracy of the spring-back prediction with the FEM generally depends on the applied yield criterion, hardening model, and material parameters. 4 The widely used constitutive models such as the Hill’ 1948, 5 Barlat’ 1989, 6 Yoshida and Uemori, 7 the modified Armstrong–Frederick, 8 and Chaboche 9 models are the mainstream of the application. 10 Chung et al. 11 developed a numerical procedure by utilizing a combined isotropic–kinematic hardening law based on the modified Chaboche model. Oliveira et al. 12 studied the effect of different work-hardening models on the numerical prediction of the spring-back. Sumikawa et al. 13 suggested an improved model for spring-back prediction of advanced high-strength steels considering nonlinear elastoplastic behavior after stress reversal. Ghaei et al. 14 also improved the spring-back predictions by incorporating the nonlinear unloading–reloading stress–strain response in the numerical model. Recently, Dai et al. 15 proposed a mixed plastic hardening rule to predict the spring-back for a U-shaped high-strength and low-alloy steel plate.
The second category focuses on the applications of the numerical model for determining and controlling the spring-back in the forming process. Li et al. 16 explored the sensitivity of various design and process parameters to twist spring-back of advanced high-strength steels. Lee and Kim 17 focused on the evaluation of spring-back occurring in the sheet metal flange drawing by controlling some process factors. They found that the punch profile radius is the most important factor of the process. Investigations of spring-back for advanced high-strength steel have been conducted considering various effects such as pre-strain, material orientation, variable elastic modulus, microstructure of material, blank size, and coating.18–24 Lim et al. 25 investigated time-dependent spring-back occurring in advanced high-strength steels. They concluded that the creep driven by residual stresses after formation is the major mechanism of time-dependent spring-back, which is affected by the elastic modulus and deformation-induced heating. Komgrit et al. 26 proposed a method to eliminate the spring-back of a high-strength steel sheet using a bottom counterpunch. Jiang and Dai 27 reported that both time-dependent and total spring-back angles decrease with the increase of friction coefficient and blank holder force (BHF). From the literature review, it is seen that there have been very few studies that attempted to explain the reason behind the variation tendency of spring-back subjected to varying process parameters. Several studies have focused on the development of a numerical model or carrying out parametric investigations.16–22 However, a thorough discussion on the spring-back behavior based on stress–strain responses for DP350 high-strength steel is still lacking.
In this study, a simplified model applicable for predicting the spring-back of high-strength steels is developed. The FE analysis of DP350 high-strength steel sheets in U-draw bending is conducted for spring-back evaluation with the geometry adopted from the NUMISHEET’2011 benchmark problems. The material hardening model is formulated based on the combined isotropic–kinematic hardening law. For the purpose of comparison, different models based on the traditional pure isotropic and kinematic hardening laws are also presented. Comparison of the predicted and measured stress–strain curves at various pre-strains is performed to verify the proposed hardening model. The spring-back of DP350 high-strength steel in U-draw bending is then simulated using ABAQUS commercial software. To validate the FEM, the simulated spring-back results are compared to the experimental data available in the literature. Further simulations are carried out to investigate the effects of the tooling and process parameters on the spring-back: punch profile radius, die profile radius, BHF, and punch-to-die clearance. Extensive analyses of the stress and strain responses are provided to explain the spring-back for the proposed problems.
Hardening models of a DP350 high-strength steel sheet
Material
Table 1 shows the chemical composition of the DP350 high-strength steel. Table 2 indicates the mechanical properties of this material. To determine the stress–strain behavior and the hardening parameters of the material, the Voce hardening law is used as described in equation (1)

where A and B are the plastic coefficients and
Chemical composition of the material (wt%).

Mechanical properties of the material.


The hardening model
In order to simulate the sheet metal forming process and then spring-back prediction, one of the important steps is to describe the mechanical behavior of materials at different pre-strains. Accurate assessment of material properties is of significant importance for spring-back or any metal forming analysis using an FEM. 29 In particular, the Bauschinger and yield effect should be modeled correctly when the testing specimens are subjected to cyclic loading. Figure 1(b) shows the stress–strain curves at different pre-strains determined by experiment. 30 This figure clearly shows the Bauschinger effect that occurred during reverse loading with a less stress. The hardening models used for spring-back simulation should accurately describe the above features, because the amount of spring-back depends significantly on the stresses in the material before unloading and unloading conditions. 11
In this study, the combined hardening laws proposed by Amstrong and Frederick 8 and developed later by Chaboche 9 are adopted. This model has been modified by Chung et al. 11 However, to elaborate the model using Chung et al.’s approach, too many procedures for obtaining material parameters are required. This study proposes a simplified method for obtaining material parameters applying for DP350 high-strength steel.
The von Mises yield surface both translates and expands with plastic strain and is defined as

where

where Sij is the deviatoric part of the current stress determined by

where σ, σm, and I are the current values of the stress and mean stress, and the identity matrix, respectively. The dependence between back-stress increment and equivalent plastic strain is given by

where the material coefficients C and γ are unknown.
For the purpose of comparison, the models based on two other laws are also presented, for example, pure isotropic hardening and kinematic hardening laws. In the pure isotropic hardening law, the back-stress α is zero. Then the von Mises yield surface in equation (2) will be rewritten as

The consistency condition for isotropic hardening can be derived by taking the rate of equation (6) as

Regarding kinematic hardening law, the von Mises yield condition is dependent on the stress difference ξ with only the translation of yield locus following back-stress α as given in equation (2). However, because the size of yield surface, which is represented by the rate of uniaxial equivalent yield stress, does not grow

To verify the effect of hardening laws on the stress–strain curve prediction, the stress–strain data obtained from the experiment are used as the input of ABAQUS/Explicit to simulate the uniaxial tension/compression tests of specimens. The shell elements S4R are used to simulate the uniaxial tension/compression testing specimen. The average element size of the shell elements is about 1.2 mm in width and 2.8 mm in length. The flat steel plate is modeled using rigid surface elements R3D4. Figure 2(a) depicts the deformed shapes of the specimen in the FE simulation.

(a) FE model for simulation of uniaxial tension/compression tests, (b) back-stress α determined for the kinematic hardening law, and (c) the hardening parameters determined for the combined isotropic–kinematic hardening law.
When the isotropic hardening law is adopted for the simulation of the uniaxial tension/compression tests, the parameters, σY, A, and B as shown in equation (1) are needed as inputs. Regarding the kinematic hardening law, the kinematic hardening parameters C and γ shown in equation (5) need to be determined. In this way, the back-stress α curve is first obtained by offsetting the tensile stress–strain curve by the yield stress value (σY) as shown in Figure 2(b). Then a fitting method based on the back-stress evolution law depicted in equation (9) is utilized to calculate C and γ. For DP350 high-strength steel, the values of C and γ are found as 6452.752 MPa and 18.583, respectively

Regarding the combined isotropic–kinematic hardening law, the data from tension and compression tests are used to determine the back-stress α curve. First, discrete values of back-stress are calculated by

where

Using equation (11), the hardening parameters A and B in equation (1) can be determined as 173.124 MPa and 6.255, respectively. With finding the four hardening parameters A, B, C, and γ, the material model based on the combined isotropic–kinematic hardening law is made available.
Figure 3 shows the stress–strain curve prediction at various pre-strains and its comparison with the corresponding experimental data. As shown in Figure 3(a), isotropic hardening law overestimates the stress after load reversals from tension to compression or vice versa. In addition, this model fails to capture the Bauschinger effect, transient behavior, and permanent softening. Figure 3(b) shows the stress–strain curves predicted by the model based on kinematic hardening law. Contrary to the isotropic mode, the kinematic model underestimates the Bauschinger effect after reverse loading occurrence. With the combined kinematic–isotropic hardening law, Figure 3(c) shows that a good correlation between the proposed model and the experimental data is achieved. It is observed that the proposed model well represents the hardening data including the Bauschinger effect and transient behavior compared to the experimental data.
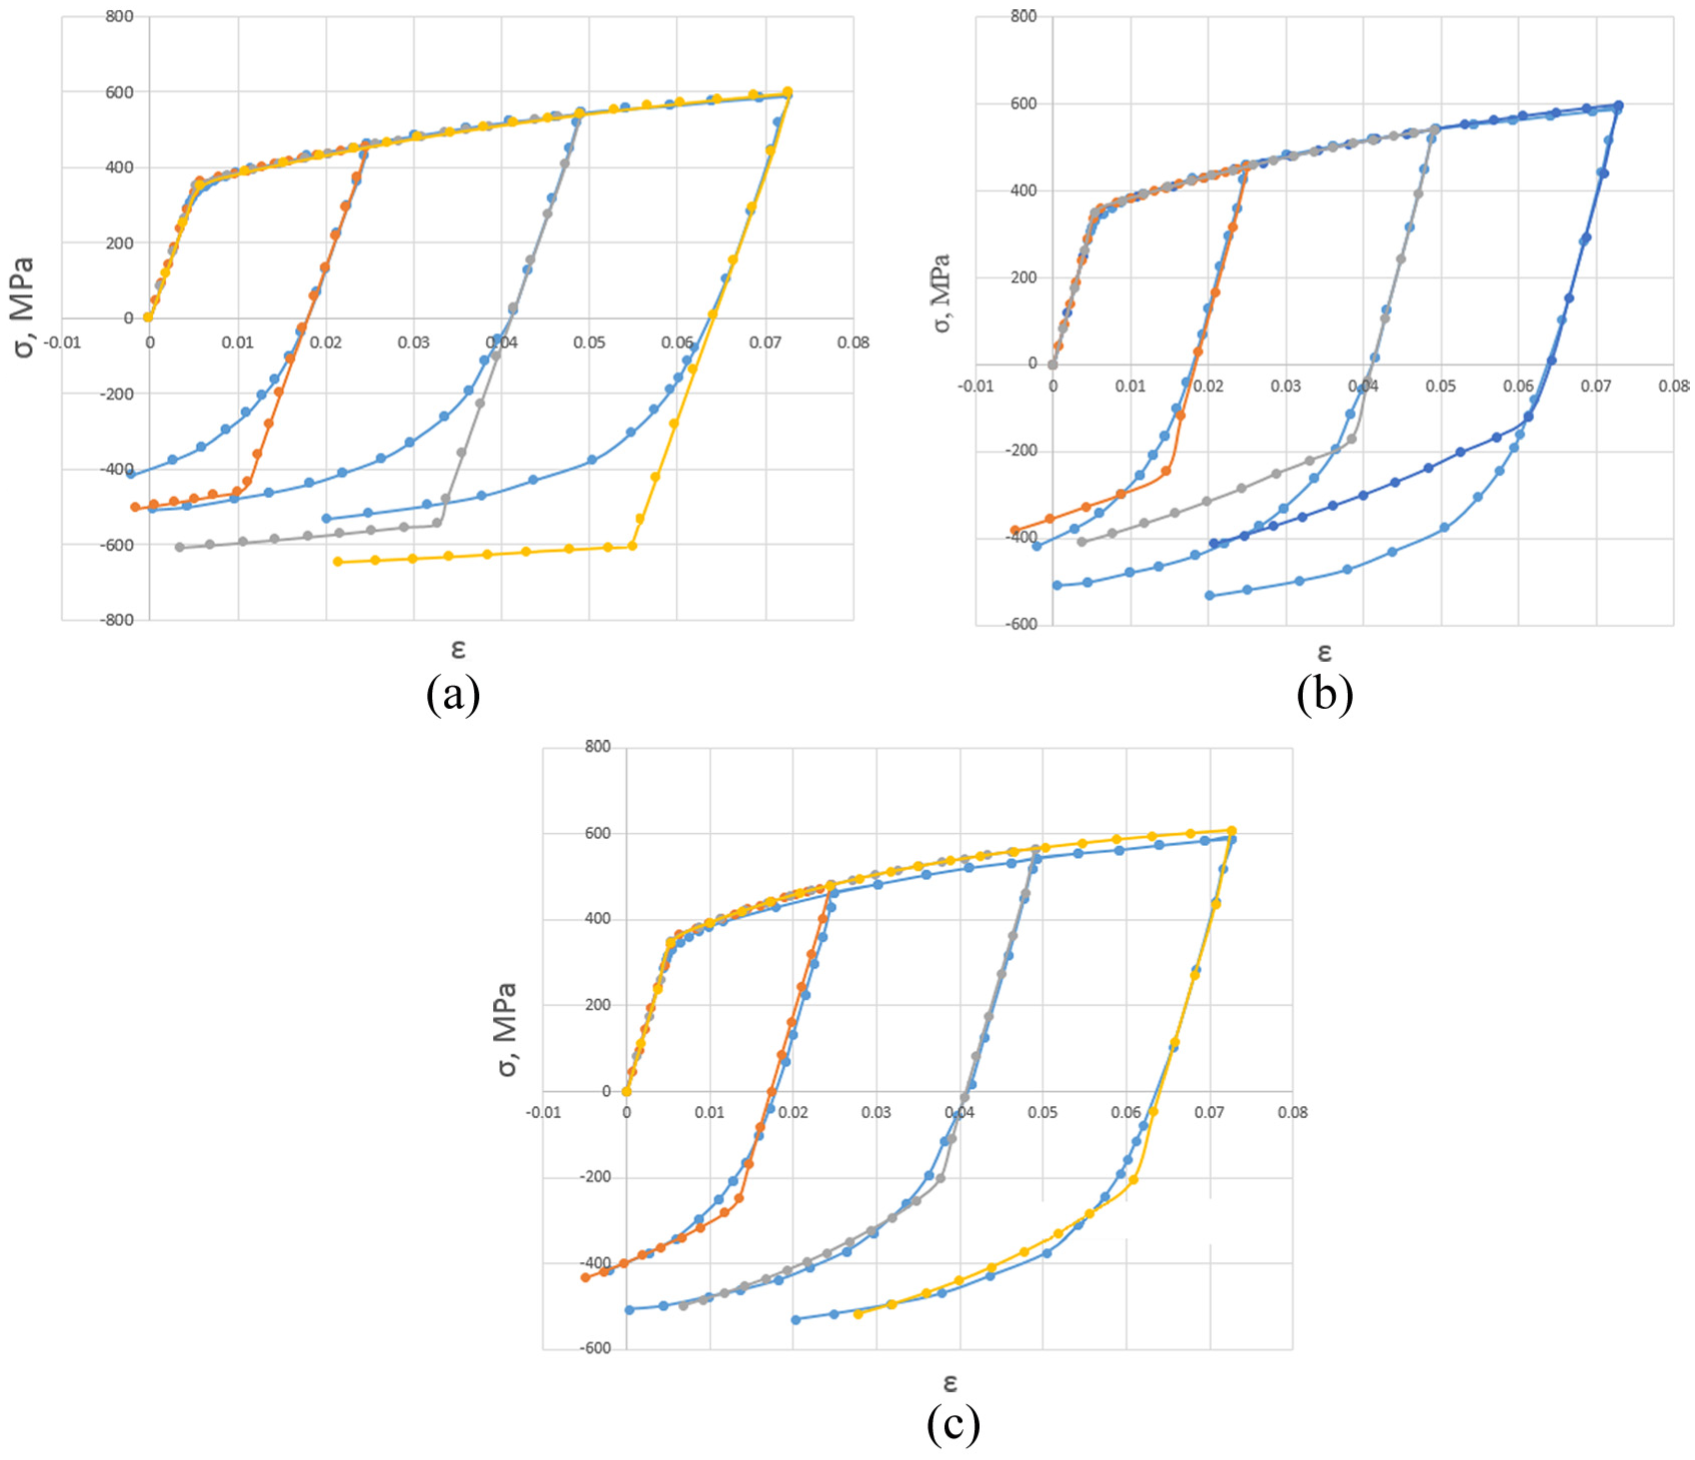
Comparison of the calculated and measured hardening behaviors in tension/compression tests for the three models: (a) isotropic model, (b) kinematic model, and (c) combined isotropic/kinematic model.
FE simulation of the spring-back inU-draw/bending process
The U-draw bending parts are widely used in industrial applications and are of great research significance.31–33 The spring-back problem commonly occurs in theU-draw bending, especially for the high-strength steel sheets. To simulate the spring-back behavior of DP350 high-strength steel sheets in U-draw bending, FE simulations are conducted with the geometry adopted from the NUMISHEET’2011 benchmark problem as shown in Figure 7, where LD, LP, and LH indicate the widths of die, punch, and blank holder and RD, RP, and Δ represent the die and punch profile radii, and the gap between the blank holder and the punch, respectively. An FEM is constructed in ABAQUS based on the tool geometry (Figure 4(a)). The punch, die, and holder are modeled with R3D4 rigid surface elements. The reduced four-node shell element S4R deformation model is used for the high-strength steel sheet elements. The average size of the sheet is 300 mm (length)×35mm (width) × 1.2 mm (thickness). The mesh sizes are 1 mm (length) × 8.75 mm (width). The simulation is carried out with a constant punch speed of 0.7 mm/s. The friction behavior is modeled using the Coulomb friction law. The values of the friction coefficient µ1 between the blank and the die/the blank holder are assumed unchanged and equal to 0.1.

(a) Diagram of the U-draw bending process and (b) measurement of the spring-back parameters.
The spring-back is the measure of the difference between the final shape of the formed part at the end of the forming stage and the shape after removing the tools. Figure 4(b) shows the cross-sectional shape of the formed part obtained after the removal of tools. Three spring-back parameters, namely, spring-back angles θ1, θ2 and sidewall curl radius ρ, are considered. After the FE simulations, image files of the samples are exported and the spring-back parameters are measured using AutoCAD, a commercial drafting software.
Model verification
In this section, FEM simulations of the U-draw bending process are performed. The model verification is made by comparing with the experimental results. Figure 5(a) shows the predicted and measured spring-back parameters of the DP350 high-strength steel sheet in U-draw bending. The simulated results obtained from the three models: isotropic model (ISO), kinematic model (KIN), and combined isotropic–kinematic model (ISO-KIN) are represented. The tooling dimensions and process parameters are as follows: LP = 58 mm, LD = 62 mm, LH = 50 mm, Δ = 1 mm, RP = 10 mm, RD = 6 mm, and BHF = 2.5 kN. It is clear from Figure 5(a) that all the models can predict spring-back angles fairly well. However, only the ISO-KIN can well predict the sidewall curl radius compared to the experiment. The model based on pure isotropic and kinematic hardening laws either over- or underestimates the sidewall curl radius. In comparison to the experiment, 34 the errors of spring-back prediction with the combined isotropic–kinematic hardening model are below 3.0% for spring-back angles and 14.6% for sidewall curvature. Regarding the ISO and KIN, the spring-back angles are predicted within an error of 10.5% and 36.4% for the sidewall curvature radius.

Figure 5(b) shows the edges of the samples before and after spring-back with three different hardening models and experiment. It is clear that the choice of the hardening model significantly affects the final shape of the formed part under the spring-back effect.
It is well understood that the high stress that occurred in the deformed part is relieved causing the redistribution of stress and thus the spring-back. Consequently, the spring-back resulted from the redistribution of the internal stresses during unloading. Since the amount of spring-back depends on the local stress developed in the formed parts, the calculated stress distributions at the end of the forming process are important. Figure 6 shows the von Mises stress distribution in the samples before and after the removal of tool, that is, before and after spring-back. It is shown in Figure 6 that the ISO seems to overestimate the stress, whereas KIN underestimates the stress in the samples in comparison to the ISO-KIN prediction. Therefore, the spring-back predicted by those models also deviated from ISO-KIN.
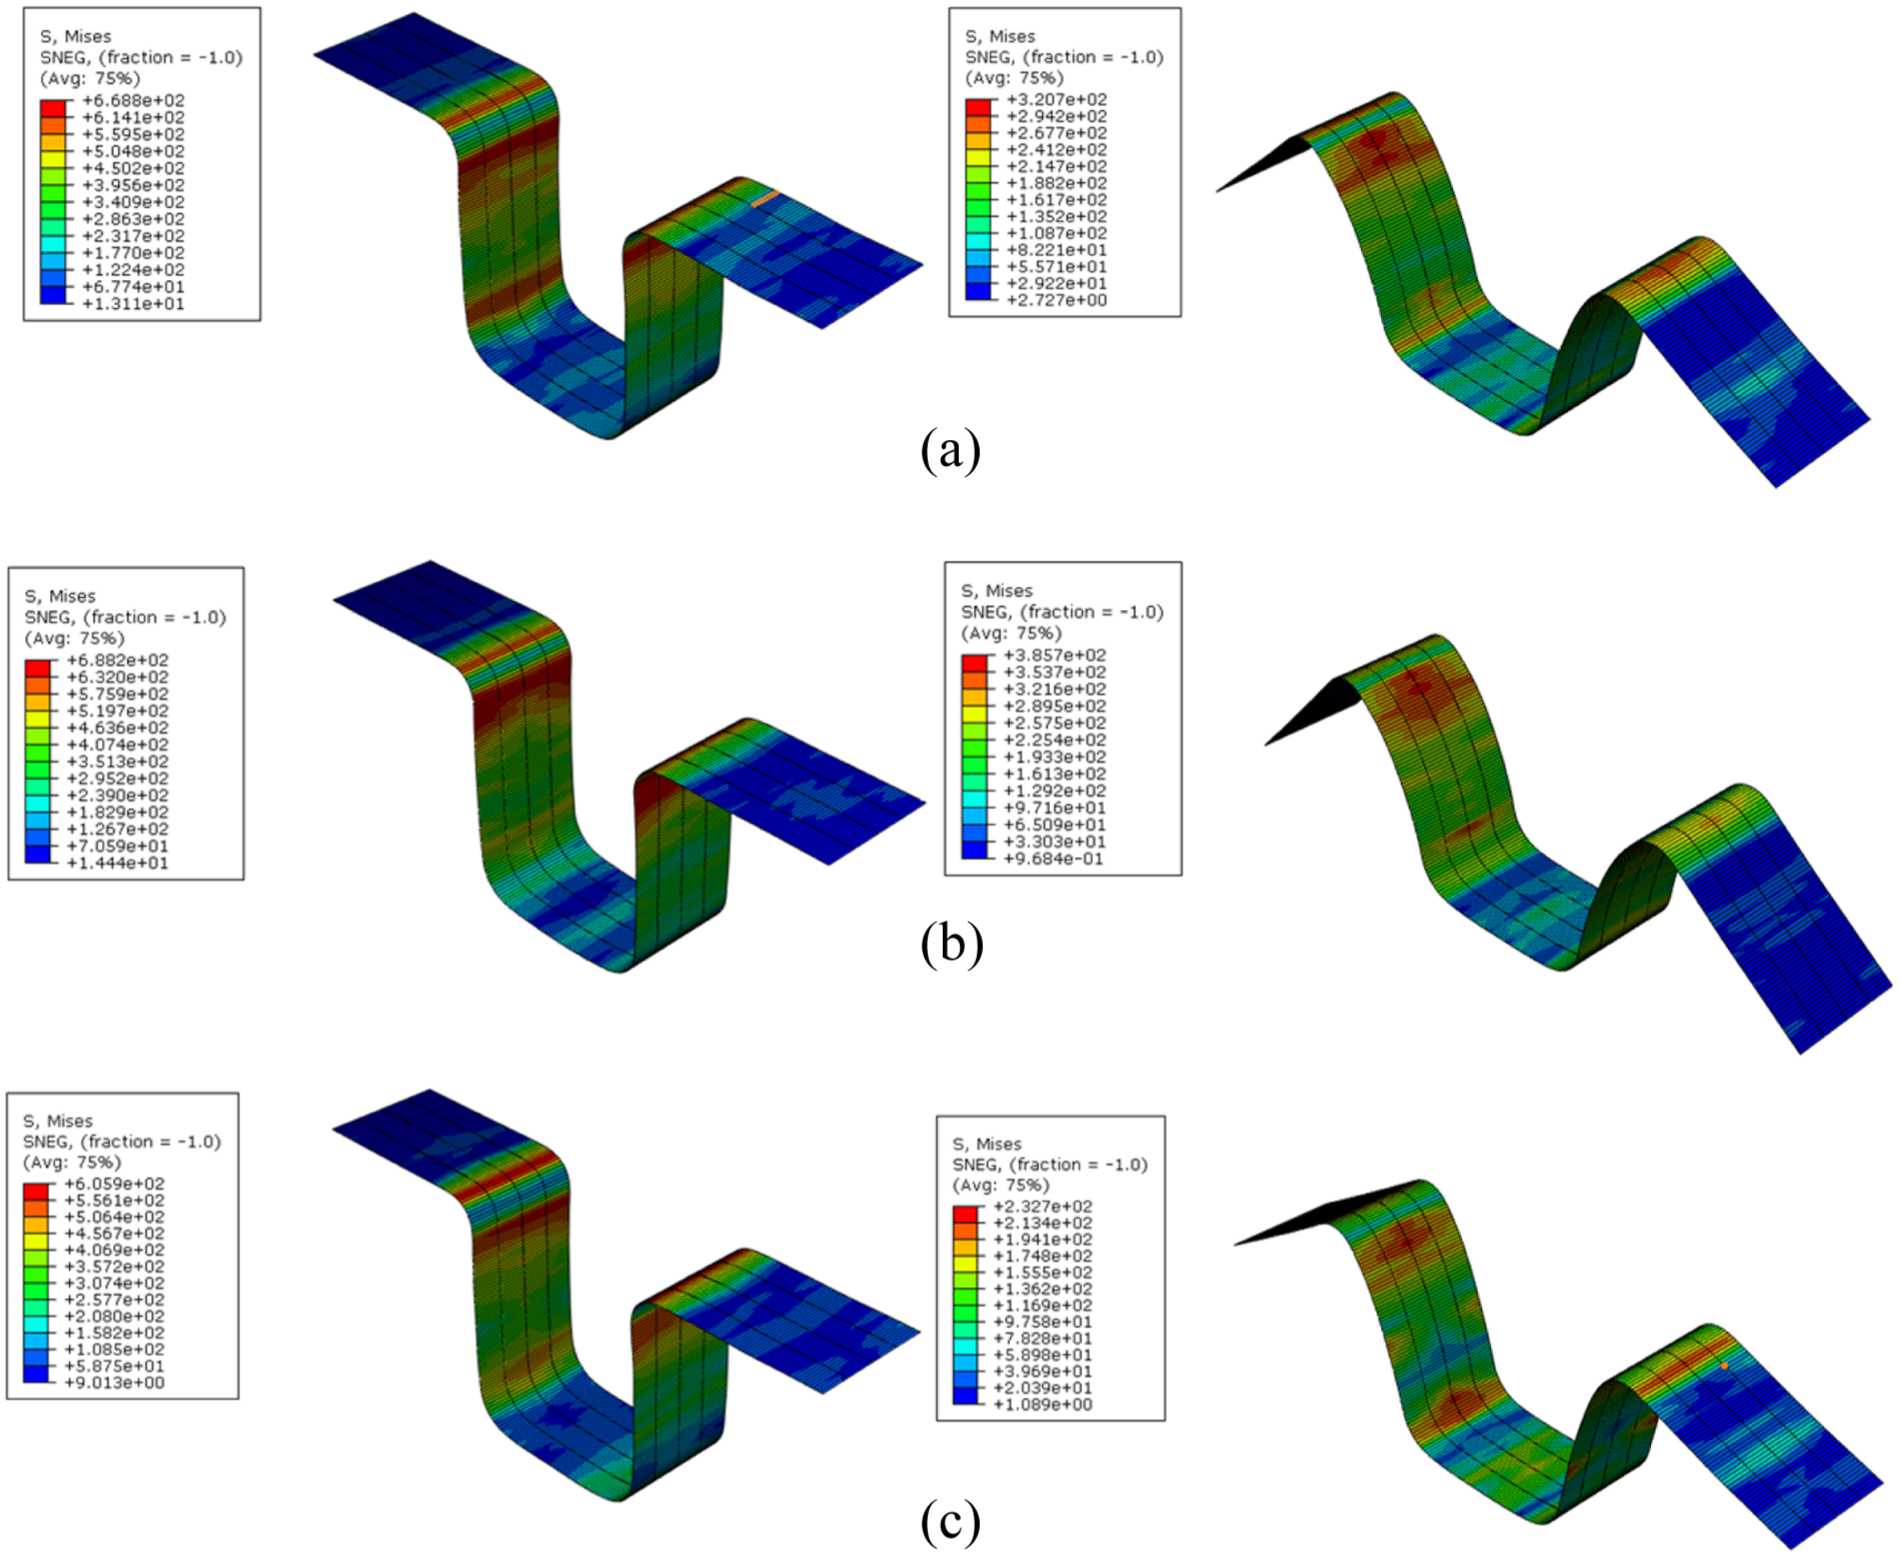
Simulated von Mises stress distribution before and after spring-back using three models: (a) ISO-KIN, (b) ISO, and(c) KIN.
Figure 7(a) shows the effective stress–strain response of a representative FE element located in the middle of the sidewall (Figure 5(b)). Here, the stresses and strains are calculated on the outer and inner surfaces of the shell element. During the U-draw bending process, the outer part of the sidewall element is deformed through compression (caused by bending over the die corner) and then tension (as straightened along the sidewall). On the other hand, the inner part of the sidewall element is deformed through tension (as bent over the die corner) subsequent by tension (as straightened along the sidewall). Figure 7(b) shows the effective stress evolution in a cycle of U-draw bending and spring-back period. It is observed that the residual stress in the part is relieved after the tool removal. Such stress relaxation in response to the same amount of strain causes the spring-back and thus affects the final shape of the part.

Effective stress evolution in the U-draw bending process: (a) effective stress–strain response at the specified elements during U-draw bending and (b) effective stress evolution in a cycle of U-draw bending and spring-back period.
Effects of tool and process parameters on the spring-back
It is known that the spring-back behavior of sheet metal forming is usually influenced by tooling geometry and process parameters.14–17 Therefore, a comprehensive assessment of variations of these factors affecting the spring-back is important. In this section, the effects of RD, RP, BHF, and punch-to-die clearance on the spring-back in U-draw bending of DP350 high-strength steel sheet are investigated. The following tool dimensions are kept constant as follows: LD = 62 mm, Δ = 1 mm, and LH = 50 mm. The punch width LP is set to be 58 mm for all investigations, except the study on punch-to-die clearance.
Effect of die profile radius on the spring-back parameters
Figure 8(a) shows the effect of the die profile radius RD on the spring-back parameters. The punch profile radius and BHF are RP = 10 mm and BHF = 2.5 kN, respectively. It is known that the spring-back is reduced when the angles θ1 and θ2 are close to 90° and the sidewall curl radius becomes bigger. It is seen from Figure 8(a) that the spring-back angle θ1 is almost independent of RD. On the other hand, the sidewall curl radius ρ drastically reduces with increasing RD, which implies the increase of spring-back. This is because the increasing RD results in a higher amount of stress relaxation rate before and after spring-back, which will be explained later. Figure 8(a) also demonstrates that with the increase of RD from 4 to 13 mm, the angle θ2 gradually reaches 90°, that is, decrease of spring-back. It is interesting that the behavior of the angle θ2 becomes “spring-go” with RD above 13 mm, and beyond this value θ2 is higher than 90°. This could be due to the reduction of elastic strain near the die corner with the increase of RD. Therefore, when RD reaches a certain value, the elastic strain generated is insufficient to produce any degree of spring-back with respect to angle θ2.
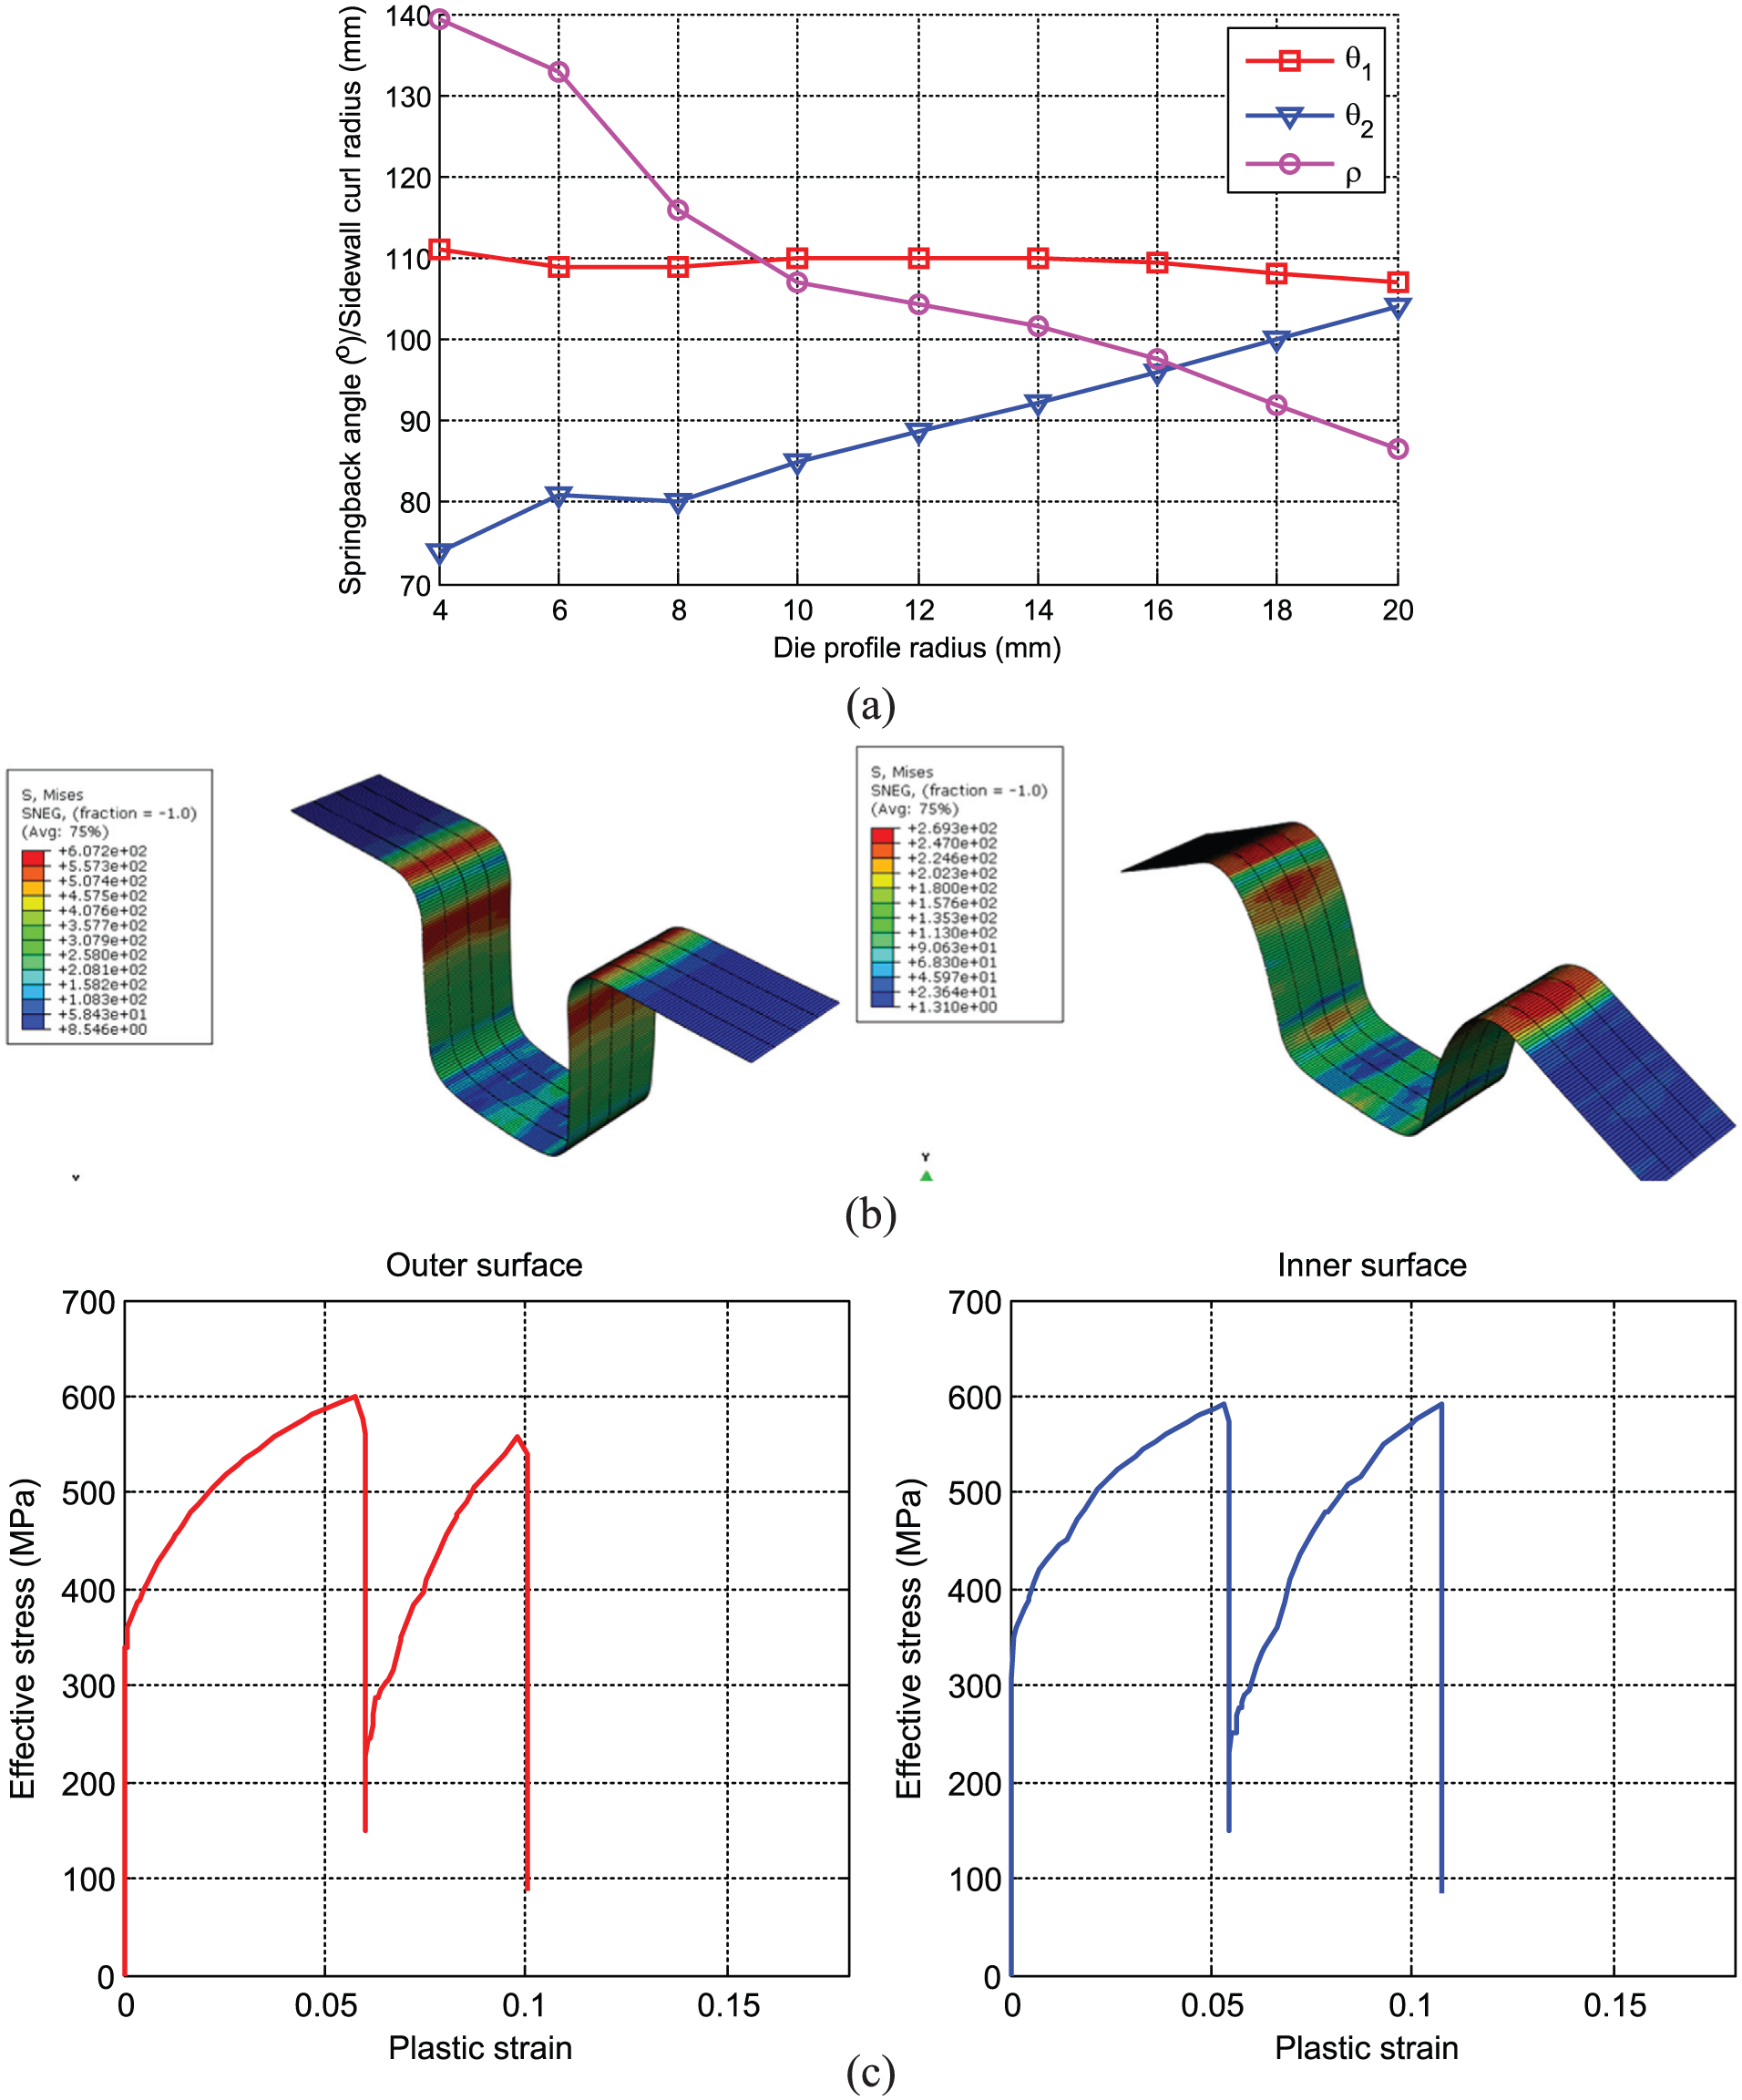
Effect of die profile radius on the spring-back: (a) spring-back parameters, (b) simulated von Mises stress distribution before and after spring-back (RD = 10 mm), and (c) effective stress–strain response at the specified elements (RD = 10 mm).
Figure 8(b) shows the residual stress distribution in the formed part before and after spring-back with RD = 10 mm. Comparing to the stress distribution in the case of lower die profile radius (RD = 6 mm) shown in Figure 11, it is observed that higher RD leads to a reduction of residual stress both before and after spring-back because of increasing bending radius at the die corner. However, the rate of stress relaxation before and after spring-back with higher RD is higher, that is, 55.7% with RD = 10 mm (Figure 8(b)) when comparing to 43.96% with RD = 6 mm (Figure 6).
Figure 8(c) illustrates the effective stress–strain response determined for an FE element in the middle of the sidewall in the case of RD = 10 mm. Comparing to the results in Figure 7(b) estimated for RD = 6 mm, it is clear that the amount of elastic strain reduces significantly with increasing RD.
Effect of punch profile radius on the spring-back parameters
Figure 9(a) demonstrates the effect of the punch profile radius RP on the spring-back parameters. The die profile radius and BHF are unchanged and equal to RD = 6 mm and BHF = 2.5 kN, respectively. The sidewall curl radius ρ reduces rapidly when RP exceeds 10 mm (Figure 9(a)). On the other hand, the spring-back angles θ1 and θ2 seem to be less influenced by the punch profile radius. However, the spring-back shows an overall increasing tendency with the increase of RP. In fact, an appropriate range of RP from about 6 to 10 mm can be easily identified, which could lessen the spring-back in the formed part.

Effect of punch profile radius on the spring-back: (a) spring-back parameters and (b) effective stress of the specified elements at the inner and outer surfaces.
Figure 9(b) shows the comparison of the evolution of effective stress developed in the elements in the middle of the sidewall specified in Figure 5(b) during one cycle of the U-draw bending process with the punch profile radii of 5 and 10 mm. It is seen that the bending stress at the die corner of the investigated elements occurs earlier in the case of smaller RP. This is because even under the same stroke length of U-draw bending a smaller RP results in a longer blank strip wrapping around the punch. Consequently, the moving speed of the specified elements before passing the die corner is higher for the smaller RP, in comparison to the larger one. However, such difference in moving speed may provide insignificant contribution to the stress amplitude, since the amplitudes of stress generated during the entire forming process are almost identical for both values of RP as shown in Figure 9(b).
Effect of BHF on the spring-back parameters
Controlling the BHF is one of the traditional methods to compensate for spring-back. In order to study the BHF and spring-back relationship, different BHF values are selected from 2 to 20 kN. The punch profile and die profile radii are set at RP = 10 mm and RD = 6 mm, respectively. Figure 10(a) shows the spring-back parameters as a function of BHF. As expected, the spring-back is reduced with increasing BHF reflecting by the increase of ρ and the varying trend of θ1 and θ2 toward 90°. Among them, ρ shows a significant dependence on BHF, in comparison to θ1 and θ2. It is noted that the spring-back angles have a more intense variation for smaller values of BHF. The decrease of the spring-back amount caused by BHF can be explained by a more uniform stress distribution through sidewall thickness. In addition, the reducing spring-back is also caused by the increase of plastic strains in the blank. Figure 10(b) further displays the history of plastic strain for the specified elements simulated at the BHFs of 2.5 and 5 kN. Figure 10(b) shows that the plastic strains for BHF = 5 kN are higher than those for BHF = 2.5 kN, which is attributed to the reduction of spring-back. Even though BHF enhances spring-back performance, a careful selection of BHF needs to be considered because increasing BHF leads to the increase of the required punch load in the forming process.

Effect of blank holder force on the spring-back: (a) spring-back parameters and (b) history of plastic strain for the specified elements at the inner and outer surfaces.
Effect of die and punch clearance on the spring-back
The dimensionless clearance εp is used in this study, which is defined by the ratio between the punch-to-die clearance and the thickness of the sample. To change εp, the punch width LP is subjected to change, while the blank thickness is kept constant at 1.2 mm. Figure 11 illustrates the effect of εp varying from 1.2 to 2.0 on the spring-back parameters. εp likely does not reveal any clear effect on the spring-back behavior. The dimensionless clearance εp around 1.6 may cause an improvement in spring-back performance compared to the other values. However, the improvement is still insignificant. In fact, very large clearance may increase the spring-back.

Effect of the ratio of clearance and sample thickness on the spring-back.
Conclusion
In this article, a numerical model for predicting spring-back in U-draw bending of DP350 high-strength steel sheet has been presented. The model was based on the combined isotropic and kinematic hardening laws. To reduce the expensive computational procedure of the numerical model, the material parameters were determined using a simplified method. Comparison of the spring-back parameters predicted by the present model and the measured data showed an improvement in the prediction accuracy in comparison to the traditional pure isotropic or kinematic models. A numerical investigation on the effects of punch and die profile radii, BHF, and die-to-punch clearance on the spring-back behavior has been conducted. Extensive analysis of the stress and strain responses provided a better understanding of the spring-back behavior subjected to varying process parameters. From the numerical results, it can be concluded that the sidewall radius is highly sensitive to the change of process parameters. Increasing punch or die profile radii generally increased the spring-back. The BHF increased leading to the reduction of the spring-back, which is attributed mainly to the increase of plastic strain in the deformed part. The predicted spring-back parameters demonstrated a negligible influence of the clearance between the die and punch.
Footnotes
Handling Editor: Shun-Peng Zhu
Declaration of conflicting interests
The author(s) declared no potential conflicts of interest with respect to the research, authorship, and/or publication of this article.
Funding
The author(s) disclosed receipt of the following financial support for the research, authorship, and/or publication of this article: This research was funded by the Vietnam National Foundation for Science and Technology Development (NAFOSTED) under grant no. “107.02-2106.01.”