
Abstract
Damage monitoring systems based on Lamb wave health monitoring technology have attracted considerable attention for scientific research and industrial applications. In this article, two types of single-mode Lamb waves are obtained using symmetric and anti-symmetric methods, respectively, to determine a crack identification signal. A numerical simulation of a welded steel plate model was conducted using the ABAQUS/EXPLICIT module, which is a dynamic solver. The propagation process and the corresponding effect of the Lamb waves over the complete and damaged models are simulated. According to the propagation characteristics and with the assistance of the ellipse localization method with MATLAB, the location of crack damage is simulated by the amplitude addition method and the crack damage location is determined. The results show that the simulation results are in good agreement with the actual crack damage. Furthermore, the received signals are compared and analyzed from an energy perspective. Two types of single-mode Lamb wave monitoring methods are also compared. In addition, it is demonstrated that a symmetric excitation can simplify the received waves and recognize crack damage in plates in welded steel structures from an experimental perspective of this work.
Keywords
Introduction
Engineering structures undergo gradual deterioration over time as the result of static and dynamic loading, temperature, humidity, wind, and corrosive factors. Su et al. 1 thought that the early detection of potential defects and the identification of their locations are necessary to ensure the safety of structures. Non-destructive testing (NDT) is often used to evaluate the health of engineering structures. Yu and Ou 2 introduced structural health monitoring (SHM), which is an improved approach over traditional NDT. Tang et al. 3 and Sikdar and Banerjee 4 used SHM to monitor structural damage continuously. In recent years, active acoustic emission (AE) monitoring technology based on Lamb waves has been applied to monitor structures composed of metal and composite materials (Alamdari et al., 5 Rucka and Wilde, 6 Katunin, 7 Katunin and Holewik, 8 and Yu et al. 9 ). However, actual engineering structures are more complex, such as structures containing welding. Complex structure damage monitoring based on Lamb waves exhibits considerable potential. It is necessary to further investigate the propagation properties of Lamb waves in welded structures to detect damage in welded structures.
Several successful applications using guided wave–based methods in welded complicated structures have been investigated to identify changes in the transmission velocity or energy of the elastic waves associated with welds or defects. Jin et al. 10 formulated a wave element used in the boundary element method to study Lamb wave propagation and interaction in plates. Park et al. 11 presented the results of experimental studies on piezoceramic (PZT)-based active damage detection techniques for steel bridge components employing several damage-sensitive features, such as root mean square deviations (RMSDs) in the impedances and wavelet coefficients (WCs) and the time of flight (TOF) of Lamb waves. Juluri et al. 12 investigated a compression wave guided by the weld, which is stronger than Lamb waves. In SHM, Lamb waves are a guided wave modality. The propagation of Lamb waves is through particle motions between the two surfaces in a thin plate-like medium. Using Lamb wave–based SHM systems, there is no need to scan the entire object under consideration, and all of the data can be acquired from a single probe position. Lamb waves can be applied for damage identification in plate structures. However, the multimode and dispersion phenomena of Lamb waves make each mode wave packet overlap easily, which makes signal processing difficult, which thus limits the application of Lamb waves in structural damage detection. According to the characteristics of Lamb waves, even if the excitation frequency is below the cut-off frequency, there are still two basic wave modes in the structure. One mode is a symmetric mode (S0), and the other is an anti-symmetric mode (A0). Figures 1 and 2 depict the vibrations of particles in symmetric and anti-symmetric modes during the propagation of Lamb waves, respectively. The traditional method for identifying damage is based on the sensitivity of the two basic modes of Lamb waves. However, the interference of the two modes adds complexity to signal processing. When reconstructing the inversion signal to extract the time parameters, multimode Lamb waves will interfere with the signal. Therefore, the simplification of Lamb wave modes is of great significance for using Lamb waves in the field of structural damage detection.
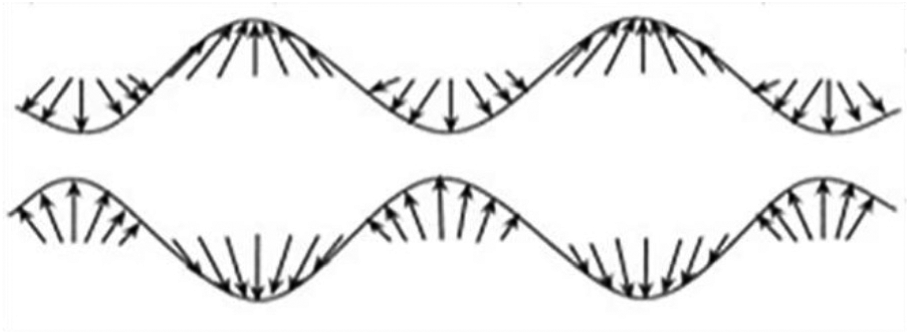
Symmetric Lamb wave.

Anti-symmetric Lamb wave.
In this study, symmetric and anti-symmetric methods are used to excite single-mode Lamb waves. ABAQUS/EXPLICIT is employed to determine the propagation process and the effect of Lamb waves in the complete and damaged models. In addition, experimental analyses are performed and used to verify the simulation results.
Theory
Single-mode Lamb waves
Lamb waves can be generated in planar free plates. When solving the Lamb wave equation, Lamb waves can be divided into the symmetric (S0) and anti-symmetric (A0) modes. For symmetric modes, the wave structure is symmetrically distributed to the plate plane, whereas the vibration direction is symmetric. For anti-symmetric modes, the wave structure is anti-symmetric to the plate surface, whereas the vibration direction is the same.
The motion equation for a particle describes the propagation characteristics under free boundary conditions. The Helmholtz decomposition of the vectors can be used to solve the symmetric (S0) and anti-symmetric (A0) Lamb wave equations

where


For the given ω and h or d, k can be determined, meaning that c can be obtained eventually. Thus, the Lamb wave propagation speed in a plate can be determined for a given frequency. This phenomenon is called dispersion. It is difficult to obtain the analytic solution of the above transcendental equation, and the numerical solution can only be obtained by numerical methods.
The propagation of the abovementioned Lamb wave in the plate is obtained by single-point excitation, as shown in Figure 3(a). A PZT is stacked on a board to excite a Lamb wave. According to the characteristics of the particle vibrations caused by the Lamb wave in the plate, one of the modal waveforms can be eliminated using a double PZT sensor to excite both sides of the sensor simultaneously to obtain a single-mode Lamb wave. Single S0-mode Lamb waves can be obtained in the plate under a symmetric excitation, as shown in Figure 3(b), and single A0-mode Lamb waves can be obtained in the plate under an anti-symmetric excitation, as shown in Figure 3(c).

Excitation method: (a) single point, (b) symmetric, and (c) anti-symmetric.
Ellipse location method
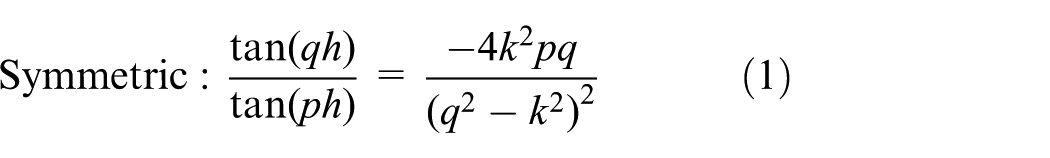
When the plate structure is damaged, applying an excitation at PZT1 and receiving signals at PZT2 results in two signals. The first one generated by PZT1 is beyond the path d to PZT2, and any damage will reflect a signal back to PZT2. For each particular set of sensors, the propagation of the signal is similar to Figure 4. The path r1 + r2 is actually the long axis of an ellipse focusing on the sensor. The elliptic equation can be obtained if the r1 + r2 length is determined. Generally, the damage point is located at the intersection of all the ellipses, as shown in Figure 4.
Ellipse location method.
Generally, there are two methods to determine the multiple elliptic equations.
Ellipse location method based on flight time
When a particular Lamb wave is excited in a plate structure, the group velocity can be obtained by the dispersion curve. The time a Lamb wave takes to reach the sensor is known as the time of flight (TOF). The ellipse long axis 2a = r1 + r2 can be calculated as


The focal length of the ellipse can be determined by the sensor coordinates

Elliptic short axis

Elliptic equation

Elliptic equation based on time delay
For the scenarios where the TOF of the ellipse cannot be obtained accurately, the time delay (Δt) between the TOF and the time of the direct wave can be calculated to obtain the ellipse characteristic parameters. It is assumed that the Lamb wave takes t1 to travel from the piezoelectric actuator directly to the receiving piezoelectric sensor and takes t2 to travel to the receiving piezoelectric through the path r1 + r2. The propagation speed of the signal in the plate structure is related to the material properties. The effect of any minor damage on the elastic modulus of the structure can be neglected. Assuming that the wave velocity of Lamb wave signal is unchanged before and after the damage, d is the distance between the two PZTs, and the time delay can be obtained as

Simulation
Geometric model
According to the material parameters of the steel plate model, the dispersion curve is calculated by MATLAB to obtain the group and phase velocities. The dispersion curves are shown in Figure 5.

(a) Group velocity of a 2-mm-thick steel plate and (b) phase velocity of a 2-mm-thick steel plate.
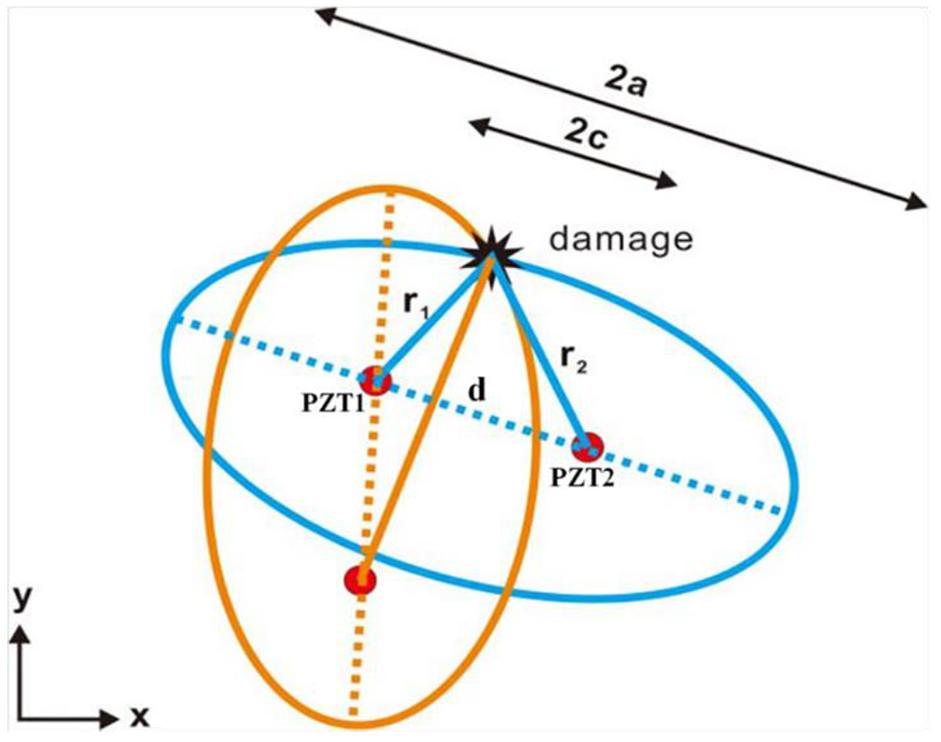
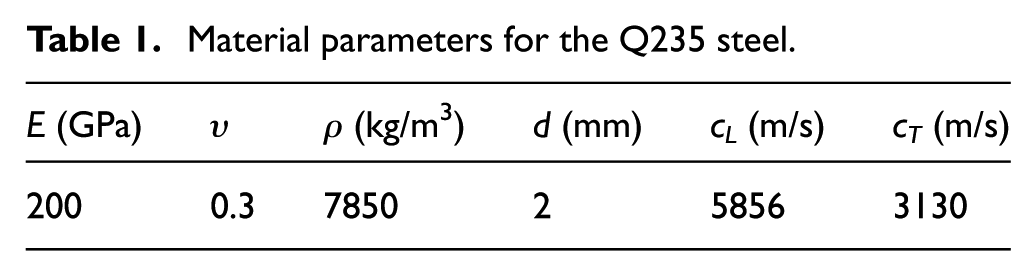
The roof and rib sizes of the Q235 steel plate are 1 m × 1 m × 0.002 m and 1 m × 0.2 m × 0.002 m, respectively. The roof and rib plates are connected by welds. The geometry of the model is shown in Figure 6. The side shown in Figure 6 is the outside. The material coefficient of steel is shown in Table 1. The arrangement of the PZT sensor is also shown in Figure 6. Another important issue regarding the transducers is their configuration and optimal placement (Vanli et al. 13 and Grondel et al. 14 ). The cross-shaped configuration from Wandowski et al. 15 is used in this study. The roof plate is symmetrically excited using symmetrically arranged PZT strain gauges with a diameter of 1 cm. The input signals are equivalently represented by applying uniform in-plane radially concentrated forces on the sensor nodes. The specific coordinates of the PZT1–PZT9 strain gages arranged on the outer side of the roof are shown in Table 2. The inner and outer sides of the roof are symmetrically arranged with PZT1′–PZT9′. The crack damage location in the model is shown in Figure 6 and the crack size is 0.1 m × 0.01 m.
Geometric model.
Material parameters for the Q235 steel.
Coordinates of PZTs.

PZTs: piezoceramics.
Excitation signal
The appropriate excitation frequency should be selected based on the dispersion curve of the group velocity in Figure 5. The center frequency is 250 kHz in this model. In addition to the narrow band principle, the identification of the excitation signal period needs to consider easy identification of the wave packet. A sine wave with 3.5 cycles in Figure 7 shows a clear and obvious characteristic of a total number of five peaks and a left and right symmetrical distribution. The number of wave peaks on both sides of the upper and lower sides is different and distinct, and the wave packet can be resolved by observing the amplitude of the signal and the number of up and down wave peaks in the received signal. At the same time, the time domain width is narrower. Therefore, the sine wave with 3.5 cycles is adopted as the excitation signal.

Sine wave with 3.5 cycles.
Meshing
To ensure the calculation accuracy, an eight-node hexahedron C3D8R element is used to model the steel plate and weld structure. The weld element is modeled as a 1/4 cylinder with a radius of 0.02 m. The grid size setting follows the principle of making the shortest wavelength equal to approximately 10 units (Yelve et al. 16 ). According to the mechanical parameters of the steel plate in Table 1, the transverse wave velocity and longitudinal wave velocity of the isotropic material are expressed as


The appropriate excitation frequency should be selected based on the dispersion curve of the group velocity in Figure 5. The center frequency is 250 kHz in this model and the smallest wavelength (λmin) can be expressed as


According to these results, the typical element edge length (Le) can be determined from

The minimum element edge length is chosen to be 1 mm, and the mesh of the weld element and the PZT on the roof is shown in Figure 8.
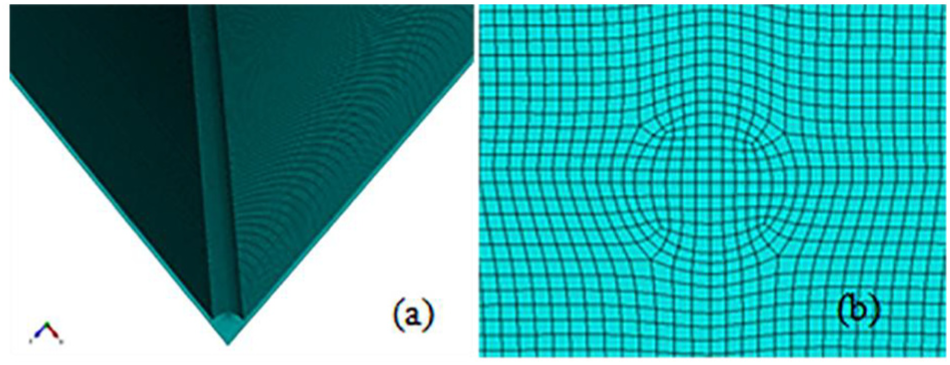
Mesh generation method: (a) weld elements and (b) PZT.
Time step selection
In general, the computational accuracy of the model increases as the integration time step decreases. Therefore, it is highly important to choose an appropriate integration time step. The time step can be calculated from the following two criteria: equations (16) and (17). Equation (16) is the Courant–Friedrichs–Lewy (CFL) condition, which ensures that there are at least 20 time steps during the cycle of a wave at the highest frequency. Equation (17), as given by Moser, uses the minimum element edge length and longitudinal wave velocity to calculate the minimum time step

The maximum time step is set to be 0.1 μs based on Equations (16) and (17). This article uses the ABAQUS/EXPLICIT method to simulate the equations of motion. The central difference method is used to integrate the equations of motion to obtain the node velocity and acceleration. Then, the change in strain is calculated according to the strain rate and the stress is calculated according to constitutive relation before the nodal force is obtained.
Experiment
The ultrasonic Lamb wave excitation device is composed of a signal generator and an amplitude amplifier. The receiving device is an oscilloscope, and a vibration isolation platform is used to receive the Lamb wave signal transmitted in the plate such that the signal is not affected by external vibrations or noise.
Signal generator (Tektronix AFG3102)
A sine wave with the period of 3.5 modulated by a Hanning window is used as the excitation signal. Next, ArbExpress is used to place the excitation signal into an arbitrary waveform generator according to waveform expressions.
2. Amplifier (Linear Amplifier Model EPA-104)
Due to the weak direct input signal, it is necessary to amplify the actuating signal to prevent signal attenuation and amplitude loss. The excitation signal is magnified 20 times.
3. Oscilloscope (DSO5034A)
The oscilloscope has four channels, one of which is selected as the reference channel for the excitation signal, and with the other three channels simultaneously displaying the received waveform and saving the data.
4. Vibration isolation platform
An isolation platform is used to keep the plate from vibrating and safe from outside noise to guarantee the signal stability.
The PZT sensor has positive and negative electrodes, and the charge density is proportional to the external force. In this experiment, the PZT sensor was pasted to the surface of the specimen. The parameter specifications are shown in Table 3.
Parameters for the PZT.

PZT: piezoceramic.
The experiment is based on the active AE of Lamb waves for the identification of damage in the structure. In the experiment, the PZTs are pasted on one side of the specimen according to the positioning coordinates first and later pasting the PZT on the other side at the same coordinates. The weight and cost of the PZTs are low, making it suitable for this experiment. The entire experiment was carried out on an isolation platform. An ultrasonic Lamb wave was excited in the specimen and the signal from the ultrasonic Lamb wave was collected. Then the propagation of signals in the structures and the interactions between the signals and structures were investigated to monitor the damage of the structure and the damage location and degree. The entire experimental process is shown in Figure 9. The test specimen is shown in Figure 10.

Experimental process.
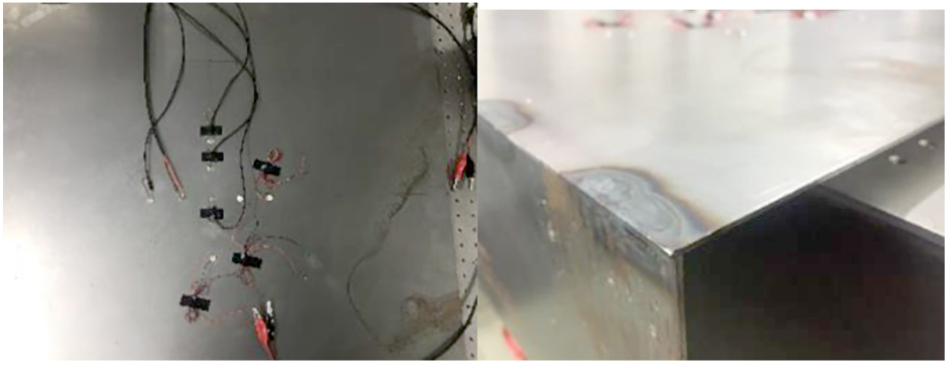
Experimental specimen.
Results and discussion
Analysis of the simulation results
Uniform in-plane radial concentrated forces are applied at PZT1 and PZT1′ in the same direction after modeling, and the vertical displacement of the PZT3 central point is obtained, as shown in Figure 11(a). Next, loads are applied in the opposite direction and the received signals are obtained by PZT3, as shown in Figure 11(b). Figure 9 shows the comparison of A0, S0, and damage reflection of the received signal between symmetric excitation and anti-symmetric excitation.
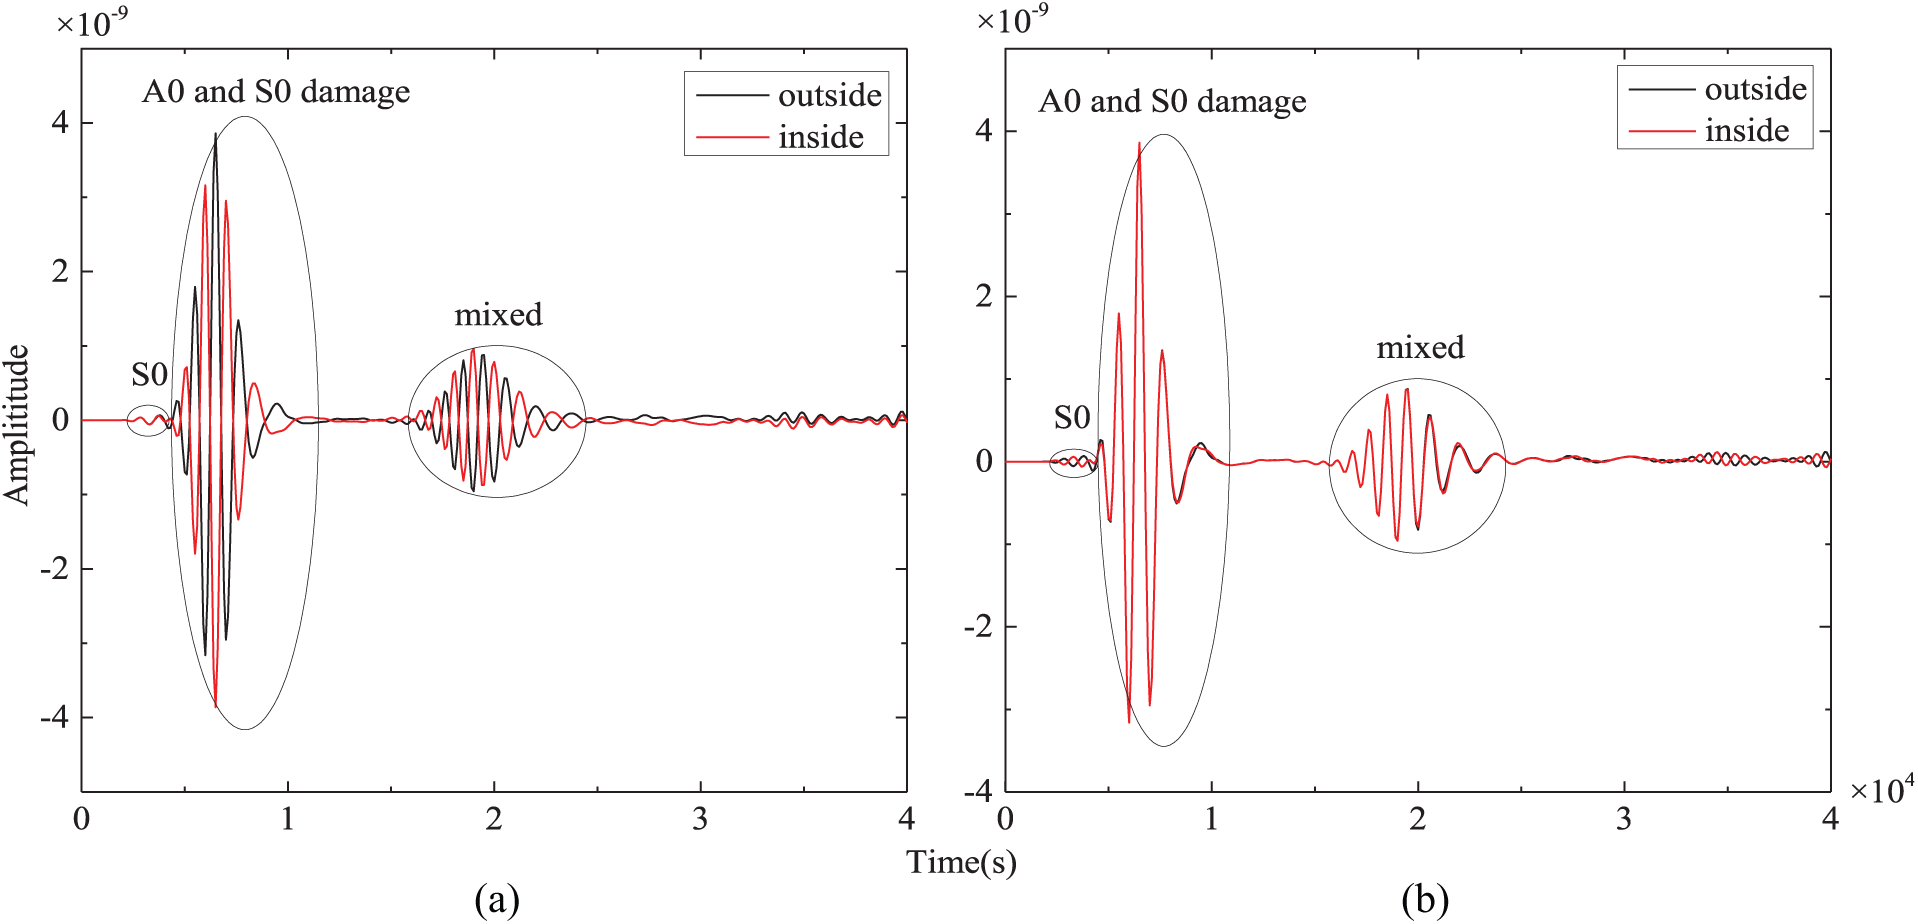
Received signal: (a) symmetric excitation and (b) anti-symmetric excitation.
Figure 11 indicates that when applying symmetric excitation the S0 mode is essentially the same, whereas the A0 mode is symmetrical about the X-axis for the load in the same directions. However, when applying the anti-symmetric excitation, the A0 mode is essentially the same, where the S0 mode is symmetric about the X-axis. From this, the symmetric excitation can eliminate the A0 mode and determine the single S0 mode signal, and the anti-symmetric excitation can eliminate the S0 mode and determine the single A0 mode signal. From the amplitude of the wave packets, it is seen that the A0 mode is more prominent than the S0 mode, and the A0 wave packet has a larger energy. At the same time, the wave packets of damage reflection are mixed together in the symmetric excitation, and the A0 damage wave packet and the wave packet that reflects from the plate edge are mixed together when the anti-symmetric excitation is applied. Thus, the significance of normalizing Lamb wave modes can simplify the wave packet and cause the damage wave packet to be more readily identified.
The symmetrical excitation is applied, respectively, to the arbitrary set of PZTs, and the vertical displacement changes with time over the sensor central point as the signal is received by the rest of the eight PZT sensors. Each sensor can receive eight groups of crack damage signals and 72 groups of signals can be obtained in total. Taking PZT9 and PZT9′ as a group of symmetric excitations and the signal received at PZT6 as an example, the intact model and damage model signals are shown in Figure 12. The damage wave packet can be directly identified. The TOF is obtained from the damage signal, and the crack damage identification is performed using the TOF.
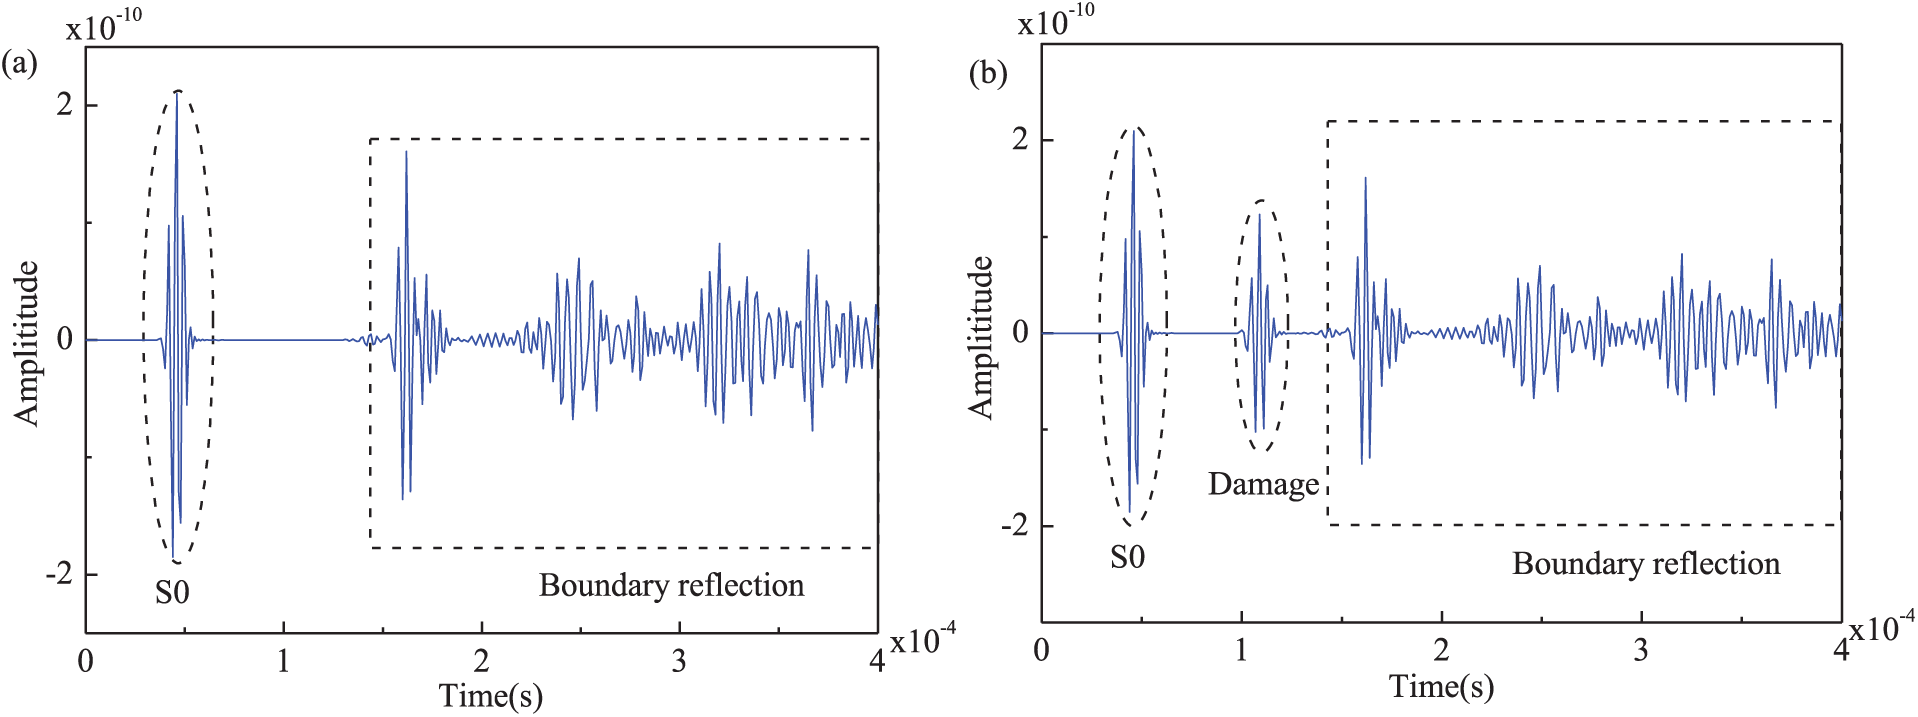
Received signal: (a) entire model and (b) damaged model.
Figure 13 shows the propagation characteristics of the Lamb waves and the signal propagation of the Lamb wave modes as the time changes. As shown in Figure 13, the Lamb wave propagates along the plate and varies with time. At first, the signal propagates out with the excitation point as the center, forming a circular wave that spreads to all sides, and reflects when it encounters the damaged area. Thus, the circular wave becomes elliptical, and then the signal propagates to the edge of the plate. Later, the signal propagating through the weld to the other plate also conforms to this rule, but the signal received on the other side is greatly attenuated.

Lamb wave propagating features at different times: (a) 2.5 × 10⁻⁵ s, (b) 5.0 × 10⁻⁵ s, (c) 7.5 × 10⁻⁵ s, (d) 1.0 × 10⁻⁴ s, (e) 1.25 × 10⁻⁴ s, (f) 1.5 × 10⁻⁴ s, (g) 1.75 × 10⁻⁴ s, and (h) 2.0 × 10⁻⁴ s.
At the same time, in order to compare the energy change between signals, the energies of the damage wave packets received from the other eight points with the symmetric excitation of PZT1 and PZT1′ are compared. The energy of the wave packet is characterized by the amplitude integral in the time domain. The specific energy is shown in Figure 14.

Energy associated with the damage wave.
As shown in Figure 14, the damage wave packet energy for PZT2–PZT5 received along the Y-direction decreases as the distance from the crack damage position decreases. The damage wave packet energies for PZT6 and PZT9 as well as PZT7 and PZT8 are approximately equal, since PZT6 and PZT9 as well as PZT7 and PZT8 are symmetric to the crack damage. It is also seen that the attenuation of the damage wave packet energy is faster along the Y-axis because the crack damage is greater along the Y-direction.
To demonstrate the influence of the increase of the weld element on the damage monitoring, the same model was simulated without the crack element. The signal received at PZT8 from PZT1 and PZT10 symmetrically is used as an example to compare the received signal from the weld element, as shown in Figure 15. An increase in the weld unit reduces the amplitude of the signal, multiple reflections occur at the weld element, and the amplitude of the reflected zone signal increases.

Comparison between signals with and without the weld element.
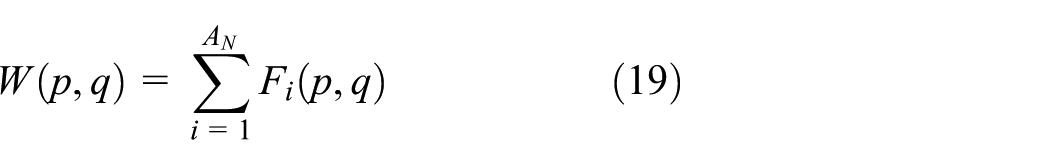
The basic principle of the simulated damage imaging method for locating damage lies in the relatively large amplitude in the discrete elements. The entire plate structure is divided into discrete units, with each unit corresponding to one pixel and the damage location being identified by the number of pixels. When the number of sensors is N, AN = N(N – 1) signals can be obtained. The coordinates of the elliptic discrete points can be expressed as

Each elliptic point position corresponds to a matrix
Amplitude total addition
By adding all of the signal amplitudes, the damage position can be obtained. This method is simple, effective, and efficient
Amplitude total multiplication
The amplitude of the signal is multiplied to increase the amplitude of the damage point, improve the contrast of the image, and make the location of the damage more distinct

Amplitude plus multiplication method
This method combines the advantages of the above two methods, but the amount of data calculation is large and the calculation speed is slow.
Because the 72 groups of data can be recorded, the data are sufficient and can be simulated by amplitude total addition, whereas the amount of data from the total multiplication and the magnitude and multiplication is larger. Therefore, the total amplitude addition method is used to simulate the damage location of the crack in this study.
According to the obtained TOF data and amplitude total addition, the simulated imaging using MATLAB can be used to obtain the damage simulation results, as shown in Figure 16. The figure shows that the simulation results are in good agreement with the actual damage location. From these results, it can be concluded that although the weld leads to more complex waveform reflections and amplitude increases, the ellipse location simulation damage method can also be used to simulate crack damage in welded steel plates.
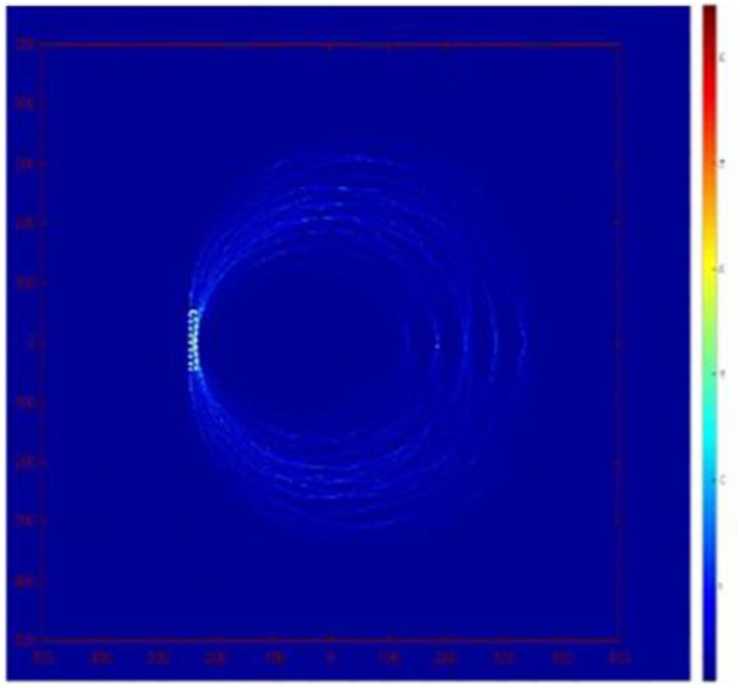
Damage imaging.
Analysis of the experimental results
In the experiment, the piezoelectric ceramic strain gauges are symmetrically bonded. According to the propagation characteristics of Lamb waves, the received signals with only S0 modes should be obtained theoretically. Therefore, to analyze the difference in the received signals between the symmetric and single-side excitations, the single excitation at PZT9 and PZT9′ and the symmetrical excitation at PZT9 and PZT9′ have been compared. The received signals at PZT5 are shown in Figure 17.
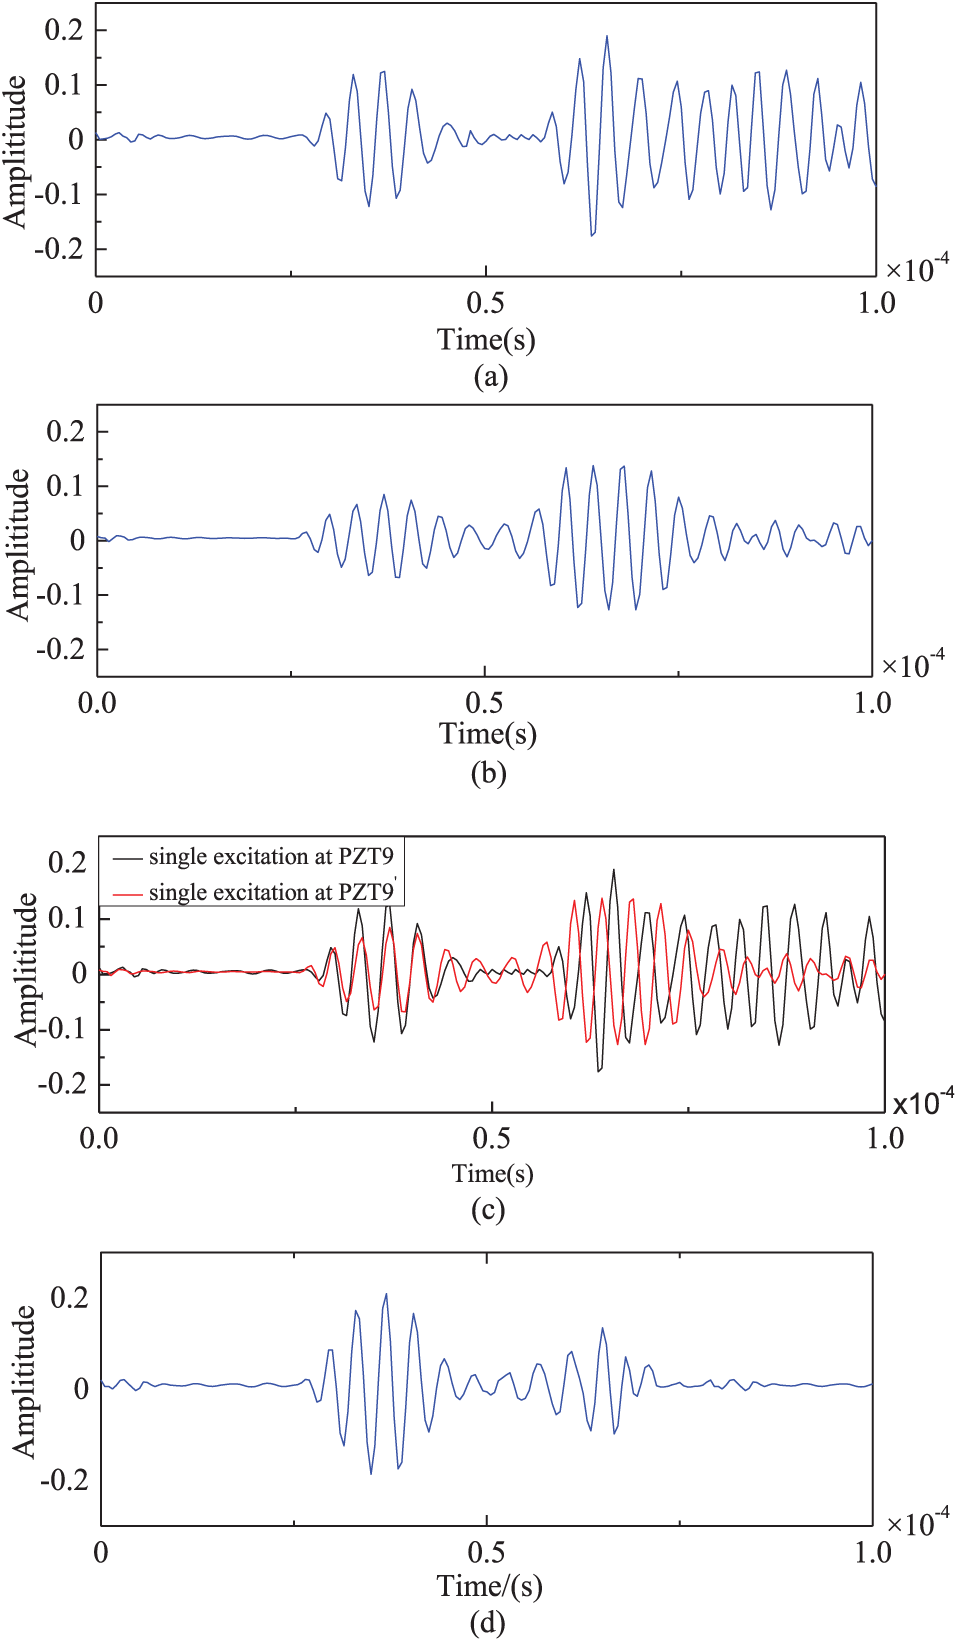
Received signal: (a) single excitation in PZT9, (b) single excitation in PZT9′, (c) comparison of (a) and (b), and (d) symmetrical excitation.
From the comparison of the two received signals in Figure 17(c), the S0 modes of the signals with symmetrical excitation are largely the same, and the A0 mode is approximately symmetric. The results are in good agreement with the numerical simulations. As shown in Figure 17(a) and (d), the second wave packet of the received signal with symmetric excitation is significantly smaller than that with the single-side excitation. This result indicates that the A0 mode in the second wave packet has been partially counteracted, but that the second wave packet can still be observed, indicating that the A0 mode is not completely counteracted. Because glue is used to fix the PZT on the Q235 steel plate as the coupling agent, the amount of glue will affect the coupling. In addition, the steel plate cannot guarantee that the coupling position is completely consistent, and there are also interference of the received waves produced by impurity reflection. Therefore, the A0 mode is not completely counteracted due to the degree of coupling between the glue and the symmetrically arranged positions of the PZT sensors and the impurity of the steel plate.
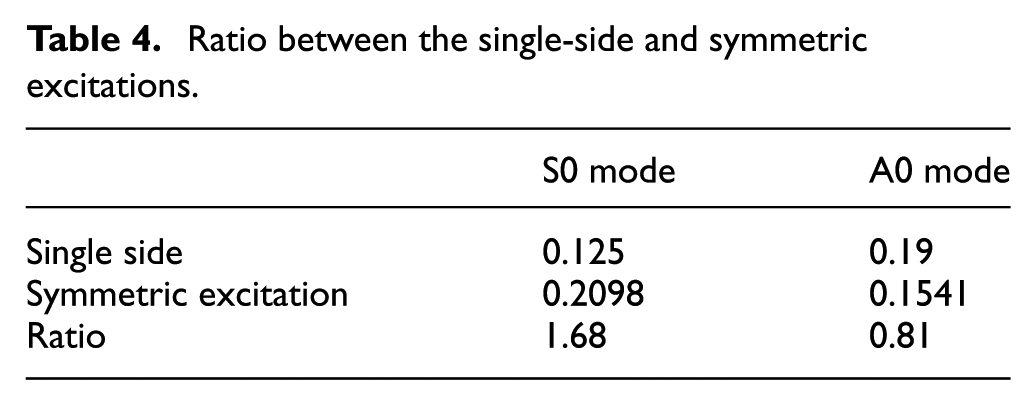
Simultaneously, the ratios between the S0 and A0 modes of the symmetrical excitation and the single-side excitation are compared, as shown in Table 4. The symmetrical excitation increases the S0 mode, which is 1.68 times greater than single-side excitation. Although the A0 mode is not completely counteracted, it decreases 0.8 times the original value. Thus, symmetrical excitation can make the received signal of S0 increase and A0 decrease and plays an important role in the single modal analysis of S0. Later, the experimental research in this article evaluates symmetrical excitation with single S0 mode signal damage analysis.
Ratio between the single-side and symmetric excitations.
The SHM system based on active AE is a comparison between a reference signal and a damage signal to extract damage information and locate the damage. Therefore, the reference signal and the received signal of the damaged specimen need to be recorded. The two received signals are subtracted to obtain the difference signal and are then analyzed. The damage location is simulated based on the ellipse localization method and the data fusion method. The 72 sets of data are collated and analyzed, the damage simulation is made by amplitude total addition, and the results are shown in Figure 18.

Damage simulation.
Comparing the damage detection results, it is found that the multigroup data can not only describe the damage shape but also validate their own data and eliminate the error data to obtain the real damage position. The center of the crack’s simulation is better because the patch connection is perpendicular to the crack.
Conclusion
In this article, the propagation of Lamb waves in symmetric excitation, a method for crack location and identification, is studied in welded steel plates. Simulation and experimental results of the monitoring technique for symmetric excitation of Lamb waves are obtained. The following conclusions can be drawn:
In the simulation, the single-mode Lamb wave damage monitoring system is validated. This system simplifies the received signal and reduces difficulty during data processing. At the same time, the single S0 mode and single A0 mode signals are compared.
The ABAQUS/EXPLICIT simulation of the welding model is used to monitor the crack damage by the ellipse location method. Although the wave reflection is more complex, it can still simulate the location of the damage that is far from the welded boundary.
The variation in wave packet energy is analyzed by comparing the damage wave packet energy at different points of the received signal. At the same time, the energy change of the damage wave packet with or without welding elements is compared. It is concluded that increasing the weld unit reduces the energy of the received signal.
Combining theoretical research with experimental data, it is further demonstrated that the symmetrical excitation method can simplify the received signal. At the same time, the signal and amplitude of single-side excitation and symmetrical excitation are compared.
Simulation and experimental data were obtained, and then a damage simulation is made according to the ellipse location method and the amplitude total addition method. The simulation results agree with the experimental results. The feasibility and accuracy of the method employing Lamb wave monitoring with symmetrical excitation to identify damage in welded steel plates are demonstrated.
Footnotes
Handling Editor: Yun Lai Zhou
Declaration of conflicting interests
The author(s) declared no potential conflicts of interest with respect to the research, authorship, and/or publication of this article.
Funding
The author(s) disclosed receipt of the following financial support for the research, authorship, and/or publication of this article: This work was supported by the National Natural Science Foundation of China (51108113) and the Natural Science Foundation of Heilongjiang Province of China (QC2016057).