
Abstract
After long time operation of the manufactured gas pipeline, the naphthalene in the gas will jam the pipeline and threaten the safety of the pipeline seriously. To study the naphthalene particle deposition law in the manufactured gas pipeline, a horizontal straight pipe of Kunming manufactured gas pipeline is taken as an example; based on Reynolds stress model and discrete phase model, ANSYS Fluent software is used to carry out the numerical simulation in different pipe diameters, particle size, inlet velocity, temperature, and pressure conditions. The main conclusion can be obtained as follows (1) in the horizontal straight pipe section, particle diameter and temperature are positively correlated with the deposition rate and the deposition velocity of naphthalene particle and the inlet velocity and pressure are negatively correlated with them; (2) the naphthalene particle deposition rate is mainly affected by the particle size and the inlet velocity; (3) the larger the pipeline diameters, the greater the particle mass flow rate under the same particle inlet concentration, the lower the carrying capacity of the fluid to particles, the greater the naphthalene particle deposition rate; (4) the naphthalene particle deposition can be suppressed by increasing the gas transmission velocity and pressure and reducing the temperature, thus ensuring the safe operation of manufactured gas pipeline.
Keywords
Introduction
Historically, manufactured gas (MG) has been used as the main gas source in most urban gas transmission and distribution systems. The naphthalene content of MG is relatively high in the pipeline. With the increase in pipeline operating years, the amount of naphthalene deposition has also increased, resulting in a decrease in the effective flow area of the pipeline and increase in the likelihood of blockage in the pipeline. The pipeline is the main facility for natural gas transportation, and its operation safety is important, especially in densely populated cities. 1 At present, the main source of urban gas is long-distance pipeline gas. Liquified natural gas (LNG) peaking shaving method will be used when there is insufficient gas supply. Therefore, natural gas has become the mainstream of urban gas. 2 MGP has been replaced by natural gas pipeline (NGP) in most cities. In this process, a large number of pipelines have to be renovated because of the serious blockage of naphthalene. However, there are many pipelines in the city gas pipeline network. It is still difficult to determine which pipeline is seriously clogged and when the pipeline is cleaned or replaced. The understanding of the deposition of naphthalene particles is the key to judge the deposition location of naphthalene particles in the pipeline, and to replace the blockage of serious pipelines accurately. Therefore, this study on the deposition of naphthalene particle in MGP is of great significance in ensuring the safe operation of gas transmission and distribution system.
The deposition of solid particles in the pipe can be analyzed by experimental and numerical simulation methods. In 1957, an experimental study pointed out that the amount of particle deposition increases with the increase in the air flow rate and the dust particle size. 3 Sehmel 4 and Liu and Agarwal 5 found that solid particles could be deposited on any surface of the pipeline, and the deposition amount of particles on the top of the pipeline will be increased with the increase in particle diameter. According to the deposition of particles in different areas in the experiment, Wood 6 and Papavergos and Hedley 7 determined the zone of particle deposition can be divided into three parts: diffusion zone, diffusion collision zone, and inertia buffer zone; they also analyzed the main reasons for particle deposition in different regions. In 1993, the effects of particle diameter and velocity on the particles deposition on the wall surface were experimentally analyzed, 8 its disadvantages are that the period of the experiment is too long and it is vulnerable to experimental conditions and testing techniques. With the rapid development of computer technology, numerical simulation based on computational fluid dynamics (CFD) has been widely used in the research of particle deposition in pipelines. The deposition laws of particles in the smooth channel were obtained through numerical simulation by Li and colleagues.9–11 In 1997, Chen and Ahmadi 12 analyzed the deposition law of the particles in the vertical tube was simulated and analyzed the influence of the flow direction on the deposition of the particles. The turbulent flow of gas–solid two phases in vertical pipe was calculated by numerical simulation, but the velocity component of solid particles along the direction perpendicular to the flow direction was ignored. The turbulent Reynolds stress model (RSM) combined with the particle Lagrange orbit model was used to study the deposition characteristics of the micro-particle on the wall, and the effect of flow mode and flow velocity on the deposition rate of particles was examined. 13 In 2012, the particle deposition in different pipelines under different turbulent models and wall conditions were simulated. And by comparing the calculation results with experimental data, the results showed that the RSM in predicting particle deposition is better than other models. 14 Therefore, based on the literature review, the numerical simulation of the deposition of solid particles in the pipeline is mainly focused on the pneumatic conveying system and the small diameter pipeline; the research on the deposition of naphthalene particles in the pipeline is much less.
For the problem of naphthalene particle deposition in MGP, if experimental methods are used, the inclusion of naphthalene blockages in the pipeline must be removed, which will affect not only the normal operation of the transmission and distribution system but also the tiny leakage phenomenon which has not been discovered due to the accumulation of the previous plugging will occur, affecting the safe operation of the pipeline. Scholars established a mathematical model of the naphthalene plugging in gas pipeline to determine the position of the naphthalene plugging, but they have not analyzed the causes of naphthalene deposition in the pipeline from the perspective of fluid dynamics.15–18 Therefore, they cannot explain the deposition behavior of naphthalene particles and the influence of the deposition of naphthalene particles with different pipe diameters, inlet velocity, particle size, temperature, pressure, and so on.
Thus, this article takes the horizontal straight pipe of an MGP as an example; the discrete phase model (DPM) and RSM are used for numerical simulation of naphthalene particle deposition in the pipeline. In addition, the naphthalene particle deposition laws in horizontal straight pipe and the influence of the different factors (such as pipeline diameter, particle diameter, inlet speed, temperature, and pressure) on the deposition of naphthalene particles in straight pipe are predicted and analyzed.
Basic theory
Physical properties of naphthalene
Naphthalene (C10H8) is a solid at normal temperature and has a melting point of 80°C, and its appearance is flaky or powdery crystals. 19 After naphthalene is crystallized, it is mainly deposited in sheet form inside the gas pipeline. Naphthalene is volatile, and its vapor can also saturate coal gas even at low temperatures. As the temperature rises, the amount of naphthalene vapor which makes the gas saturated is also increased. Under different temperatures and pressures, the saturated vapor content of naphthalene is mainly determined by the gas temperature (naphthalene dew point temperature). 20 The formula for calculating the saturated vapor content of naphthalene is as follows

where Ct is the saturated naphthalene vapor content in the gas under certain conditions, g/100 N m
3
;
Numerical simulation method for gas-solid two-phase flow
The flow of naphthalene particles in the pipeline after precipitation is a gas–solid two-phase flow. At present, there are two numerical simulation methods commonly used for gas–solid two-phase flow: Euler–Euler method and Euler–Lagrange method. 21 The Euler–Euler method treats both gas and solid phases as continuous-phase media, also known as the “two-fluid model,” commonly used for dense gas–solid two-phase flow. The Euler–Lagrange method treats the gas phase as a continuous phase, while the solid phase as a discrete phase, usually used for flows with a discrete phase volume fraction of less than 10%–12%. Considering that the volume fraction of naphthalene particles is low, the DPM based on Euler–Lagrange method in ANSYS Fluent software is used to simulate the naphthalene particle deposition in MG transmission and distribution pipelines.
Continuous-phase control equation
The turbulence models provided by the Fluent software are as follows: standard k-ε model, the Spalart–Allmaras model, the RNG k-ε model, the realizable k-ε model and the RSM.21–23 Combined with the actual flow of MG in the transmission and distribution pipeline, RSM turbulence model which describes the particle deposition in the pipeline is chosen as the gas turbulence model. The continuous-phase control equation is as follows:
Fundamental equations

where
2.RSM model transport equation

where
Discrete phase control equation
In the Fluent software, the differential equation of the particle force in the integral pull coordinate system is used to solve the moving orbit of the dispersed phase particles. The balance equation of the particle force in the x direction in the Cartesian coordinate system is taken as an example

where

where u is the gas velocity, m/s;

Particle deposition rate
The particle deposition rate refers to the percentage of particles deposited on the pipe wall to the particles entering the pipe in unit time. Its expression is as follows

where
Model establishment and boundary conditions
Case study
The study selects Kunming MG distribution pipelines in as the research object, and the MG component parameters are shown in Table 1. 24
The manufactured gas component.

Meanwhile, according to the physical properties of naphthalene and the specific data of MG transmission and distribution pipeline, the deposition of naphthalene particles inside the pipeline under different pipeline diameters, inlet velocity, particle size, temperature, and pressure is analyzed. The specific scheme is shown in Table 2.
Numerical simulation scheme.

Geometric model and mesh division
According to the numerical simulation scheme in Table 2, a horizontal straight pipeline geometry model with the length of L = 15D is established to accurately analyze the flow field and particle motion. The positive direction of z-axis is taken as the flow direction, and the negative direction of y-axis is taken as the gravity direction. The inlet surface is set as the source surface, and Sweep (the scanning method) is used for the whole fluid field division mesh. For areas near the pipe wall, standard wall functions are used to divide the boundary layer mesh to ensure that the wall area satisfies the conditions: 11.5 – 30 < y+ <200 – 400 (y+ represents the dimensionless distance from the centroid to the wall of the first layer mesh). After mesh-independence verification, the mesh node numbers of the horizontal straight pipes with D=200 mm, 300 mm, 400 mm, 500 mm, are divided into 51,256, 140,175, 255,248, and 408,408, respectively.
Taking the horizontal straight pipeline with D = 200 mm as an example, the geometric model and mesh division are shown in Figures 1 and 2.

Geometric model of horizontal straight pipeline.

Mesh division.
Boundary conditions
Inlet Boundary
The inlet boundary condition is set as the velocity inlet. The inlet flow velocity is 0.85 m/s and assumed to follow a uniform distribution. And the inlet flow velocity of pipeline is set according to the numerical simulation scheme. The empirical formulas (9) and (10) are used to calculate the turbulence intensity and hydraulic diameter


where I is the turbulence intensity; Re is the Reynolds number;
For the discrete phase, a surface source is set at the pipeline inlet. The new particle type is set as naphthalene particles with a density of 1162 kg/m3.The particle velocity is consistent with the gas inlet velocity. The particle at the inlet of the pipeline is set to escape. The concentration of naphthalene particles at the inlet of the pipeline is 92.14 mg/m3, 24 and the corresponding inlet particle mass flow is shown in Table 3.
The setting of inlet particles mass flow.

Outlet Boundary
The outlet boundary condition is set as the outflow boundary condition. The particle at the outlet of the pipeline is set to escape.
Wall
The wall surface is set to no-slip wall surface. For the discrete phase, the particles at the pipeline wall are set to trap, that is, the particles are caught on the wall while the particle trajectory is no longer calculated.
Numerical simulation results and discussions
Flow field analysis
Figure 3 shows the pressure nephogram at y = 0 cross section of the horizontal straight pipeline and the velocity nephogram at the center section of the straight pipeline under inlet velocity of 8 m/s. From Figure 3(a), it can be seen that the pressure decreases evenly along the direction of gas flow without large pressure gradients. From Figure 3(b), the velocity of the gas flow is biggest at the center of the pipeline after the fluid enters the pipe. The fluid velocity at the boundary layer decreases due to the influence of the fluid viscosity and the boundary layer, and the closer to the wall, the faster the gradient decreases.
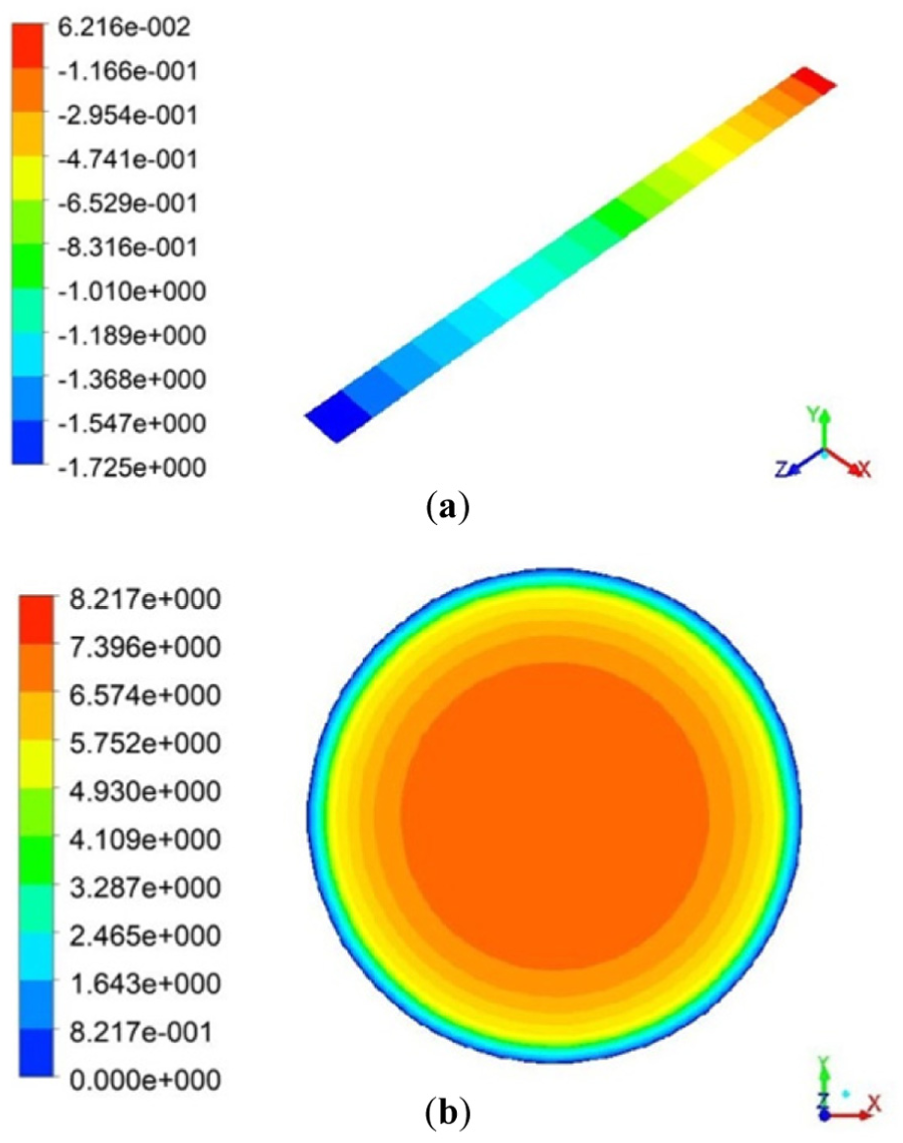
The distribution nephogram of pressure and velocity when the pipeline inlet velocity is 8 m/s: (a) the pressure nephogram at y = 0 cross section and (b) the velocity nephogram at the center section.
Naphthalene particle deposition analysis
Particle size
In order to study the influence of particle size on the naphthalene particle deposition in horizontal straight pipeline, the inlet velocity was kept at 8 m/s, the temperature was at 20°C, and the pressure was at 20 kPa. The numerical simulations of naphthalene particles with different particle size are made under different pipeline diameters. Taking the horizontal pipeline with the diameter of 200 mm as an example, we have shown the mass concentration nephogram of naphthalene particles on the y = 0 cross section in Figure 4. The variation of deposition rate with the particle size under different pipeline diameters is shown in Figure 5.

The mass concentration nephogram of naphthalene particles under different particle sizes when the inlet velocity is 8 m/s.

The variation curve of the particles deposition rate with particle size under different pipeline diameters.
From Figures 4 and 5, with the increase in the particles size, the deposition of naphthalene particles in the horizontal straight pipe is gradually increased by the influence of gravity, and the number of naphthalene particles deposited in the pipeline increases, that is, the deposition rate increases. The larger the pipeline diameters, the greater the mass flow rate of particles with the same inlet concentration, and the greater the number of naphthalene particles deposited at the same particle size, the greater the deposition rate.
Inlet velocity
In order to study the influence of inlet velocity on the naphthalene particles deposition in horizontal straight pipeline, the particle size was kept at 100 μm, the temperature was at 20°C, and the pressure was 20 kPa. The numerical simulations of naphthalene particles with different inlet velocity are made under different pipeline diameters. Taking the horizontal pipeline with the diameter of 200 mm as an example, when the inlet velocity is 7 and 10 m/s, we have shown the mass concentration nephogram of naphthalene particles on the x = 0 cross section in Figure 6. The variation of deposition rate with the inlet velocity under different pipeline diameters is shown in Figure 7.

The mass concentration nephogram of naphthalene particles on the x = 0 cross section when the inlet velocity is 7 and 10 m/s: (a) u = 7 m/s and (b) u = 10 m/s.

The variation curve of the particles deposition rate with inlet velocity under different pipeline diameters.
From Figure 6, when the inlet velocity is 10 m/s, the naphthalene particles are more likely to move forward with the gas flow and are less likely to deposit in the straight pipe. From Figure 7, with the increase in the inlet velocity, the greater the scouring action of the fluid, the more easily the naphthalene particles flow along with the gas flow in the pipeline, and the deposition rate gradually decreases. The larger the diameter of the pipeline, the greater the mass flow of the particles at the same inlet concentration, the lower the carrying capacity of the fluid to the particles, and the greater the deposition rate of the naphthalene particles corresponding to the same velocity.
Temperature
In order to study the influence of temperature on the naphthalene particle deposition in horizontal straight pipeline, the particle size was kept at 100 μm, the inlet velocity was at 8 m/s, and the pressure was at 20 kPa. The numerical simulations of naphthalene particles with different temperatures are made under different pipeline diameters. Taking the horizontal pipeline with the diameter of 200 mm as an example, when the temperature is at 5 and 15°C, the mass concentration nephogram of naphthalene particles on the outlet cross section is shown in Figure 8. The variation of deposition rate with the temperature under different pipeline diameters is shown in Figure 9.

The mass concentration nephogram of naphthalene particles on the outlet cross section when the temperature is at 5 and 15°C: (a) t=5°C and (b) t=15°C.
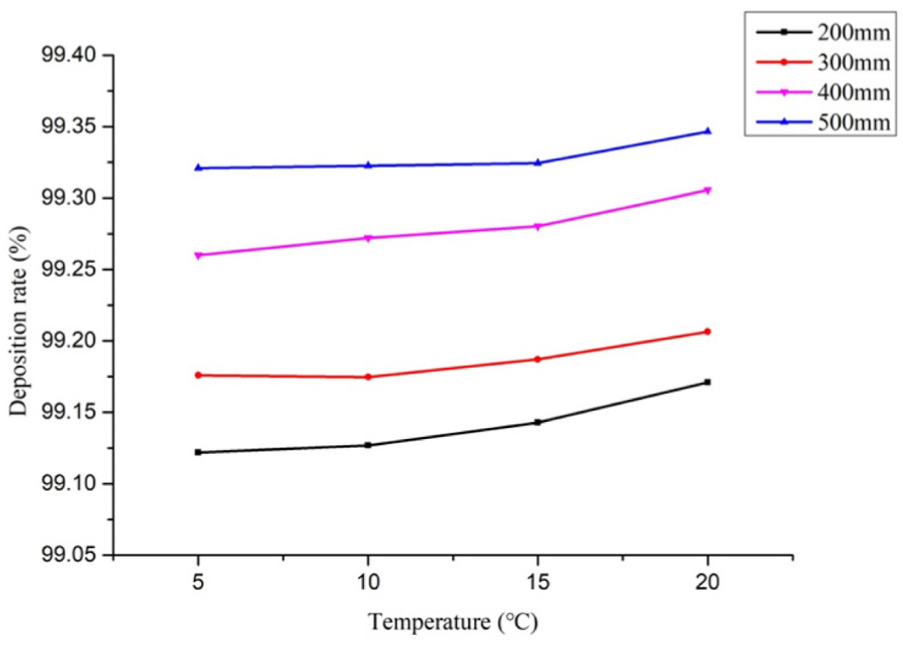
The variation curve of the particle deposition rate with temperature under different pipeline diameters.
From Figure 8, when the temperature is at 5°C, the naphthalene particle concentration at the outlet surface is higher, and more naphthalene particles flow out from the pipeline while naphthalene particles deposited in the pipeline are less. From Figure 9, with the increase in the temperature, the density of the gas decreases and the viscosity of the gas increases. The decrease in density will increase the deposition rate of naphthalene particles, and the increase in viscosity will reduce the deposition rate. Because of their different changing trends, the deposition rate of naphthalene particles finally increases with the increasing temperature. The larger the diameter of the pipeline, the greater the mass flow rate of incident particles at the same particle inlet concentration, the lower the carrying capacity of the fluid on the particles at the same temperature, and the greater the deposition rate of naphthalene particles.
Pressure
In order to study the influence of pressure on the naphthalene particle deposition in horizontal straight pipeline, the particle size was kept at 100 μm, the inlet velocity was at 8 m/s, and the temperature was at 20°C. The numerical simulations of naphthalene particles with different pressures are made under different pipeline diameters. Taking the horizontal pipeline with the diameter of 200 mm as an example, when the pressure is at 20 and 50 kPa, we have shown the mass concentration nephogram of naphthalene particles on the outlet cross section in Figure 10. The variation of deposition rate with the pressure under different pipeline diameters is shown in Figure 11.

The mass concentration nephogram of naphthalene particles on the outlet cross section when the pressure is at 20 and 50 kpa: (a) p=20 kPa and (b) p=50 kPa.

The variation curve of the particles deposition rate with pressure under different pipeline diameters.
From Figure 10, when the pressure is 50 kPa, the concentration of naphthalene particles at the outlet surface are higher, the naphthalene particles flowing out of the pipeline are more, while the naphthalene particles deposited in the pipeline are less. From Figure 11, the deposition rate of naphthalene particles decreases with the increase in gas pressure. When the pressure rises, the viscosity of the gas flow increases accordingly so that the buoyant force and drag force of naphthalene particles increase, and the gas carrying the ability of particles to move in straight pipelines increases. And in this situation, naphthalene particles are not prone to deposition, and the deposition rate decreases. The larger the pipeline diameters, the greater the mass flow rate of the particles at the same particle inlet concentration, the lower the fluid carrying capacity of the particles under the same pressure while the greater the deposition rate of naphthalene particles.
Conclusion
In this article, the DPM model and RSM turbulence model were used to simulate the naphthalene particles deposition in horizontal straight pipe. The influence of inlet velocity, particle size, temperature, and pressure under different pipeline diameters on naphthalene particle deposition was analyzed. And the main conclusions are as follows:
In the horizontal straight pipe of MG transmission and distribution pipeline, the naphthalene particles diameter and temperature are positively correlated with the deposition rate and the deposition velocity of naphthalene particles, while the inlet velocity and pressure are negatively correlated with the deposition rate and the deposition velocity of naphthalene particles.
The deposition rate of naphthalene particles in horizontal straight pipe is mainly affected by particle size and inlet velocity, and the influence of temperature and pressure is relatively small.
The larger the pipeline diameters, the greater the mass flow rate of the particles with the same particle inlet concentration, the lower the carrying capacity of the particles on the fluid while the greater the deposition rate of the naphthalene particles
Combined with the numerical simulation results, in the horizontal straight pipeline of MG transmission and distribution pipeline, the deposition rate of naphthalene particles can be reduced by appropriately increasing the gas conveying speed and pressure, and lowering the temperature, to suppress the occurrence of naphthalene particle deposition.
Based on the numerical simulation results of the horizontal straight pipe, the other local components, such as valves, three pipe, and horizontal elbow, where the naphthalene particles are more easily deposited, can be further carry out the numerical simulation. And in this way, the deposition position of naphthalene particles before and after the gas network replacement will be analyzed, and the serious plugging pipeline will be updated in order to ensure the safe and effective operation of the distribution network before and after replacement.
Footnotes
Appendix 1
Handling Editor: Hongfang Lu
Declaration of conflicting interests
The author(s) declared no potential conflicts of interest with respect to the research, authorship, and/or publication of this article.
Funding
The author(s) received no financial support for the research, authorship, and/or publication of this article.