
Abstract
To further improve prediction accuracy and optimization quality of wire electrical discharge machining of SiCp/Al composite, trim cuts were performed using Taguchi experiment method to investigate the influence of cutting parameters, such as pulse duration (Ton), pulse interval (Toff), water pressure (Wp), and wire tension (Wt)), on material removal rate and three-dimensional surface characteristics (Sq and Sa). An optimization model to predict material removal rate and surface quality was developed using a novel hybrid Gaussian process regression and wolf pack algorithm approach based on experiment results. Compared with linear regression model and back propagation neural network, the availability of Gaussian process regression is confirmed by experimental data. Results show that the worst average predictive error of five independent tests for material removal rate, Sq, and Sa are not more than 10.66%, 19.85%, and 22.4%, respectively. The proposed method in this article is an effective method to optimize the process parameters for guiding the actual wire electrical discharge machining process.
Keywords
Introduction
SiCp/Al composite is a metal matrix composite (MMC) consisting of aluminum matrix and silicon carbide particles. Due to its excellent characteristic, such as high strength, low density, thermal stability, and good wear resistance, it is widely used in aircraft components, space systems, and high-end equipment. However, its reinforcement particles make it hard to be machined in traditional ways, which can cause high tool wear.1,2 The poor machinability limits its further application, so an economical machining method with a high performance is in great need.
Wire electric discharge machining (WEDM) is one of the most popular non-traditional machining methods. 3 It is a thermal machining process for machining accurate parts with various hardness or complex shapes. During the WEDM process, continuous sparks between the wire and the material heat the surface of the material over 10,000°C, along with the phenomenon of melting and vaporization. Besides, the electric parameters, such as pulse on time and pulse off time, can be set in a rather wide range. These characteristics of WEDM assure the machining efficiency and accuracy of hard materials. The matrix of SiCp/Al is aluminum, whose melting point is as low as 660°C; thus, it is easy to be eroded by heat. The remaining reinforcement particle is flushed away by the dielectric. Besides, SiCp/Al is often utilized in the high-end fields, which requires a better performance. Thus, WEDM is an idle method for machining SiCp/Al.3,4
Rao and Krishna 4 made an investigation into the machinability of SiCp reinforced matrix composite during WEDM. Surface roughness, material removal rate (MRR), and wire wear ratio are taken as the criteria of the WEDM performance indicators. He utilized the non-dominated sorting genetic algorithm II (NSGA-II) to obtain the best combination of input parameters including pulse duration, pulse interval, and wire tension. Jangra 5 investigated the multi-pass cutting operation (single rough cut followed by multi trim cuts) in WEDM of WC5.3%Co composite. An experiment based on Taguchi method was performed to evaluate the influence of rough cut history, discharge current, pulse duration, wire offset and number of trim cuts on the depth of material removed and surface roughness in favor of helping to select the accurate wire offset and discharge parameters for rough and trims cutting operations for WEDM of new and exotic materials.
Although WEDM has a unique advantage of machining MMC, there is little report on it. 6 As EDM and WEDM share the same erosion mechanism, some of the methodology successfully applied in EDM can be introduced into the WEDM study. Hourmand et al. 7 studied the Al-Mg2Si composite and designed the experiment using response surface methodology (RSM) to analyze EDM performance of this composite material. The study revealed the effect of input variables (voltage, current, pulse duration, and duty factor) on MRR, electrode wear ratio, and microstructure changes.
The combination of process parameters, such as pulse duration, pulse interval, and current has a complex nonlinear relationship with the performance, especially when multi-responses are taken into consideration. Thus, intelligent algorithms have been an efficient tool to optimize the parameters. Singh and colleagues8,9 utilized Taguchi technique and RSM for machining of AISI D2 steel and investigated the effects of various WEDM process parameters on the MRR, surface roughness, and cutting rate. Aich and Banerjee 10 developed a model of EDM process using the support vector machine (SVM), which was one of the supervised principal methods. Altug et al. 11 and Varun and Venkaiah 12 took advantage of the ability to solve the maximum problems of genetic algorithm (GA) and obtained the best performance in kerf and MRR. Gray system is a useful technique to deal with poor, incomplete, and uncertain data for solving the complicated interrelationships among the multiple responses. Azhiri et al. 13 used gray relationship analysis (GRA) to maximize the cutting velocity and minimize surface roughness. Rao and Krishna, 4 Kumar and Agarwal, 14 and Zhang et al. 15 developed mathematical models to solve the WEDM multiple response problems using the NSGA-II. Previous works16–22 applied RSM to obtain the best combination of WEDM process parameters on different materials. Somashekhar et al. 23 employed simulated annealing (SA) scheme to maximize the MRR, surface roughness, and overcut. Previous works24–28 used artificial neural network (ANN) to develop models describing the relationship between process parameters and performance of WEDM. Previous works29–31 obtained the optimized process parameters combination using linear regression model (LRM).
The above mentioned researchers have evaluated WEDM performance using various algorithms, such as GA, GRA, RSM, ANN, and LRM. Only few of them used the Gaussian process regression (GPR) for evaluating WEDM performance. In 1996, Williams and Rasmussen 32 firstly proposed the GPR for machine learning. Compared with other regression models, such as SVMs, 33 GPR is a probabilistic model based on the standard Bayesian approaches. As a result of its good performance, especially in small sample size and desirable analytical properties, GPR has been applied in the manufacturing community in recent years.34–36
In addition, a recently new heuristic swarm intelligent method, named wolf pack algorithm (WPA), has been proposed to solve the unconstrained global optimization problem. Wu and Zhang 37 carried out simulation experiments to compare WPA with the other five typical intelligent algorithms including GA, particle swarm optimization (PSO), artificial fish swarm (AFS), artificial bee colony (ABC), and firefly algorithm (FA) and demonstrated that WPA had better convergence and robustness, especially for high dimensional functions. In terms of algorithm application, Han et al. 38 applied weighted clustering algorithm (WCA) to high precision time synchronization control of smart grid and achieves good results. Sun et al. 39 integrated differential evolution (DE) algorithm with WPA algorithm and applied it to satellite navigation. Experimental results showed that the algorithm has higher recognition accuracy. Therefore, using a mathematical model and simultaneously evaluating the suitable machining parameters for MRR, Sq and Sa become the goals of the current research by GPR method and WPA.
In this study, the main work highlights a hybrid mathematical model developed to correlate the relationships of process parameters of WEDM. To further improve prediction accuracy and optimization quality of cutting SiCp/Al composite, this research employed a GPR and wolf pack algorithm (GPR-WPA) method, and the final optimization results were confirmed with verification experiments. Meanwhile, the prediction accuracy and stability of GPR-WPA model is compared with that back propagation neural network (BPNN) and LRM in the process optimization while machining SiCp/Al composite. In addition, the purpose of this article is to search optimal process parameters that maximize the overall desirability function for higher MRR and lower Sq and Sa. Compared to the two-dimensional surface parameters (Rq and Ra), the evaluation of three-dimensional (3D) surface parameters (Sq and Sa) is more comprehensive. In the 3D evaluation, due to the continuity of the standard and the long-term usage of the parameters, the parameters of Ra and Rq are extended to Sa and Sq, respectively.
Prediction and optimization methodology
GPR for prediction
MRR and 3D surface characteristics models of WEDM process are independently multiple-input-single-output or a standard case (i.e. vector inputs and scalar outputs).40,41 Assume that D = <X, Y> is a set of training data, where xi = [x1, x2, …, xn] is a matrix containing n-dimensional input examples xi (here n=training sample size). Then, yi = [y1, y2, …, yn] is a vector containing scalar training outputs yi, and there are three independent outputs yi, which are MRR, Sq, and Sa in this study. In engineering views, the output yi could be assumed to contain mean-zero additive Gaussian noise with variance

As the latent function value f(xi) is indexed by the corresponding input xi, fi denotes f(xi) for convenience. A Gaussian process is a collection of random variables, of which any finite number has a joint Gaussian distribution. Based on a GP zero-mean prior over latent functions, it is a Bayesian approach and has covariance given by the covariance matrix K(x, x′) and represented as

where fi = [f1, f2,…, fn]T is a vector of latent function values. After the prior on noisy observations, equation (2) can be rewritten into equation (3). The detailed descriptions are listed in our previous study 35

WPA for optimization
In the light of intelligent optimization methods, the WPA is a family of computational models. There is a well-organized system in wolf society, which has clear division of labor, keeping step with guarantee efficient action, and cooperation to defeat a powerful enemy. The WPA is proposed according to the society of wolf, which is listed as follows:
Step 1: Initialize following parameters, population size of wolves (M), maximum iteration (max t), initial position of artificial wolf xid, maximum number of search direction (maxdh), search step (step a), move step (step b), maximum surrounding step (ramax), minimum surrounding step (ramin), the number of the optimum wolves (q), and the number of wolves randomly generated (p).
Step 2: To obtain leader wolf, the wolf with best function value is considered. One leader wolf is selected from q optimum wolves as candidates t. Then, except for leader wolf, according to equation (4), q wolves firstly act as artificial scout wolves (candidates of lead wolf) to take scouting behavior until the search times is greater than the maximum number of search maxdh. Then, after obtaining the leader of the wolf pack, go to step 3

where
Step 3: Except for the lead wolf, the artificial ferocious wolves are acted by the rest of the wolves. According to equation (4), they gather toward the lead wolf. Then go to step 4.
Step 4: Taking besieging behavior, the position of artificial wolves are updated according to equation (5). In addition, the cross-border of new position of artificial wolves is needed to check by equation (6) and then go to step 5

In equation (5), ra is the surrounding step, zld is the position of the leader wolf, zid is the position of ith wolves of the pack, and the rand is a function obtained a random value in the interval [–1, 1]
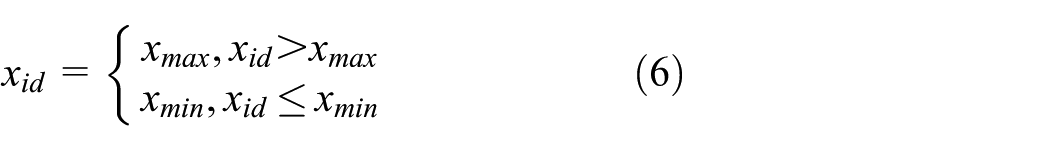
In equation (6), xid is the current position of ith wolves; xmax and xmin are the upper and lower limits of the search space, respectively.
Step 5: Under the food distribution principle of wolf pack, the position of lead wolf is updated. Then, the renewing positions of the p worst wolves in wolf pack are calculated according to equation (7)

Step 6: If the program of WPA reaches maximum number of iterations (max t) or precision requirement, the position and fitness function value of the lead wolf will be obtained, which is the problem optimal solution; otherwise go to step 2.
Mathematical method of WEDM cutting process
An integrated mathematical method is built to forecast and optimize the 3D surface characteristics and MRR through combing GPR with wolf pack algorithm (GPR-WPA) method. Figure 1 is the flowchart which draws a prediction and optimization procedure of the WEDM process parameters.
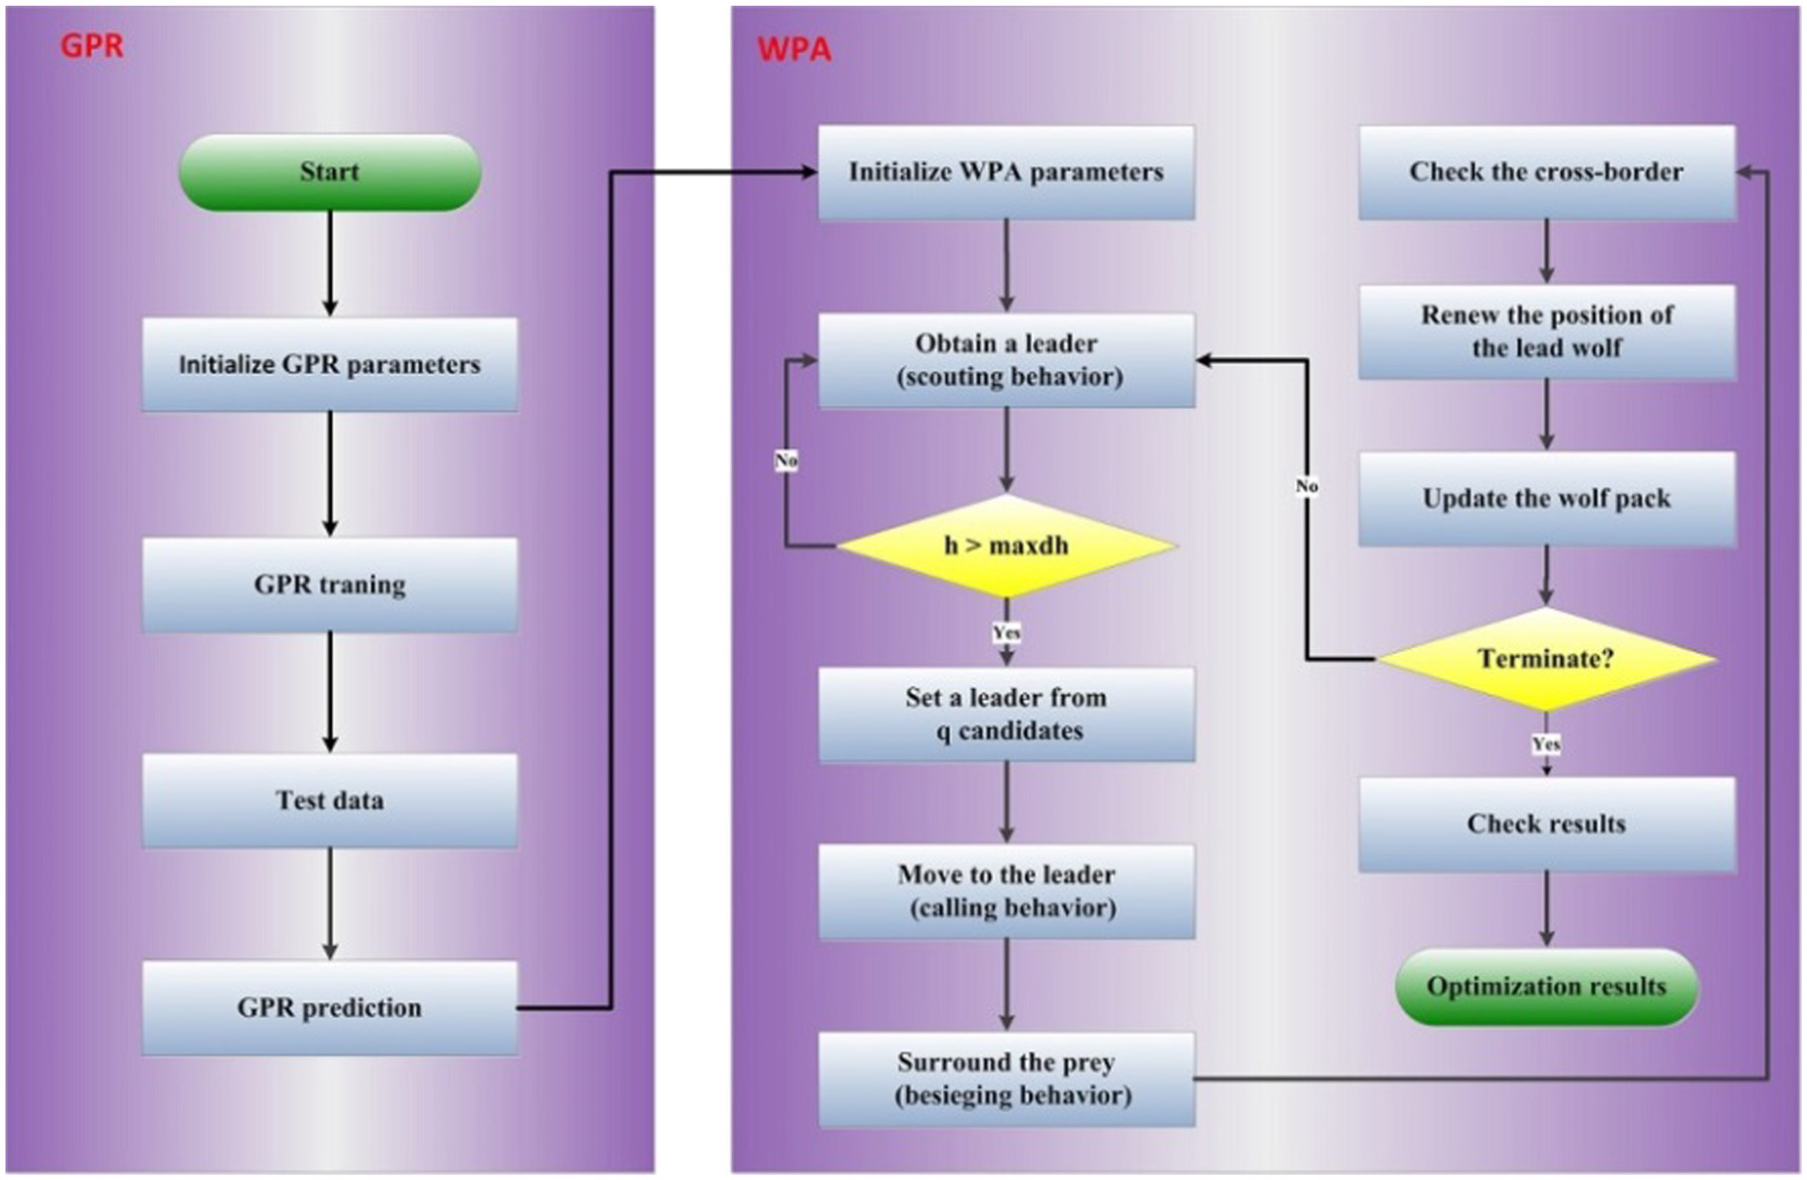
Flow diagram of prediction and optimization.
Preparation
The inputs (pulse duration, pulse interval, water pressure, and wire tension) and outputs (3D surface characteristics and MRR) of the cutting process are selected as objects to research their relationship, and the model of GPR-WPA is constructed. WPA approach is utilized to optimize the final outputs considering the fitness values that are achieved from the prediction procedure using GPR approach.
Prediction
Thirteen experiment samples are utilized to training the GPR model, while the rest five experiment samples are selected as test set to illustrate the validity and reliability of the prediction model and produce the correct fitness values to WPA algorithm.
Optimization
By regarding the prediction values from the GPR as the fitness of WPA, optimal results of the inputs and outputs are got through the procedure of scouting behavior, calling behavior and besieging behavior. Eventually, the optimization results would be obtained with the verification experiments.
Experimental setup and results
Materials and specimens
The workpiece was SiCp/Al composite with size of 50 mm × 100 mm × 8 mm. The physical property of the workpiece was shown in Table 1. The shape of SiCp/Al composite specimens made on the test piece was 8 mm × 20 mm × 3 mm according to the design of experiments on the WEDM.
Physical property parameters of SiCp/Al composite.

Equipment setup
Experiments were conducted by a high-performance, five-axis computer numerically controlled (CNC) WEDM machine named HK-5040F, which is shown in Figure 2. To avoid oxidation of the workpiece, it had anti-electrolysis plus generator produced by Dongguan Hustinova Precision Machinery Co., Ltd. A copper wire with diameter of 0.25 mm was used in this experiment, and the dielectric temperature kept at 25°C. In addition, the wire tool was vertical to workpiece plane. Since the current cannot be set on rough cutting the workpiece in this machine, the constant current value was 10 A. Other fixed parameters were listed as open voltage: 300 V, servo voltage: 60 V, polarity: positive and negative polarity (anti-electrolysis power), dielectric characteristics: purified water, wire velocity: 0.2 m/s.

CNC HK-5040F WEDM equipment: (a) WEDM equipment, (b) workbench in cutting, (c)workpiece after machining, and (d) microstructure of SiCp/Al composite.
Design of experiments and experimental results
As above statements, the Sq and Sa can better reflect the extent of sampling data deviating from the reference plane and characterize 3D surface roughness of WEDM SiCp/Al composite, while MRR can indicate the processing efficiency of machining process.
It was very clearly that we should obtain good surface roughness and desired processing efficiency simultaneously in the WEDM process. However, these goals were conflict. Thus, this was a multi-objective optimization problem. In view of this, Sq, Sa, and MRR were regarded as three goals. In the experimental process, the machining time (t) was recorded, and the material removal volume (V) was calculated after finishing machining with one experiment. Then MRR can be determined by V/t.
According to our experience, the literature survey, the experimental data were initially collected based on the Taguchi method of experimental design, which were L18 (61 × 33) listed in Table 2. In the WEDM process, the parameter of Ton had extreme effect on the machining performance. Hence, the level of it was six grades, and that of others are three grades. Since the testing cost of SiCp/Al composite is expensive, the Taguchi method can significantly reduce the number of experiment. In this study, the WEDM performance was mainly affected by following input parameters:
Ton—pulse duration,
Toff—pulse interval,
Wp—water pressure,
Wt—wire tension.
Factors and their level for machining experiments.

To investigate 3D micron-scale surface topography of SiCp/Al composite workpiece, the 3D white light interferometer measurement (Talysurf CCI 6000, with both X-axial and Y-axial white light probe moving intervals of 4 µm and vertical feed resolution of 0.5 nm) was employed to measure the workpiece surface roughness (Sq and Sa) by computer auto-measurement system.
The definition of Sq and Sa was given as follows


Figure 3 shows the 3D micron-scale surface topography for typical four WEDM samples. These four samples are No.1, No.6, No.11, and No.17, which are listed in Table 3. From Figure 3, it can be observed that the micron-scale surface topography for EDM of SiCp/Al composite represents relatively uniform geological appearance. When the surface roughness is small, the surface characteristic is more delicate. Combined with Table 3, the rough machined surface can be gained with the larger MRR.

3D micron-scale surface topography of different samples: (a) No. 1, (b) No. 6, (c) No. 11, and (d) No. 17.
Experimental design and results by Taguchi method.

MRR: material removal rate.
Analysis and discussion
Analysis of experimental results
Minitab 16 used in this study is a popular statistical analysis software for analyzing Taguchi experiments. In the Minitab software, the main effects plot displays the means for each group within a categorical variable. Minitab creates the main effects plot by plotting the means for each value of a categorical variable. A line connects the points for each variable. The main effects plot of process parameters on MRR, Sq, and Sa is shown in Figures 4 and 6, respectively. Each plot shows the main effect of one of the cutting parameters, such as pulse duration and pulse interval. The vertical coordinates represent the mean values of desired machining performance at each certain level of the process parameters in WEDM. From Figure 4(a), it can be drawn that the MRR increases with the increase of pulse duration (Ton). Figure 4(b) shows that the MRR decreases with the increase of pulse interval (Toff). It is clear that the discharge energy is associated with the pulse duration and pulse interval. As mentioned in the literature, the MRR increases with the discharge energy. Although it is cutting SiCp/Al composite in WEDM, Figure 4(a) and (b) are broadly consistent with previous works.8,10,15 However, for non-electric parameter showed in Figure 4(c) and (d), there are no significant changes. In Figure 4(c), the MRR slightly increases with the increase of water pressure (Wp). But in Figure 4(d), the MRR first slightly decreases with the increase of wire tension (Wt) and then slightly increases.

Main effects plot for MRR: (a) pulse duration (µs) (6, 8, 10, 12, 14); (b) pulse interval (µs) (10, 15, 20); (c) water pressure (kg/cm2) (2, 3, 4); and (d) wire tension (kgf) (5, 6, 7).
As shown in Figure 4, the MRR does not monotonously increase or decrease with any single parameter. However, it is realized that delta range corresponding to pulse duration is very remarkable, which means the variation of the MRR corresponding pulse duration being larger than the other three parameters. From this analysis, it can be concluded that pulse duration is the most influential factor among the four parameters. It means that the electric parameters (pulse duration and pulse interval) are significantly associated with the MRR in WEDM of SiCp/Al composite. The non-electric parameters (water pressure and wire tension) slightly affect the cutting process, since discharge environment can be effected by them.
However, it can be drawn that the trend of Sq is similar to M from Figure 5(a). The lower value of Sq is in the level of 1 or 4 for pulse duration (Ton). When the level of pulse duration is 1, the MRR is not high according to Figure 5(a). Then, the desired value of Sq is in the level of 4 for pulse duration considering simultaneously the MRR. As a whole, the Sq increases with the increase of pulse duration. But, as some level, the Sq does not obey this rule. Different from variation for MRR in Figure 4(a), it is seen from Figure 5(a) that the Sq has no obvious continuous increase or decrease trend when the pulse duration increases. It can be inferred that by homogeneously decreasing the pulse duration would not totally gain the ideal smaller roughness value.
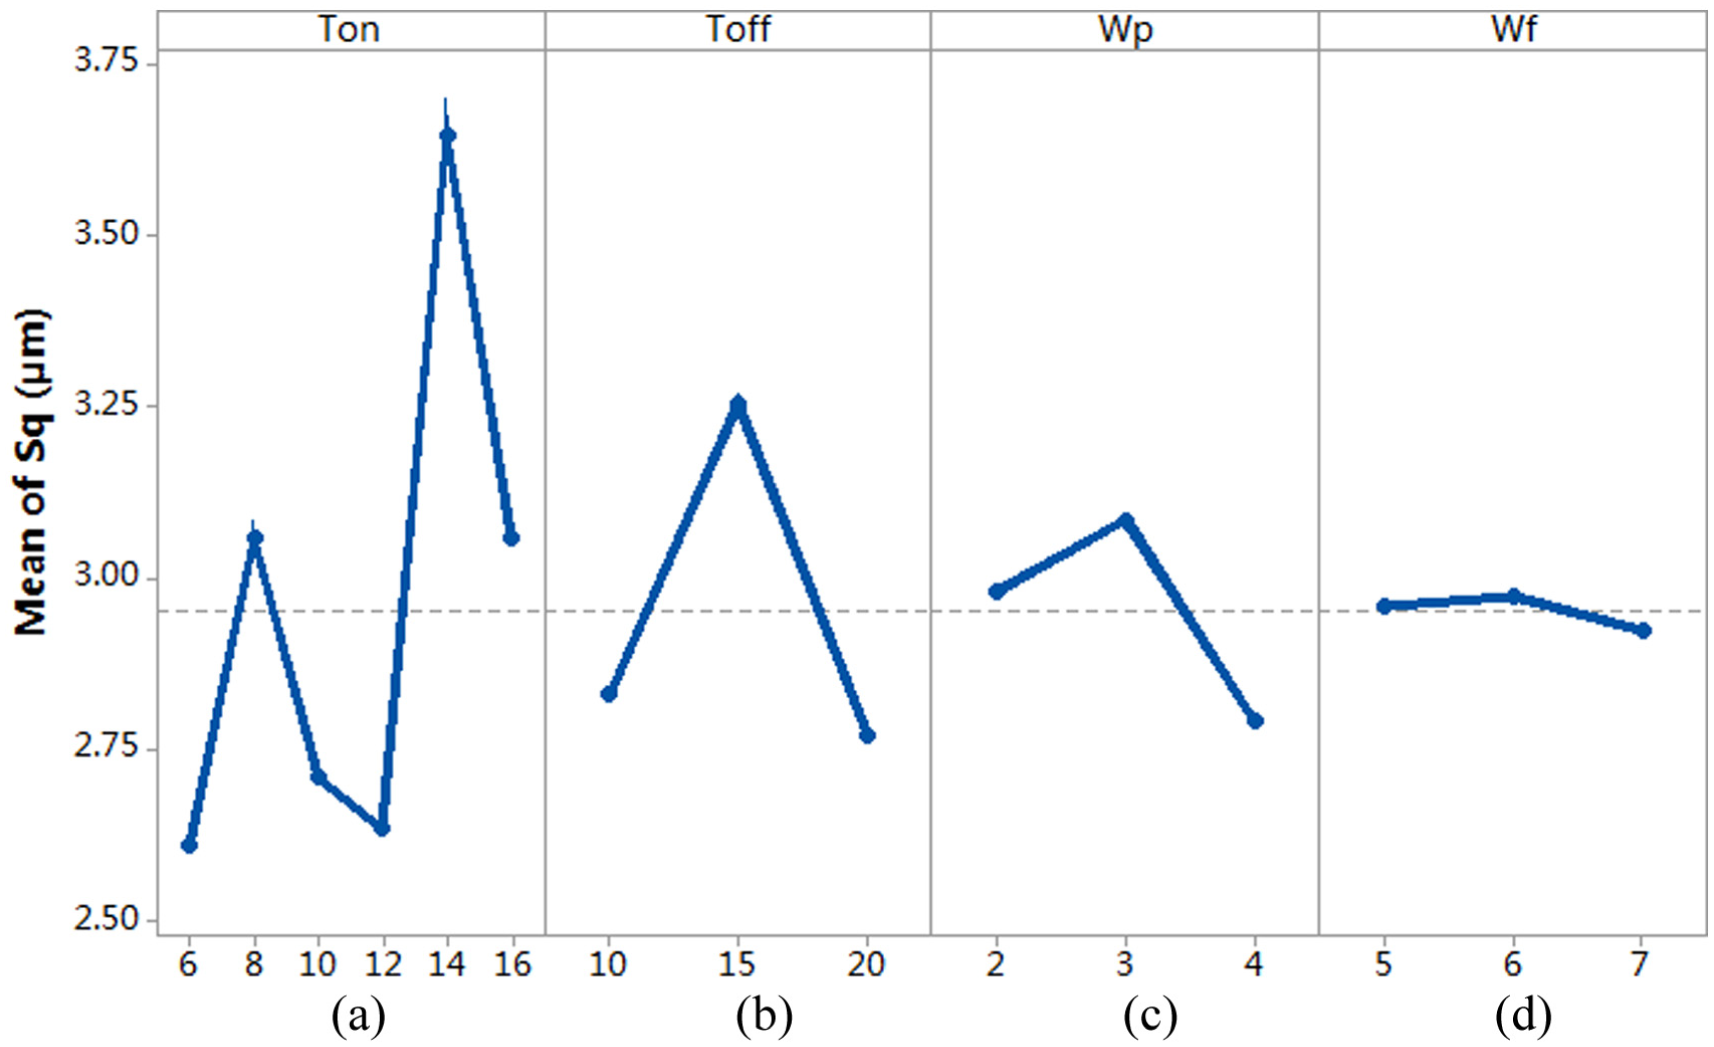
Main effects plot for Sq: (a) pulse duration (µs) (6, 8, 10, 12, 14); (b) pulse interval (µs) (10, 15, 20); (c) water pressure (kg/cm2) (2, 3, 4); and (d) wire tension (kgf) (5, 6, 7).
This may be that the cutting workpiece is SiCp/Al composite, and it contains high proportion SiCp particles. When discharge energy is high in this level, the molten Al cannot be removed from the workpiece and solidified on the surface of workpiece. While from Figure 6(b)–(d), Sq first increases with the increase of pulse interval (Toff), water pressure (Wp), and wire tension (Wt), respectively, and then decreases. It is realized that effect order of Sq is pulse duration, pulse interval, water pressure, and wire tension. Similar to MRR, pulse duration is also the most influential factor for Sq in the four parameters. Figure 6 shows the main effects plot for Sa. It can be concluded that the trend of Sa is similar to Sq.
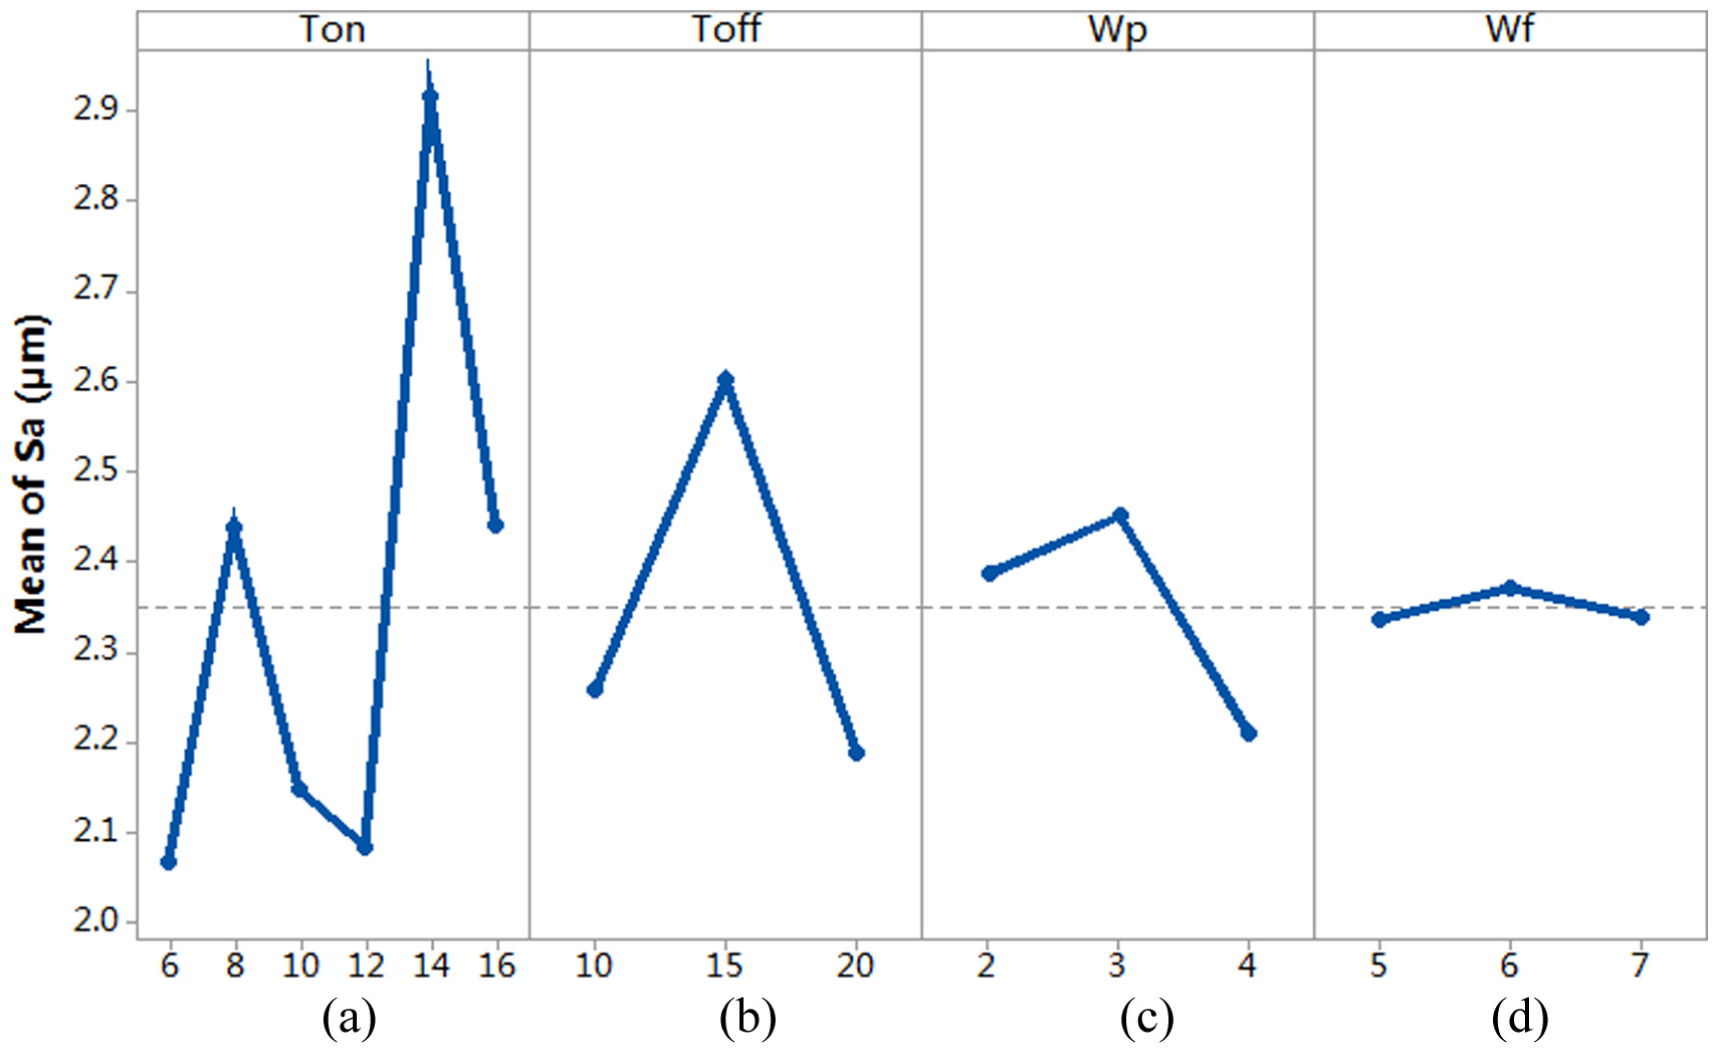
Main effects plot for Sa: (a) pulse duration (µs) (6, 8, 10, 12, 14); (b) pulse interval (µs) (10, 15, 20); (c) water pressure (kg/cm2) (2, 3, 4); and (d) wire tension (kgf) (5, 6, 7).
Comparison between GPR and other regression models
The GPR was compared with LRM and BPNN to evaluate its effectiveness; the experimental data were divided into two groups. One group is training data, which is used to build regression models. Another was testing data, which was utilized to evaluate regression models. In this section, the selection of training data was random, in which the test sample size was three, and the times of training were five. This meant that there were the same five testing experimental for these three regression models. The prediction results are listed in Tables 4–6, which were compared with the testing data. The prediction relative error is defined as equation (10)

The predictive error of MRR.

MRR: material removal rate; GPR: Gaussian process regression; LRM: linear regression model; BPNN: back propagation neural network.
The predictive error of Sq.
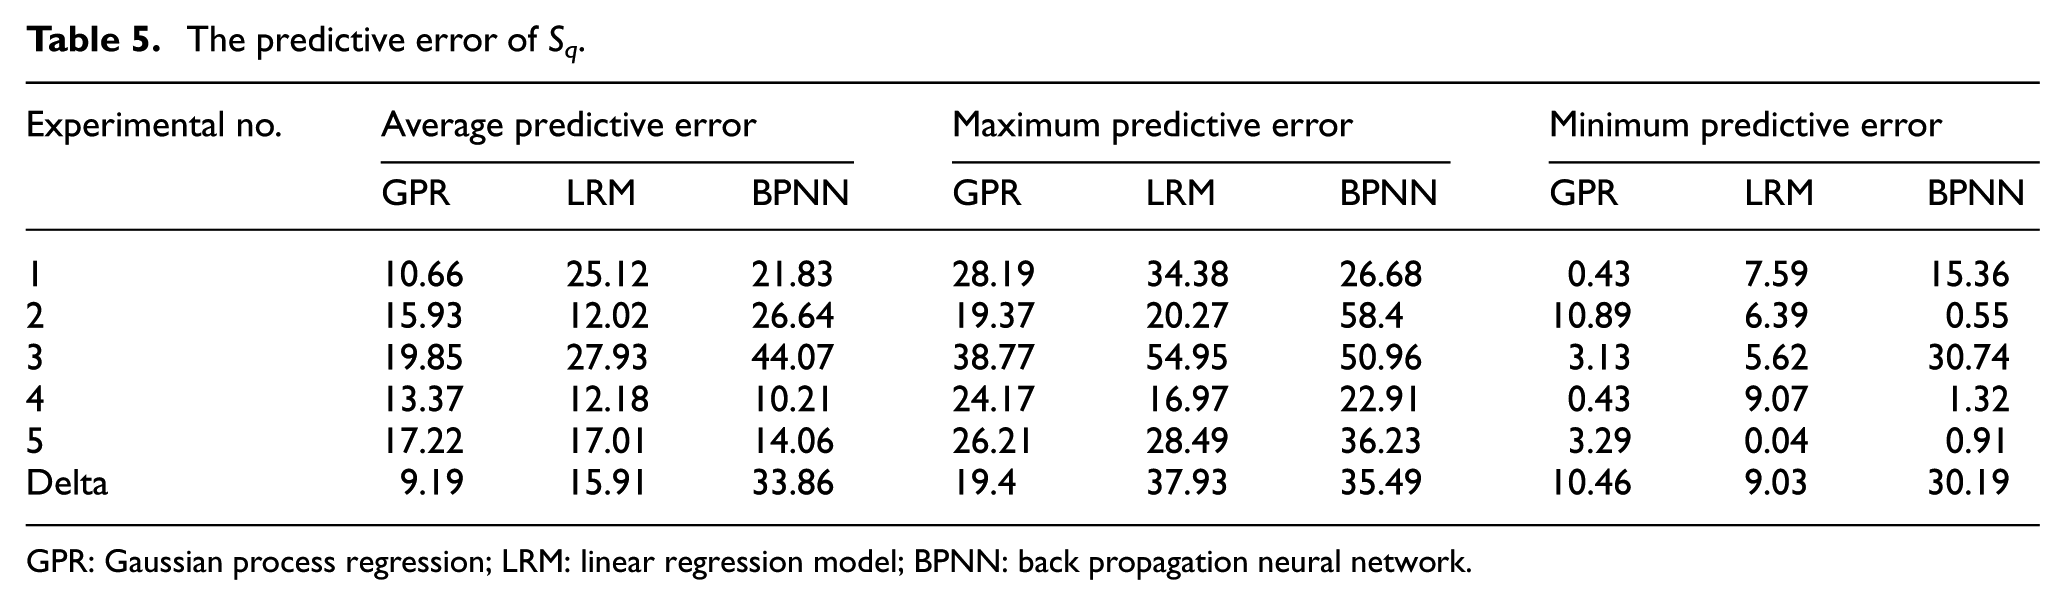
GPR: Gaussian process regression; LRM: linear regression model; BPNN: back propagation neural network.
The predictive error of Sa.

GPR: Gaussian process regression; LRM: linear regression model; BPNN: back propagation neural network.
where the

In Tables 4–6, the maximum predictive error and minimum predictive error are also listed. Through these evaluation criterions, the comparison of three models could be drawn. It is observed that there are large errors in a few predictive examples. SiCp/Al composite has the anisotropic characteristic, when measuring the 3D surface roughness using white light interferometer measurement, even if the different microcosmic area is selected to be measured for the same machined surface, there has minor differences for the surface roughness. The complex discharge process of EDM might cause inaccuracy. Therefore, there would be individual predictive results producing large error.
Figures 7–9 also show the data by graph, which are listed in the above three tables. And the error band depicts the deference between the maximum predictive error and minimum predictive error.

The predictive error of MRR.

The predictive error of Sq.

The predictive error of Sa.
Figure 7 depicts the predictive error of MRR. It can be drawn that both the predictive error and the error band of BPNN are worse than that of others. And the predictive error of LRM is better than that of GPR with small difference in the error band. It means that the LRM is the best of three regression models under predictive error. However, the delta of both the APE and the maximum predictive error of LRM listed in Table 4 are larger than that of GPR, which means that the GPR has better generalization ability. Considering that the APE of GPR is not more than 10%, the GPR is appropriate for prediction of MRR while machining SiCp/Al composite.
Figure 8 shows the predictive error of Sq. It can be drawn that the error band of GPR is better than that of others, and the predictive error of BPNN is worse than that of others. The delta of both the APE and the maximum predictive error of GPR listed in Table 5 are smallest in three regression models. Because of the randomness of discharge, it is very hard to predict the surface roughness, especially for the 3D surface characteristics. In addition, the workpiece of SiCp/Al composite is a high volume fraction with 45% SiC particles. The melted matrix Al can be re-solidified on the surface by discharge interval, due to its low melting point. Then, the 3D surface characteristics of SiCp/Al composite will be affected by process parameters. In a certain degree, there exists some randomicity and complexity of prediction in 3D surface characteristics. However, the GPR has the merit of building complex model by small sample size. It is wise to select the GPR to build the Sq predictive model in the three models.
Figure 9 depicts the predictive error of Sa. It is similar to that of Sq in whole. It is noticeable that the error band of experimental No.1 and No.5 in BPNN is very small. However, the error band of experimental No.2 in BPNN is very large. This means that the BPNN has not the ability in generalization by small training sample. Therefore, the GPR is appropriate for prediction of Sa while machining SiCp/Al composite.
WPA for multiple optimizations with desirability function
There are three forms of the desirability fitness functions according to the response characteristics. In this study, “the larger the better” characteristics are applied to determine the individual desirability values for removal rate and 3D surface characteristics (negative for both Sq and Sa), since all responses should be maximized. The weightage for MRR, Sq, and Sa were considered as 1/3. For “the larger the better,” the formula used for calculating the individual desirability index is given as

To form a single value called composite desirability fitness, the individual desirability index of all the responses can be calculated using equation (13)

where di is the individual desirability of the property yj; wi is the weight of the property yj in the composite desirability, and w is the sum of wi, respectively. By GPR model, the di is calculated by giving process parameters in search space. Because of minimizing the fitness by WPA approach, the −1 × dG is the fitness function for optimizing the multi-performance characteristics under GPR model.
For this optimization solving, the WPA approach was adopted under above equations (10) and (11), in which the r and w1, w2, and w3 are 1, 2, 1, and 1, respectively. The ranges and targets of input process parameters namely Ton, Toff, Wp, and Wt and the response characteristics MRR, Sq, and Sa are given in Table 7.
Range of input parameters: MRR, Sq, and Sa desirability.

MRR: material removal rate.
Table 8 shows the possible combination of WEDM process parameters that give the high value of desirability. 3D contour plots offering overall desirability for multi-performance characteristic are shown in Figure 10. The optimal region has been located near to right-middle area which has a desirability value of 0.7761 that gradually reduces as we moved left and upward. Corresponding to highest desirability, optimal combination of WEDM process parameters for multi-performance characteristics are Ton: 12 µs, Toff: 10 µs, Wp: 4 kg/cm2, and Wt: 7 kgf. However, the Ton, Toff, Wp, and Wt only can be selected as integers. In addition, from Figure 4(a), Ton is a significant parameter affecting the MRR, and also the Ton of No.1 in Table 8 is the largest one. Hence, the Ton is selected 13 in order to increase the MRR. The optimal combination of WEDM process parameters for confirmation experiment that has been carried out were Ton: 13, Toff: 10, Wp: 4 and Wt: 7, and the obtained results for MRR, Sq, and Sa were 97.45 mm3/min, 2.5614 µm, and 1.9817 µm, receptively. Then it is suitable to select the predicted result for the parameter combination of No.1 in Table 8. Compared with the confirmation experiment result and predicted result, the relative errors for MRR, Sq, and Sa, that is 7.63%, 8.25%, and 5.64%, were calculated with equation (10).
Process parameters combination for high value of desirability.

MRR: material removal rate.

3D contour plot for overall desirability (Wp = 3.9 kg/cm2 and Wt = 6.9 kgf).
Discussion
As we all known that it is a thermal process for WEDM. The surface integrity is also affected by the mechanical, topological, metallurgical, and chemical condition of the surface region. Except the electric parameters, the non-electric parameters also have little effect on the surface integrity. Trends of 3D surface characteristics (Sq and Sa) in WEDM SiCp/Al composite are very changeable, which indicates that the thermal process of cutting SiCp/Al composite is very more complicated.
In WEDM process, the MRR, Sq, and Sa are related to the material removal per discharge, which is determined by the electric parameters. Since the discharge channel between the workpiece and electrode becomes ionized plasma, the high discharge energy between them will melt the surface that leads to driving the ionized particles to impact the melted surface. This is also confirmed by simulation model of WEDM. Under molecular dynamics simulation,42,43 it is found that high discharge energy can lead to melt larger diameter and to deepen the depth of the melted area as well as higher metal removal efficiency. This is also validated by scanning electron microscope (SEM) photos in Figure 11. In whole, the micrograph of SiCp/Al composite of No.1 is better than that of No.4 and 11. In addition, the metal removal efficiency is related to the melted volume. When the depth of melted area is deeper, the metal removal efficiency is larger. This is also validated by the experiment of this study listed in Table 3.
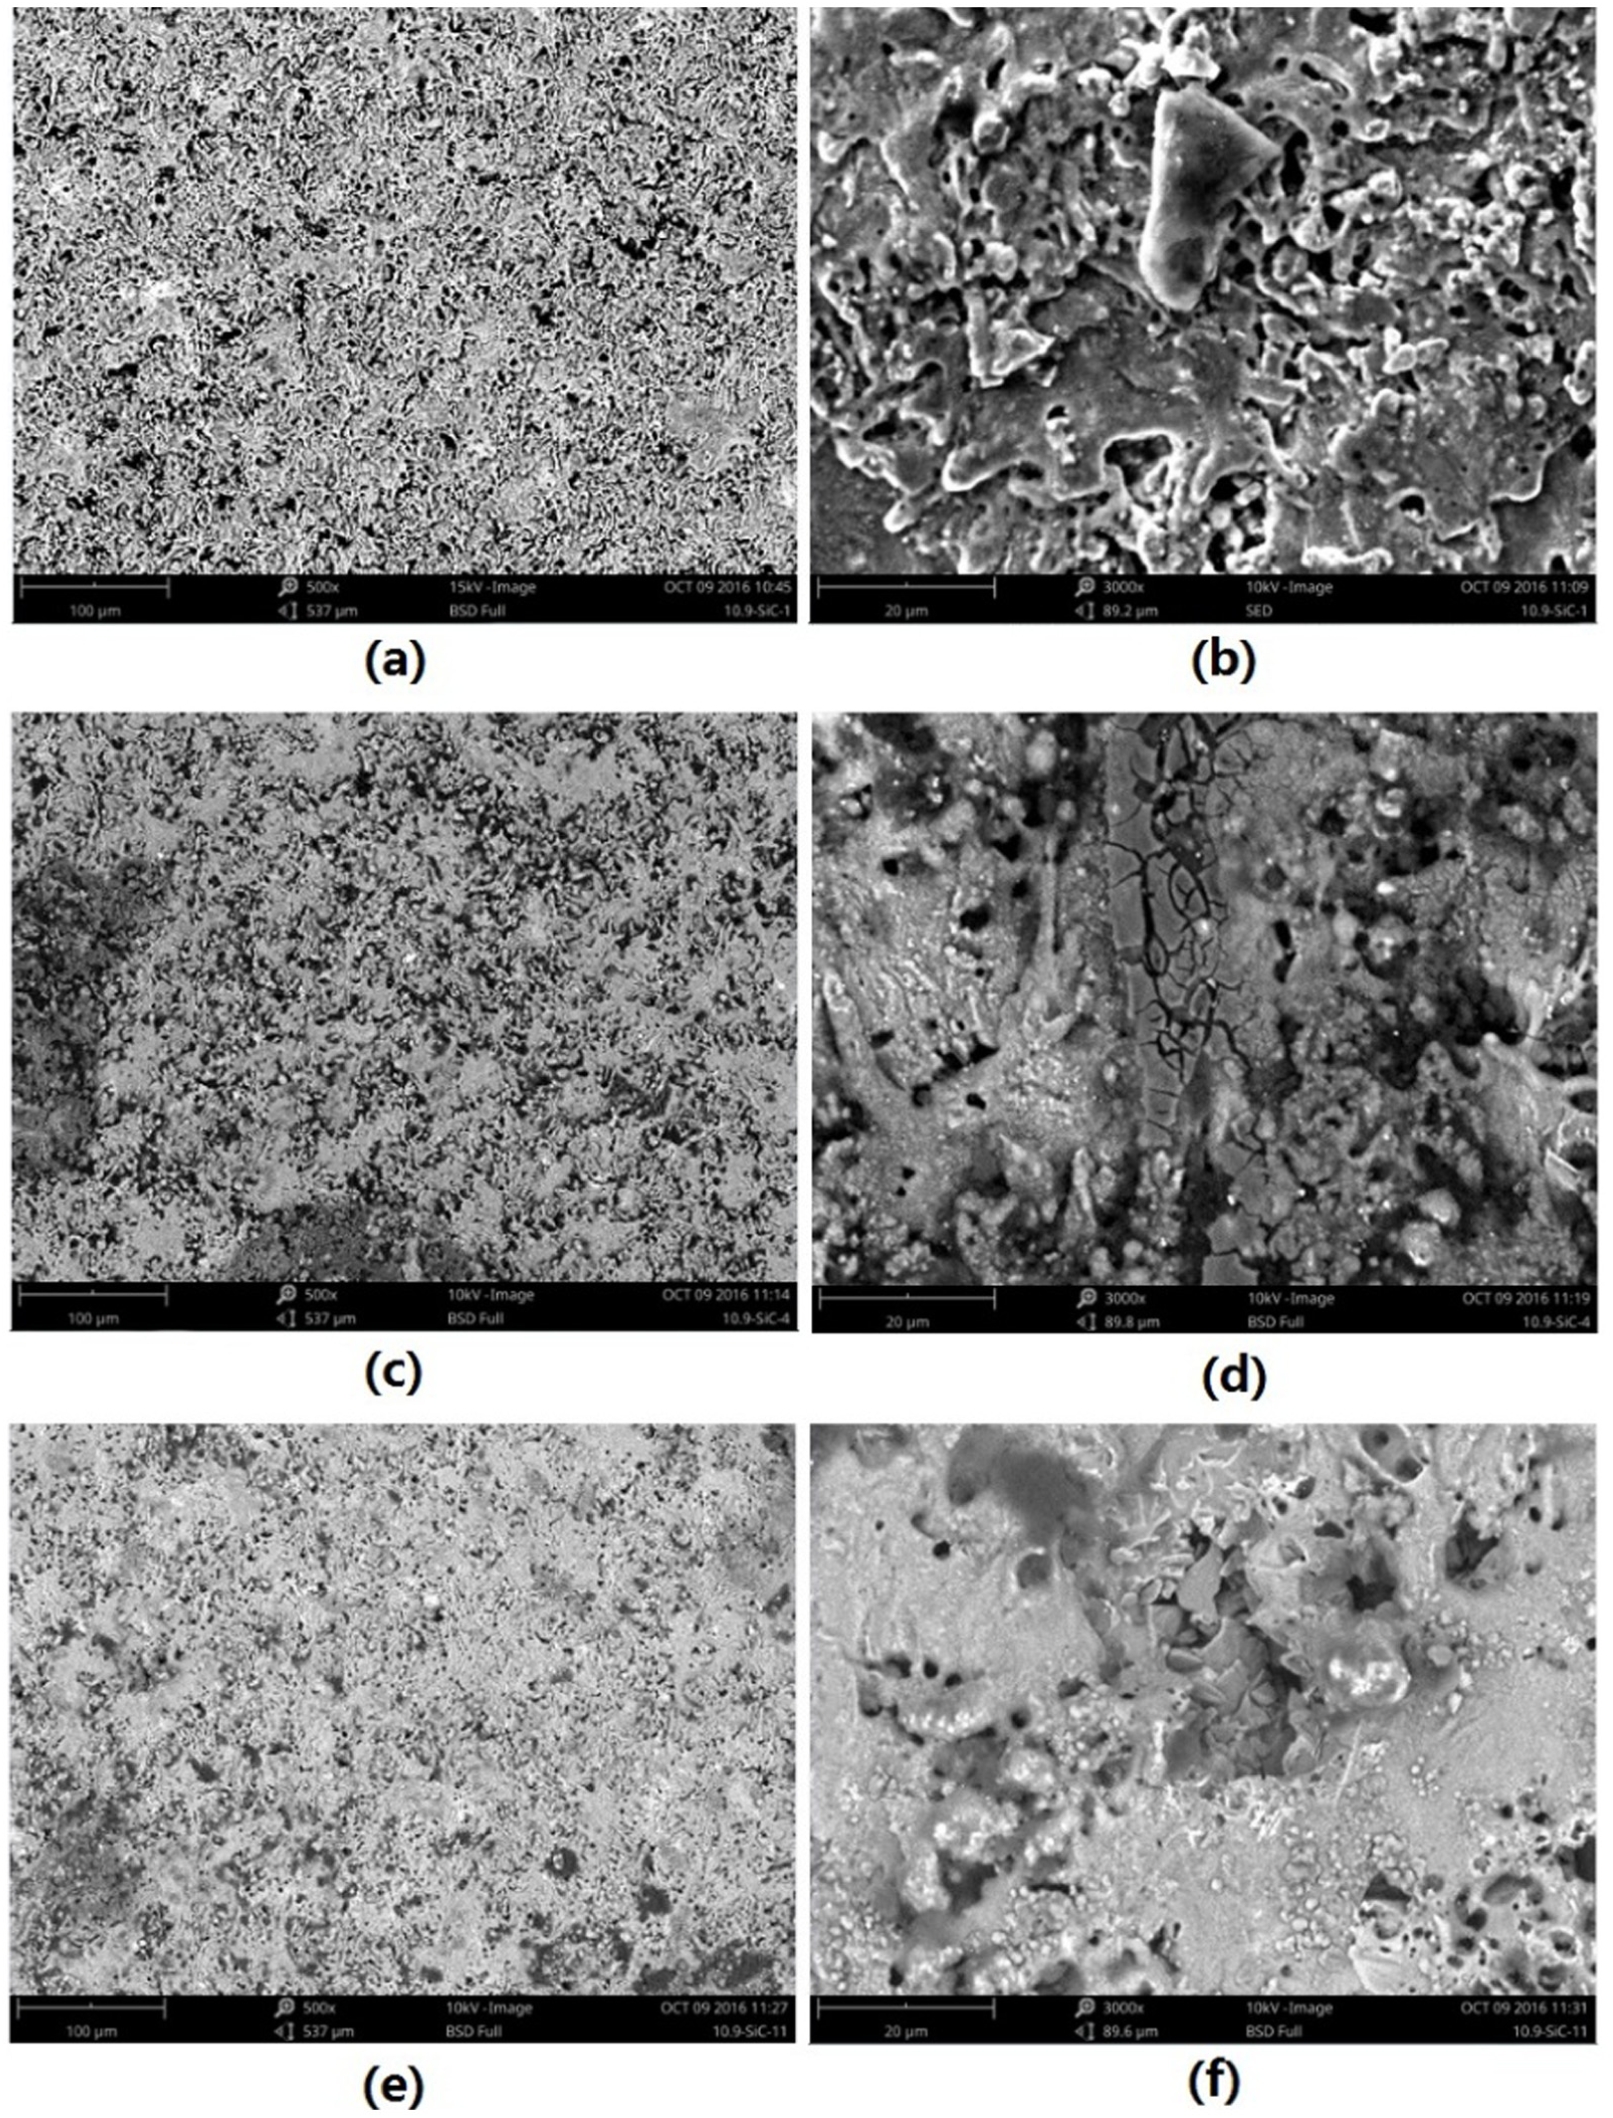
SEM photos of SiCp/Al composite: (a) SEM of No.1 sample at X500, (b) SEM of No.1 sample at X3000, (c) SEM of No.4 sample at X500, (d) SEM of No.4 sample at No.4 sample at X3000, (e) SEM of No.11 sample at X500, and (f) SEM of No.11 sample at X3000.
It can be seen from Figure 12, the recast layer has formed on the machined surface during EDM of SiCp/Al composites. The recast layer is produced under the action of thermo-force coupling. Due to the low melting point Al matrix, the matrix material melts quickly at high temperature produced in the discharge process of EDM. The melted material undergoes a faster cooling solidification under the action of working fluid. From Figure 12, it is also observed that there are number of holes formed in the recast layer. One possible reason is that the micro explosion and gasification action between wire electrode and workpiece take place during the discharge process, which releases a lot of gas. Part of the gas gets into the melting material. When the melted material begins to cool solidification, thereupon the gas comes up. Finally, numbers of holes are formed.

EDS analysis result for No.1 sample: (a) SEM of No.1 sample at point 1; (b) EDS analysis result for point 1; (c) SEM of No.1 sample at point 2; and (d) EDS analysis result for point 2.
In the recast layer, it is observed that there are a number of micro cracks (especially in Figure 11(d)) on the surface. By the study of Hung et al. 44 in SiCp/Al composites, these micro cracks are caused by high tensile residual stress, which exceeds the ultimate tensile strength of the material. From SEM photographs, cracks can be seen on the recast layer and seldom penetrates beyond the recast layer as observed by previous research. The surface damage could be considered to be limited to the thickness of the recast layer. In addition, a number of holes in the surface machined are found from these SEM photos. It can be seen that the diameter of holes of No.4 or No.11 is larger than that of No.1. This is because that the cutting process is more violent in high discharge energy. Therefore, more metal derrises are generated in this cutting process, and the diameter of bubbles could be larger than that in lower discharge energy. When the melted surfaces begin to cold, these bubbles will affect the micrographs of SiCp/Al composite.
During cutting SiCp/Al composite, some SiCp particles around discharge channel were cracked into sub-particles by thermal energy and could be inserted into the aluminum alloy substrate. This phenomenon is confirmed by Figure 11(f), in which SiC particles were broken and plunged into the surface (in the center region of Figure 11(f)). From the energy dispersion spectrum (EDS) analysis depicted in Figure 12(a) and (b), it can be seen that the content of Si element is larger than Al. One possible reason is that in the discharge process, some SiC particle is adhered to the recast layer; furthermore, a little melted Al matrix is coated on the SiC particle. On the contrary, the content of Al is higher than Si in Figure 12(a) and (b), which can be illustrated that most of the melted aluminum matrix mixed with the recast layer left on the machined surface.
Conclusion
The present study proposed an effective approach and framework in predicting and optimizing process parameters of WEDM SiCp/Al composite using GPR-WPA. The following conclusions can be drawn based on the experimentation and GPR-WPA optimization:
After the analyses of variance of process parameters, the results show that Ton and Wp are significant parameters affecting the MRR, while Ton and Toff are significant for Sq and Sa. Compared with LRM and BPNN, the effective of GPR is confirmed for small size sample while machining SiCp/Al composite and the worst APEs of five independent tests for MRR, Sq, and Sa are not more than 10.66%, 19.85%, and 22.4%, respectively.
The integrated GPR-WPA approach is utilized to achieve the optimal parameter settings of pulse duration, pulse-off time, water pressure, and wire tension. Under maximizing the overall desirability function, the optimal process parameters that are Ton: 13 µs, Toff: 10 µs, Wp: 4 kg/cm2, and Wt: 7 kgf were obtained by the integrated model, while the relative error of optimizing MRR, Sq, and Sa are 7.63%, 8.25%, and 5.64%, respectively.
The proposed approach and framework could give the optimal process parameter settings on pulse duration, pulse-off time, water pressure, and wire tension of the cutting process, while the GPR model is more accurate and stable than that using LRM or BPNN.
Footnotes
Appendix 1
Handling Editor: Yangmin Li
Declaration of conflicting interests
The author(s) declared no potential conflicts of interest with respect to the research, authorship, and/or publication of this article.
Funding
The author(s) disclosed receipt of the following financial support for the research, authorship, and/or publication of this article: This research is supported by the Natural Science Foundation of China (grant no. 51505434), the Natural Science Foundation of Henan Province, China (grant nos 182300410170 and 182300410215), the Scientific and Technological Research Project of Henan Province (grant no. 172102210547), and the Program for Innovative Research Team in Science and Technology in University of Henan Province (grant no. 18IRTSTHN015). This work also supported by training program for young backbone teachers in Colleges and Universities of Henan Provincial Educational Department (2015GGJS-183).