
Abstract
In this study, a mixed meta-modeling-based optimization method has been proposed and applied to a commercial vehicle for crashworthiness design subjected to the frontal crash. A full-scale finite element model of the commercial vehicle has been built and validated by a crash test. The front frame parts have been separated to build a sub-model for crashworthiness optimization. Sensitivity analysis has been performed to find the design factors contributing most to crash performance by using design of experiments. With the reduced dimensions of design space, meta-models of crashworthiness criteria (i.e. specific energy absorption, peak crush force, and peak crush acceleration) have been built by using polynomial response surface and radial basis function networks, respectively. The meta-models with higher global fidelity in design space have been adopted to formulate the multi-objective optimization problem of crashworthiness design, which has then been solved by using Non-dominated Sorting Genetic Algorithm-II. The obtained Pareto front has been discussed and validated with that achieved by Strength Pareto Evolutionary Algorithm 2. The normalized optimal solution from the Pareto front has resulted in 11.15% increase in specific energy absorption and 13.2% decrease in peak crush force for the frame and has led to an obvious improvement in occupant protection and energy absorption for the whole vehicle, verifying that the proposed method is effective for vehicle crashworthiness optimization.
Keywords
Introduction
Structural optimization considering crashworthiness performance is becoming more important in recent commercial vehicle design. Vehicle crashworthiness design aims at ensuring passenger’s safety and reducing crash cost. Though real crash test for vehicle crashworthiness analysis is reliable, it is expensive and time consuming. 1 To save money and time in developing vehicle components, finite element analysis (FEA) is favorably employed to perform numerical simulations as an alternative to the real test. The diagnostic parameters such as specific energy absorption (SEA) and peak crush force (PCF) can be obtained via FEA and used to assess the vehicle crashworthiness performance. 2 Furthermore, they can be considered as the objectives in optimization design. Since the vehicle crash is involved with a large scale and highly non-linear process, the relationship between the vehicle structures and the crashworthiness performance is difficult to describe with an explicit function. 3 Thus, it is impractical to conduct direct optimization on the full non-linear model of the vehicle with the conventional design and crash test technique. This study is motivated by the need to improve the crash performance of a commercial vehicle with an efficient way. In this article, an efficient approach, which integrates modeling, simulation, analysis, and optimization of vehicle crash performance, is proposed and applied to a commercial vehicle, which is accompanied by the real crash test.
In recent decades, meta-modeling method has evolved immensely and been widely recommended in crashworthiness design for its high fitting capability. 4 Approximate models can be applied to evaluate the crash performance of any feasible design instead of performing the time-consuming simulation. Several studies have been carried out to present the fundamental and systematic research to conduct design optimization of vehicle structures with meta-modeling technique. Liao et al. 5 presented a two-stage procedure to cope with crashworthiness design of a structural frame and occupant restraint system. In the first stage for crashworthiness design of a structural frame, explicit finite element (FE) method was employed to construct response surface and Kriging model with various design-of-experiment techniques.
Through investigating the design of a chassis frame in a pickup truck by using a time-based meta-modeling technique, Kamel et al. 6 presented a method to derive the relation between minimum structural weight and maximum impact energy for crashworthiness improvement.
By using LS-OPT®, Bojanowski and Kulak 7 developed a meta-model-based approach to perform multi-objective optimization of the bus structure for the rollover and the side impact tests. The structural components of the bus having the greatest influence on the bus performance in the simulated test scenarios were identified and optimized.
To accomplish lightweight design of vehicle structures parameters under crashworthiness, Zhu et al. 8 explored the use of conservative surrogates for safe estimations of crashworthiness responses. Safety margins have been used to conservatively compensate for fitting errors associated with surrogate, which would help push optimization toward the feasible region of the design.
Kim et al. 9 developed a progressive meta-model-based design optimization to solve modern automotive design problems including the results of non-linear FEA and multi-body dynamics. In his research, three meta-model methods were newly introduced to efficiently and stably construct the meta-models for the approximate optimization problem.
In general, with the meta-modeling technique, the structural design for vehicle crashworthiness can be conducted effectively to find the optimal size combination. 10 However, the application of meta-modeling technique is usually followed by some typical problems. It is difficult to build an approximate model to fit a complex system with many design variables like a full-scale vehicle body by using a single meta-model. Another problem is that crashworthiness design requires simultaneous improvements of several design objectives which often conflict with each other, leading to a challenging multi-objective design problem. 11
There have been some publications regarding multi-objective optimization for crashworthiness design. Khalkhali et al. 12 applied modified Non-dominated Sorting Genetic Algorithm-II (NSGA-II) to perform the multi-objective optimization of perforated square tubes and extracted trade-off optimum design points from 105 non-dominated optimum points.
Yin et al. 13 applied different surrogate model to perform the structure optimization for truck cab and then integrated the techniques of order preference by similarity to ideal solution with NSGA-II to obtain the optimal compromise solution from the Pareto front.
Zhang et al. 14 explored the design issues of thin-walled bitubal structures filled with aluminum foam and sought the optimal solutions for improving the crashworthiness by using the GA and NSGA-II, respectively.
Through the above-mentioned studies, it can be concluded that despite the surrogate models, intelligent optimization algorithm can also simplify multi-objective optimization problems and yield reliable optimal results. Thus, it is also a challenge to choose a right optimization methodology (i.e. NSGA-II, multiple objective particle swarm optimization (MOPSO), and adaptive simulated annealing (ASA)) to match the sampling technology and approximate technology.
The purpose of this article is to propose a mixed meta-modeling-based optimization method and apply it to a vehicle crashworthiness design case. In this work, a full-scale FE model of a commercial vehicle has been built and validated through the real crash test. The front frame parts have then been identified as the main components contributing most to the crash performance under frontal crash and separated to build a sub-model for crashworthiness optimization. Sensitivity analysis has been carried out to reduce the dimensions of design space for crashworthiness design. The polynomial response surface (PRS) and radial basis function (RBF) networks have been used to construct the meta-models of crashworthiness criteria (i.e. SEA, PCF, and PCA). A comparative study has been performed to build a mixed meta-model with higher accuracy, which has then been employed in multi-objective optimization (MOO) design problem. To achieve maximum SEA and minimum PCF in MOO, NSGA-II has been used to seek for the Pareto front set of designs. As a reference, the obtained frontier has been compared with that generated by utilizing Strength Pareto Evolutionary Algorithm 2 (SPEA2). A normalized optimal solution has been determined and applied to the vehicle crashworthiness design case, verifying the effectiveness of the proposed method.
Crashworthiness analysis of a commercial vehicle
The FE method for numerical simulation has been developed immensely over the years and is becoming an indispensable technique in vehicle engineering research. 15 In this section, the crashworthiness analysis of the commercial vehicle has been performed by using the non-linear FEA method. The full-scale FE model of the vehicle has been built to simulate the vehicle behavior under the frontal crash, which has been validated through a real crash test. Then, a detailed discussion about crash performance has been presented aiming at finding the potential approach for crashworthiness design.
Full-scale FE modeling
The commercial vehicle investigated in this study contains large parts of stamped steel plates, which are connected by welding, bolting, and so on. For most body parts, the thickness values are far smaller than the other sizes. Thus, the Belytschko–Tsay (BT) reduced integration thin shell element has been used to simulate these parts. For other three-dimensional (3D) parts such as the pedestals, the eight-node solid elements with one-point reduced integration have been widely recommended. The welding element has been used to model the welding spot of the vehicle, and this element type uses the solid element to simulate the loading of the weld. The bolt between the connected parts has been simulated by using the one-dimensional (1D) rigid element integrated with the beam element. To simultaneously ensure the convergence and the computational cost of the FE simulation, the basic element size of the whole FE model has been set to be 10 mm as suggested in the published work by Chen et al. 16 The whole model includes a total of 689,742 elements, containing 585,367 quadrilateral elements, 10,536 triangular elements, and around 65,439 solid elements. The number of triangular elements and tetrahedron elements in the model has been limited within 5% of the total number to ensure the mesh quality.
Considering that the impact process contains large elastic distortions which may happen transiently, the elastoplastic material model type 3 in LS-DYNA® has been employed to simulate most of the vehicle parts. This material model type can also simulate the stain rate phenomenon with the Cowper–Symonds strength model. The Cowper–Symonds constants C and p used for the strength model vary with the materials for different vehicle parts. Take DP600 steel plate in vehicle body as an example, C = 3.25E+06 s−1 and p = 12.4. In addition, the built FE model has also taken into account the initial stress and the residual strain formed during the stamping process.
Crash simulation and experimental validation
To analyze the crash performance of the vehicle, the 100% frontal crash simulation has been performed with the initial velocity of 50 km/h. A solid rigid wall component has been modeled as the impact barrier. An automatic single contact type has been used to model the contact between the part surfaces with the friction coefficient of 0.35. This contact type depends on the penalty algorithm to avoid element interpenetration and transmit contact force during impact simulation. The explicit FE code LS-DYNA 17 has been employed to simulate the 120 ms impact simulation with a time step of 9.0E−09s. To validate the FE model, the simulation results have been discussed and compared with those obtained from the real crash test.
Figure 1 depicts the deformation of the commercial vehicle in the crash simulation and the crash test. It can be observed that the overall distortion of the crash simulation accords with the real crash test. Take the front door deformation, for example, which is usually represented as the relative displacement between the A pillar and the B pillar (Marked in Figure 1), and the measured value of the front door deformation associated with the crash test is 15.6 mm. As a comparison, the measured value in crash simulation is 14.8 mm, which shows an acceptable relative error (RE) of 5.1%. Again, as shown in Figure 1, the engine hood is observed to have a folded deformation from both the simulation and test.

Deformation comparison between crash simulation and crash test.
Figure 2 shows the acceleration curves of left and right B pillars, which is measured at the base point of the pillars. As shown in Figure 2, in test, the maximum acceleration of the left B pillar reaches 56g at nearly 40 ms, and the peak value of the right one is 55g. In simulation, the peak acceleration values of the left and right pillars are 51g and 56g, respectively. The REs given in this case are 8.9% and 1.8%, respectively. Not only the peak values are similar, but also the global tendency of the depicted simulation curves matches well with the crash test. Thus, the conclusion can be reached that the established FE model proves to be reliable for the subsequent research. Considering the B pillar acceleration is a critical parameter representing the occupant protection, the peak values of 51g and 56g should obviously be reduced.

Acceleration curves of B pillars.
The energy absorption behavior of the vehicle has been investigated, and the main energy curves during crash are depicted in Figure 3. As shown in Figure 3, the total energy of the crash system keeps constant, and the hourglass energy accounts for 1.81% of the total energy, which further validates the simulation results. The slide energy curve stands for the energy dissipation in friction. The kinetic energy curve continues to decrease until zero, while the internal energy curve keeps climbing until crash stops, revealing the main form of energy conversion during impact. Table 1 lists the detailed energy absorption for vehicle parts. It can be seen that most of the crash energy has been absorbed by front frame parts like the bumper, the bumper bracket, and the frame assembly, which represents 33.7% of the total energy. But there is still a large portion of energy absorbed by the vehicle body like the door and the A pillars, leading to a deformed passenger compartment which may cause occupant injury. Thus, the vehicle frame and frontal parts should be improved with respect to crash performance.

Time history of energy curves.
Energy absorption for vehicle parts.

Vehicle frame modeling
The numerical calculation of the full-scale vehicle crash simulation has taken about 4 days on a 4-CPU, 350 MHz N4000 processor. Considering the long computing time, applying the numerical optimization approach on the whole vehicle improvement is not cost-effective. Thus, to tackle this problem, the vehicle frame and frontal parts have been separated to build a sub-model for crashworthiness optimization. The detailed approach is demonstrated below.
The original sub-model is composed of 38 parts and the total mass is 576 kg, consisting of 36,673 elements and 37,451 nodes. The modeling parameters for sub-model are in complete agreement with those for full-scale model. Figure 4 shows the built FE sub-model.

FE sub-model of the front frame parts.
Through the above discussion of energy absorption performance, of 38 components, six components have been identified as the main components contributing most to the energy absorption, which are identified in Figure 4. Thus, the thickness values of these members have been selected as the design variables. The original design variables and corresponding design space are listed in Table 2. In this case, the high level and the low level for each factor are decided with the thoughts of processing technology and manufacturing cost. For example, an extreme value for the thickness of a member will be either infeasible or technology intensive.
Range of design variables (mm).

Crashworthiness design criteria
In general, there are many typical diagnostic parameters that can be used to evaluate the crash performance of a vehicle, namely, SEA, peak crashing force (PCF), and peak crashing acceleration (PCA). 18 The focus of this study is to improve the crashworthiness capacity of the vehicle structure with respect to passenger safety under frontal crash. Thus, the optimization objective has been set to simultaneously maximize SEA and minimize PCF without increasing PCA too much. For any given set of design variables, these three parameters (SEA, PCF, and PCA) can be numerically calculated by performing the FE simulation.
Since the crashing simulation and the solution search involve a highly non-linear and time-dependent process, these constructed crashworthiness criteria cannot be explicitly formulated. Therefore, preliminary designs and meta-modeling technique have been applied to create the approximate functions for the objectives and constraints.
Sensitivity analysis
Prior to meta-modeling, the influences of design variables on the objective functions under frontal crash have been studied by making sensitivity analysis. With design of experiments (DOE), sensitivity analysis can be performed to find the most sensitive factors and reduce the dimensions of design space. This heuristic implementation not only helps to increase the effectiveness of approximate functions but also assists to cut back on the later computational cost. 19 For this purpose, the FEA has been performed with the selected sampling design points which were determined through DOE method. The selection of the sampling design points is very important for the parametric study as well as the construction of the meta-models. 14 There are two main kinds of DOE techniques, namely, classic designs and space filling designs. The most commonly used classic designs include central composite design (CCD), fractional factorial design (FFD), and Box–Behnken designs. Popular space filling designs include maximum entropy designs, mini-max and maxi-min designs, Latin hypercube sampling (LHS) designs, and orthogonal arrays. 20 Usually, DOE is followed by analysis of variance (ANOVA), which is a statistical tool used to evaluate the contributions of design factors. 21 In this study, the CCD method has been used for sensitivity analysis since it has advantages in terms of sampling space and non-linear matching. A CCD orthogonal array (L3226) of six factors with two levels has been designed, which is listed in Table 3.
L3226 orthogonal design and results.
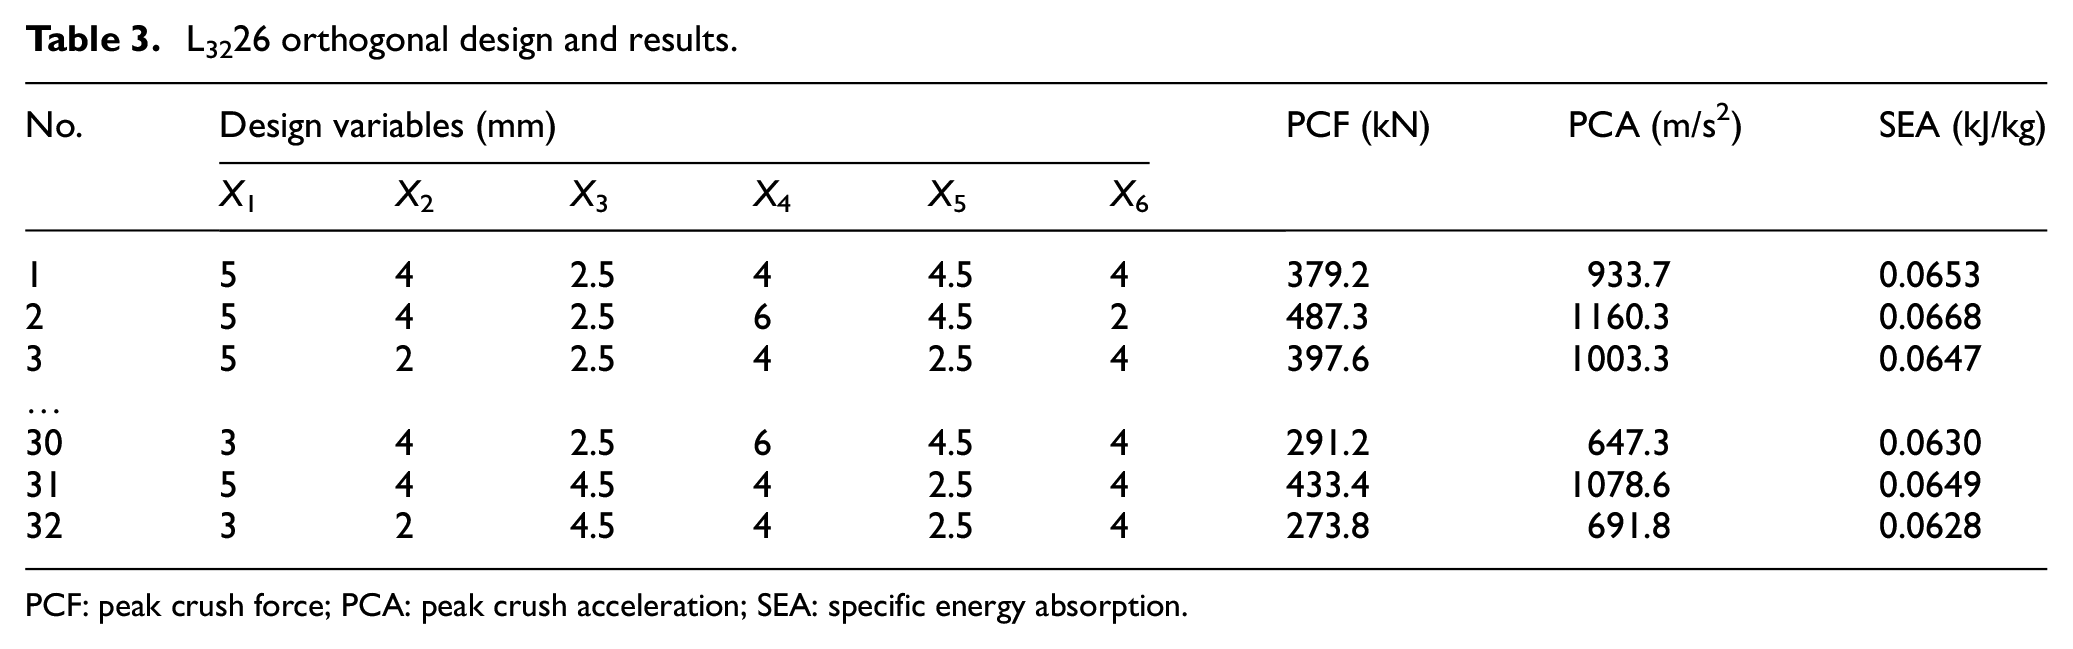
PCF: peak crush force; PCA: peak crush acceleration; SEA: specific energy absorption.
Crash simulations have been implemented at each design point to obtain SEA, PCF, and PCA, which are also shown in Table 2. On the basis of simulation results, ANOVA has been performed to assess the influences of design factors on the three objective responses. Figure 5 shows the Pareto effect plots of SEA, PCF, and PCA to each factor, with which the most sensitive factors can be identified. Finally, of six variables, X1, X3, X4, and X6 have been included in meta-modeling.

Sensitivity analysis of the design factors.
Meta-modeling for crashworthiness design
As mentioned above, the objective functions cannot be formulated analytically. To tackle this challenge, meta-modeling technique has been applied to construct the approximate models for each objective and constraint. There are several meta-models such as PRS, RBF networks, and Kriging (KRG), and each has its suitable range of application. In this study, the objective functions have been approximated individually with two different meta-models of PRS and RBF. The accuracy of the established meta-models has been evaluated and compared by making error analysis.
PRS
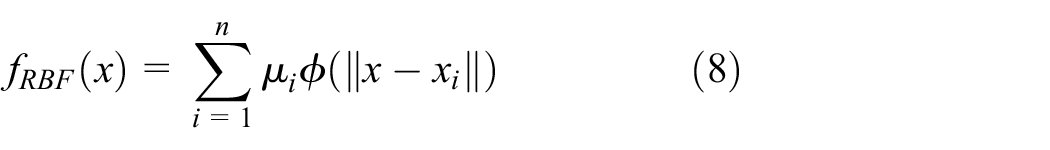
A previous research has demonstrated that PRS is considered appropriate in the design optimization problems involving complex non-linear mechanics like contact impact. 22 In general, the response function in the PRS model is given by

where

where
In this article, a first-order and second-order polynomial functions with the following standard expressions are adopted


where
On the basis of the results of DOE and sensitivity analysis, the PRS meta-models for SEA, PCF, and PCA are constructed using the quadratic polynomial functions given as follows


RBF networks
Differing from PRS, RBF networks are originally developed to capture the global tendency of topographic contour with geographical data. This method has great advantage in global approximation and is now used in many meta-modeling problems. 23 The typical RBF networks are composed of three layers of nodes, namely, input layer, hidden layer, and output layer, as shown in Figure 6.

A typical network with N inputs, M outputs, and H basis function.
With RBF networks, the meta-model of the objective function can be mathematically formulated as
where
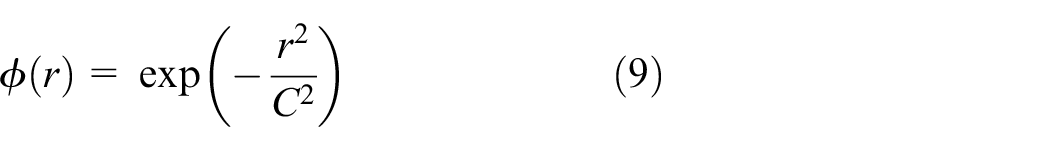
where
With the above-described function and parameter of RBF networks, the constructed RBF meta-models of the objectives have been depicted in Figure 7. It can be noticed that RBF meta-models pass through all sampling points, which is different from PRS meta-models.

RBF models for crashworthiness criteria.
Evaluating accuracy of meta-modeling
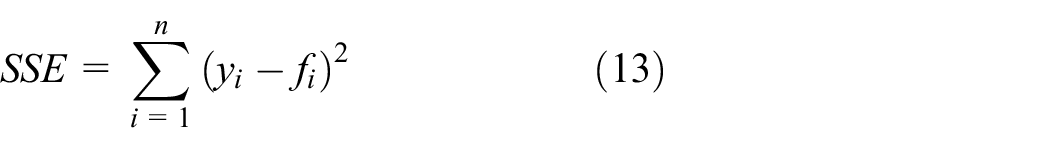
In order to evaluate the accuracy of the developed meta-models, RE between the FEA result
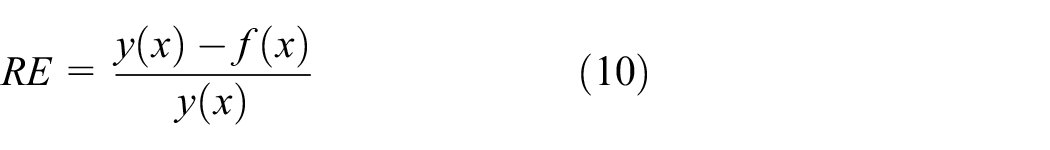
In addition, the accuracy of meta-models can also be evaluated using several statistical parameters:
24
the coefficient of multiple determinations


where

where
To access the accuracy of PRS meta-models, the above 32 design points have been adopted. But for RBF meta-models, evaluation on these design points may be meaningless since RBF meta-models pass through these design points themselves. Thus, another nine validation points have been selected and shown as the red hollow circles in Figure 7. With these validation points, the accuracy of RBF meta-models has been accessed, and the accuracy evaluation indicators have been listed in Table 4. It can be concluded from Table 4 that the PRS meta-models for SEA and the RBF meta-model for PCF and PCA have the higher accuracy to approximate the objective responses. The REs of these meta-models are less than 6%, which is acceptable in engineering design.
Accuracy evaluation indicators of the PRS models.

PCF: peak crush force; PCA: peak crush acceleration; SEA: specific energy absorption; PRS: polynomial response surface; RBF: radial basis function.
Multi-objective optimization
Most engineering and scientific problems are MOO problems, and these objectives may conflict with each other. Differing from the single-objective optimization problem, the optimal solutions for MOO problem consist of a set of solutions which are regarded equally good, called the Pareto front. To obtain Pareto front for MOO problem, many intelligent optimization algorithms like the genetic algorithm and sequential quadratic programming (SQP) algorithm have been developed and applied to engineering projects. 25 In this article, NSGA-II has been adopted to explore all the objectives independently and search for the Pareto optimal solutions.
MOO formulations
The design target of this study is to simultaneously maximize SEA and minimize PCF without increasing PCA too much. Thus, SEA and PCF have been adopted to represent the optimization objectives, and PCA has been formulated as the constraint. For PCA extracted from the driver’s seat floor point, it is required to be lower than a regulation level. 26 Then, the MOO problem has been given as follows

where
The main superiority of NSGA-II optimization from other genetic algorithms is that the individuals are layered on the basis of dominance relations before operating selection. 27 To keep the advantage of excellent individual and the population diversity, the fitness value of every individual of the generation is recalculated under the sharing principle

where

where
Optimization results and discussion
The MOO problem formulated above has been solved with the NSGA-II algorithm in code MATLAB R2012®, and the obtained Pareto front is plotted in Figure 8. It is clear from the Figure 8 that the Pareto front has a satisfactory distribution and convergence performance and can offer the engineers with a variety of optimal solutions for different design preferences. For example, design with a higher SEA can be achieved along with a higher PCF if the design emphasizes the energy absorption efficiency. As a reference, SPEA2 has also been utilized to search for the Pareto front of the MOO problem, which is shown in Figure 8. Compared with the Pareto front obtained by NSGA-II, SPEA2 has obtained a well-distributed but incomplete Pareto front set of designs. In addition, it takes 2.1 h for SPEA2 to reach the final result after 45 iterations, while the utilized NSGA-II ends in 1.6 h after 34 iterations. Considering all the facts, the proposed method using NSGA-II is accurate and effective, and the computational efficiency is considered to be high.
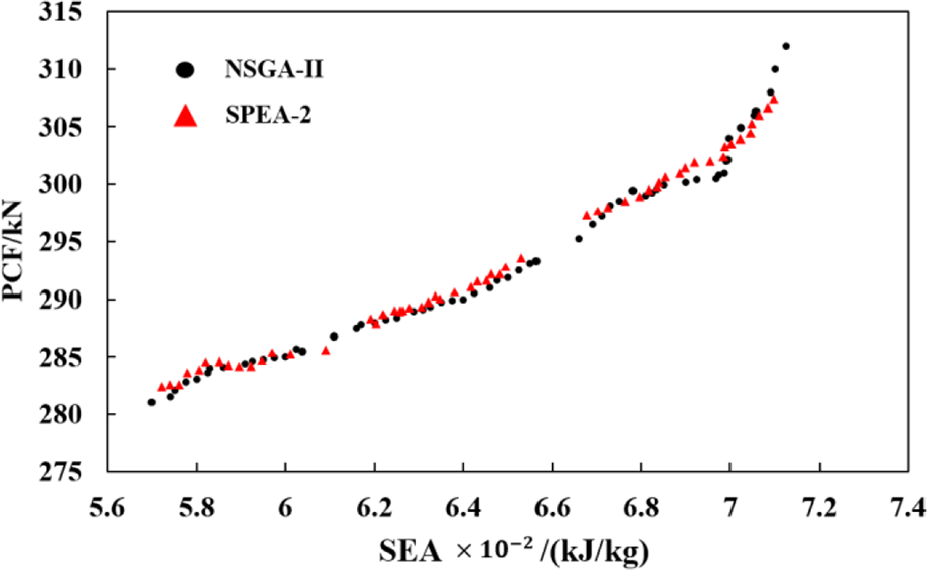
Pareto fronts obtained by using different algorithms.
In this study, to obtain a normalized optimal solution, a desirability function has been defined as

where
Comparison between original and optimal design on crashworthiness capacity.

PCF: peak crush force; PCA: peak crush acceleration; SEA: specific energy absorption.
Comparisons between calculated and simulated objective function values of optimal solution.

PCF: peak crush force; PCA: peak crush acceleration; SEA: specific energy absorption.
The original design is also listed in Table 5 for comparison. As can be seen from the table, for the optimized design, SEA value has increased by 11.15% and PCF value has decreased by 13.2%. Although the mass has increased by 3.65%, this increase is acceptable when comparing with other promotions of crash performance.
To further assess the improvement of the optimized design, the improved frame and frontal parts have been applied in the full-scale vehicle, and frontal crash simulation has been carried out with the improved vehicle. Figure 9 shows the deformation comparison between the original and the improved vehicle. The final elastic deformation of the improved vehicle is 335 mm, a 45 mm decrease compared with the original design. In addition, the energy absorption performance of the improved vehicle has also been improved, as shown in Table 7, along with the original design for comparison. It can be observed that the improved frame and frontal parts have absorbed about 42.4% of the total energy, which has increased by 8.7%. Less energy has been transmitted to the structures of passenger compartment, leading to a strengthened occupant protection.
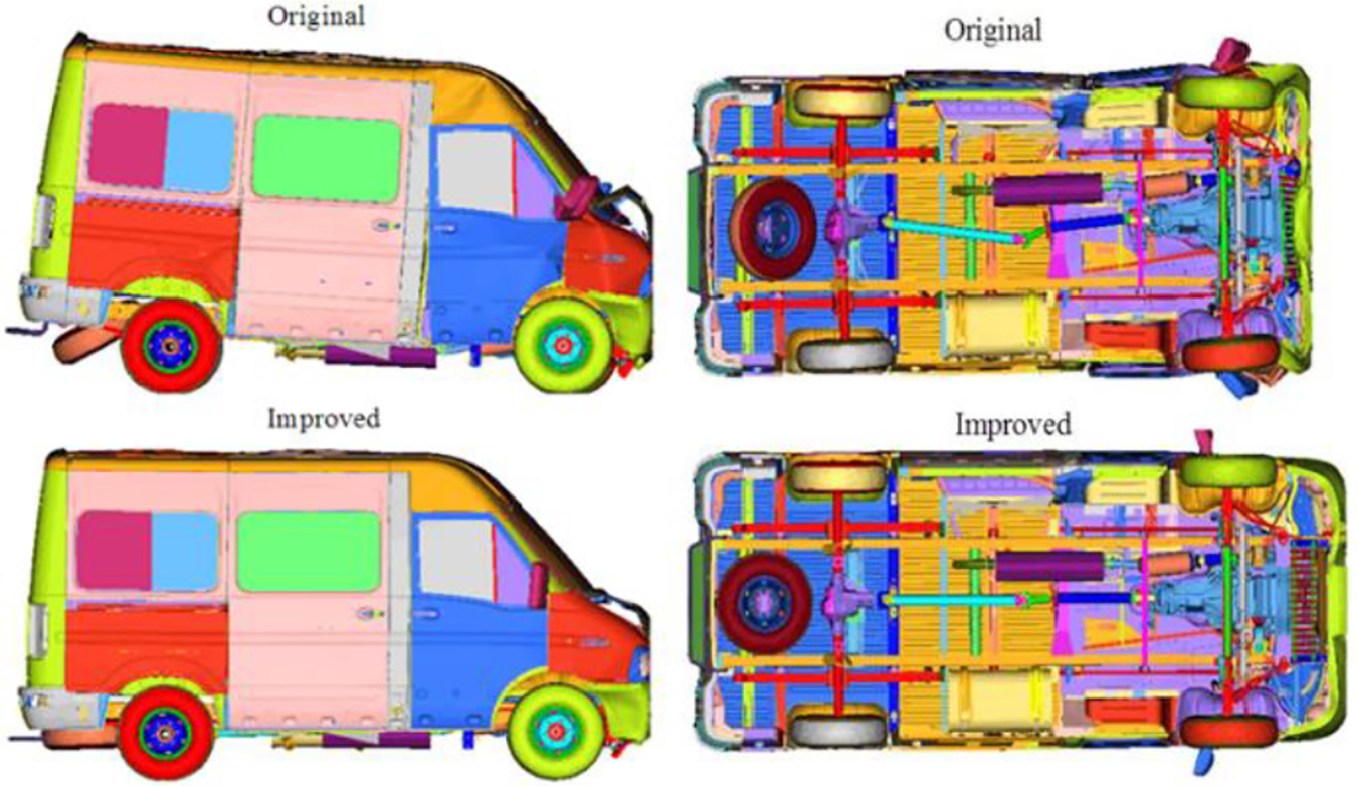
Deformation comparison before and after optimization.
Energy absorption comparison of the front frame parts.
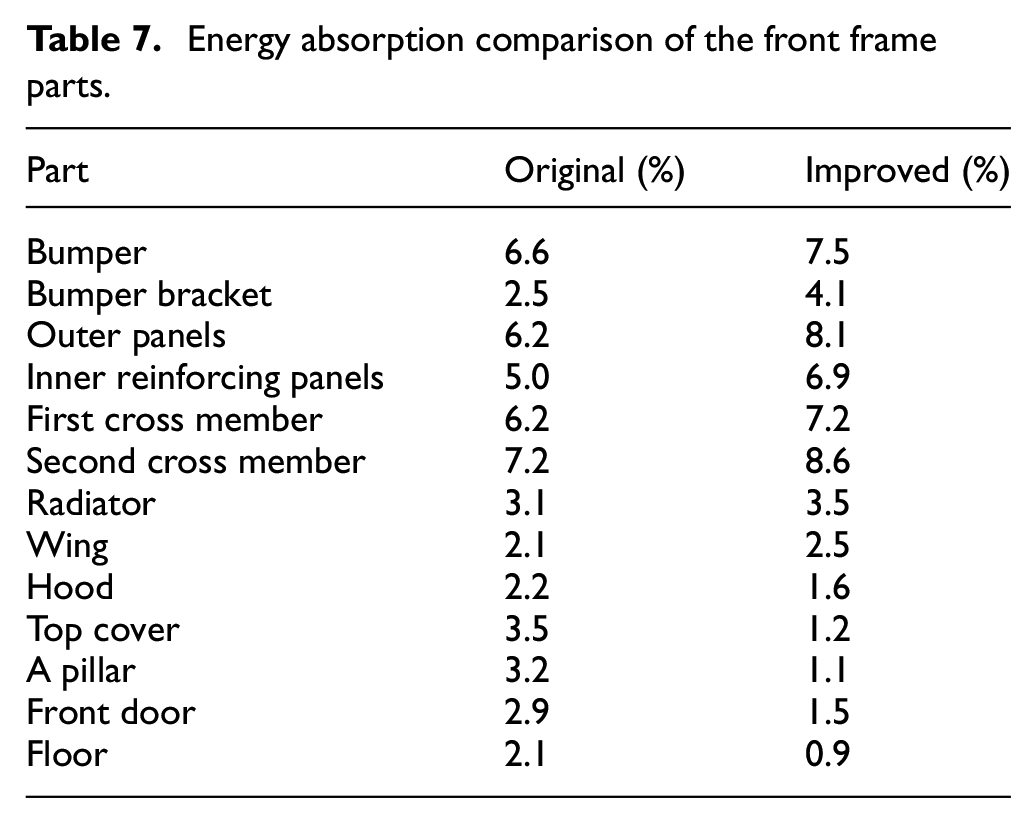
Table 8 compares the peak acceleration values of the B pillars between the original and the improved vehicle. As listed in Table 8, for the improved vehicle, the peak acceleration values of the left and right B pillars are 41g and 47g, which have been reduced by 18.0% and 15.3%, respectively, in comparison with the original ones. These values are acceptable for the further development of safety restraint system.
Peak acceleration values on B pillars.

Conclusion
This study proposes a meta-modeling-based method for structural optimization and explores the use of mixed meta-models to approximate a complex mechanical system. The method has been applied to the crashworthiness design of a commercial vehicle subjected to the frontal crash. The simulation results of the improved vehicle show an obvious improvement in crash performance, which validates the effectiveness of the proposed method.
A full-scale FE model of the commercial vehicle has been built for crash simulation. The simulation results prove to be in good agreement with that from crash test, which validates the FE model. To improve the crash performance of the vehicle, the vehicle frame and frontal parts have been separated to build a sub-model for crashworthiness design.
With the reduced dimensions of design space, the meta-models for crashworthiness responses (i.e. SEA, PCF, and PCA) have been built by using PRS and RBF, respectively. Concerning the global approximation accuracy, a mixed meta-model has then been built with the PRS meta-model for SEA and the RBF meta-models for PCF and PCA.
A NSGA-II algorithm has been adopted to search for the Pareto front of the mixed meta-model-based MOO problem. The obtained Pareto front has been discussed and validated with that obtained by SPEA2. The proposed method proves to provide a better non-dominated frontier with the less computation demand.
By defining a desirability function, a normalized optimal solution from the Pareto front set of designs has been determined and used for optimization design. The optimal solution has resulted in 11.15% increase in SEA and 13.2% decrease in PCF for the frame and has led to an obvious improvement in occupant protection and energy absorption for the whole vehicle. This successful case has validated the effectiveness of the proposed approach and can be a good guidance for the practical engineering optimization.
Footnotes
Acknowledgements
The author would like to acknowledge the support of Scientific Research and Industry Promotion Project of Jiangsu Provincial Education Department, China, under the grant number BY2014004-04.
Handling Editor: Shun-Peng Zhu
Declaration of conflicting interests
The author(s) declared no potential conflicts of interest with respect to the research, authorship, and/or publication of this article.
Funding
The author(s) received no financial support for the research, authorship, and/or publication of this article.