
Abstract
In order to improve crash safety, the body structure of a mini-bus is optimized in this study. One type of multi-objective optimization method is proposed in this article. The peak acceleration amax at the B pillar lower end and total mass m of the body in white were set as two objective functions. First, the sample points were generated by Latin hypercube sampling design. Second, based on the evaluation index of 40% frontal offset crash, an approximation model was established by the Kriging method. Then, particle swarm optimization was performed on the approximate models. Finally, the simulation calculation by LS-DYNA proved that the peak acceleration amax at the B pillar lower end was reduced by 18.6%, and the total mass m of body in white was reduced by 0.87%. Therefore, the crashworthiness of the mini-bus was improved greatly without increasing the total mass of the body in white, which means that the optimization results were meaningful.
Keywords
Introduction
In recent years, with the rapid development of the automotive market in China, the number of people owning cars has also risen rapidly in some economically underdeveloped areas. This market is mostly interested in cheap mini-buses, but their passenger capacity is relatively large. Once these buses are involved in traffic accidents, the consequences will become more serious. Thus, improving the crashworthiness of these mini-buses is vital for public safety. Passive safety analysis of the car by finite element method started in the 1960s. This area has achieved great improvements as the development of computer technology and experiment methods. Due to the promotion of domestic and international laws or regulations and the increase in a large number of crash experiments, the crashworthiness of cars has greatly improved. However, most of the current research is focused on traditional sedan structures, 1 and little attention has been paid to the mini-bus. As mini-buses have different structures and layout characteristics, it is worth investigating their crashworthiness design, especially in the case of poor structural performance.
In scientific research and engineering practice, in order to solve complex problems, mathematical models need to be established. However, in the practical application, because the mechanism of the problem is not fully understood or the research object is too complex, it is usually difficult to give an explicit mathematical expression and carry out optimization analysis.2,3 In this case, to determine the optimal solution, physical experiments or numerical simulation methods are often used to simulate the research subject.
In this article, based on the three-dimensional geometry model of a mini-bus body, a finite element model is built for crash analysis according to the frontal Offset Deformable Barrier (ODB) with 40% overlapping in C-NCAP management regulations. The sample points for the crashworthiness evaluation index are obtained by the Latin hypercube sampling (LHS) design, and the Kriging approximation model is used to fit the sample points to substitute the original finite element model. 4 The optimization design variables include the sheet thickness of 10 main energy absorbing components of the fore cabin, and the constraint conditions include the crash intrusion degree of the key positions. The objective functions are the peak acceleration amax at the B pillar’s lower end and the total mass m of the BIW. The multi-objective optimization is performed by particle swarm optimization (PSO). 5
Multi-objective optimization of crashworthiness
Optimization method
The sample points of the crashworthiness evaluation index are obtained by the test design method. Then, the Kriging approximation model is used to fit the sample points to substitute the original finite element model. The optimal design variables are the sheet thickness of the 10 main energy absorbing components (t1 − t10) in the fore cabin. The crash intrusion degree of key positions in the fore cabin is restrained, which include the intrusion of instrument panel D1, the steering column D2, and the clutch pedal D3, as shown in Figure 1.
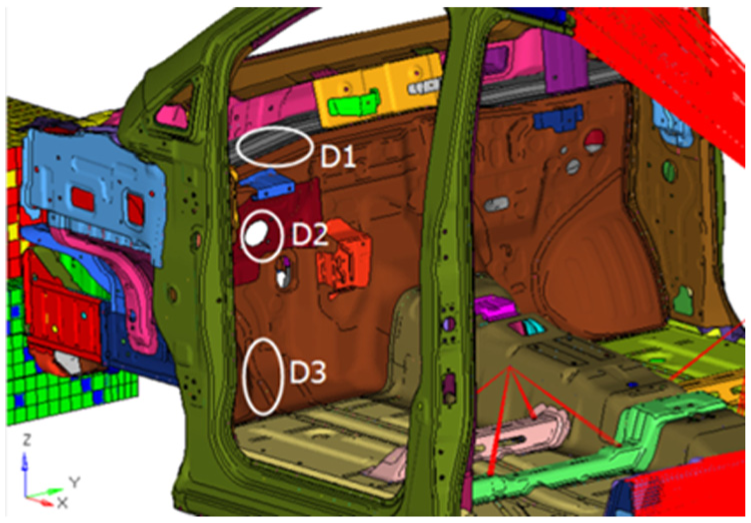
Diagram showing D1, D2, and D3.
The objective function is the peak acceleration amax at the B pillar’s lower end and the total mass m of the BIW, as the peak acceleration is an important index of measuring injury risk of passengers. At the same time, the lightweight requirements must also be considered to minimize the weight. The multi-objective optimization is performed by PSO. The detailed procedure of optimization method is shown in Figure 2.
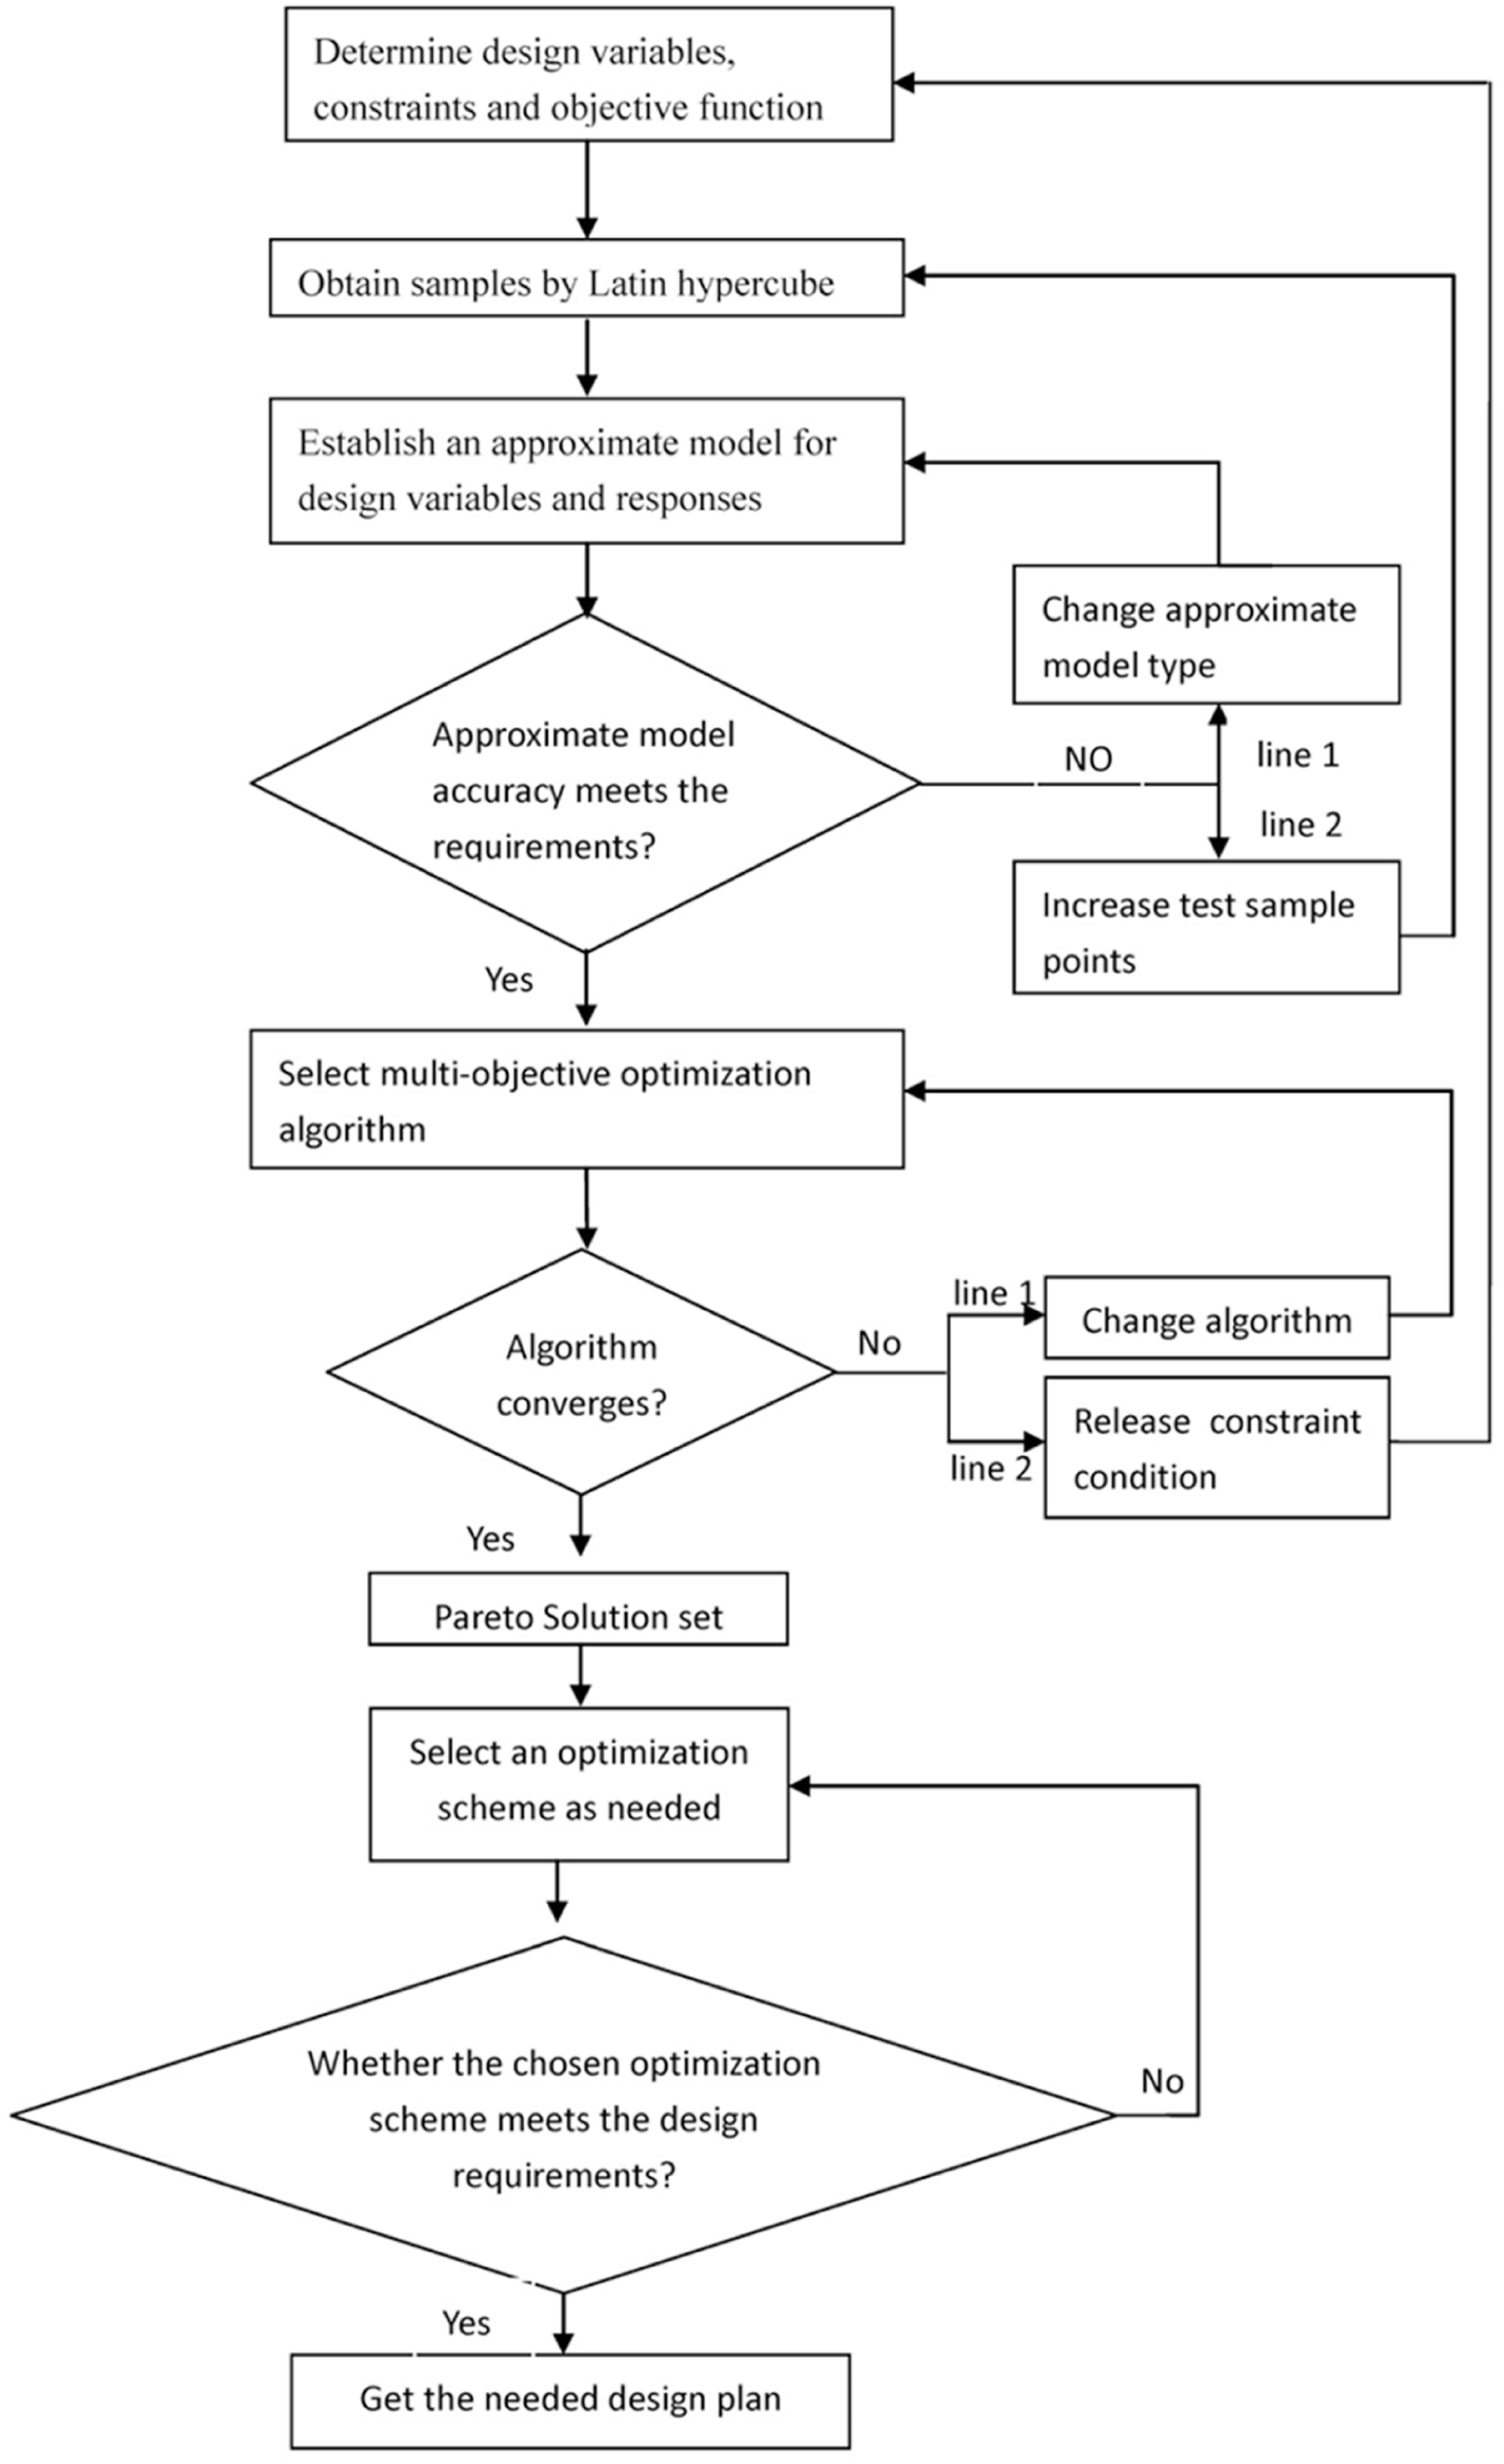
Flow chart of optimization method.
LHS design
LHS is utilized to generate sample points that are evenly distributed in design space. The characteristics of the entire design space can be reflected by some sample points, and the level numbers of each factor can be set arbitrarily as needed. This method has the advantages of high efficiency and good balance. As shown in Figure 3, for a test design study of two factors and nine levels, 81 points are needed in the full-factor test design method. However, only nine points are needed in the LHS design method. As shown in Figure 4, for a two-factor and nine-level test design study, the LHS design method can be used to study all the levels of the factors by the nine test samples, but orthogonal testing can only study the three levels of the factors.

Comparison of full-factor test design and LHS design: (a) Full-factor test design and (b) LHS design.

Comparison of orthogonal test design and LHS design: (a) Orthogonal test design and (b) LHS design.
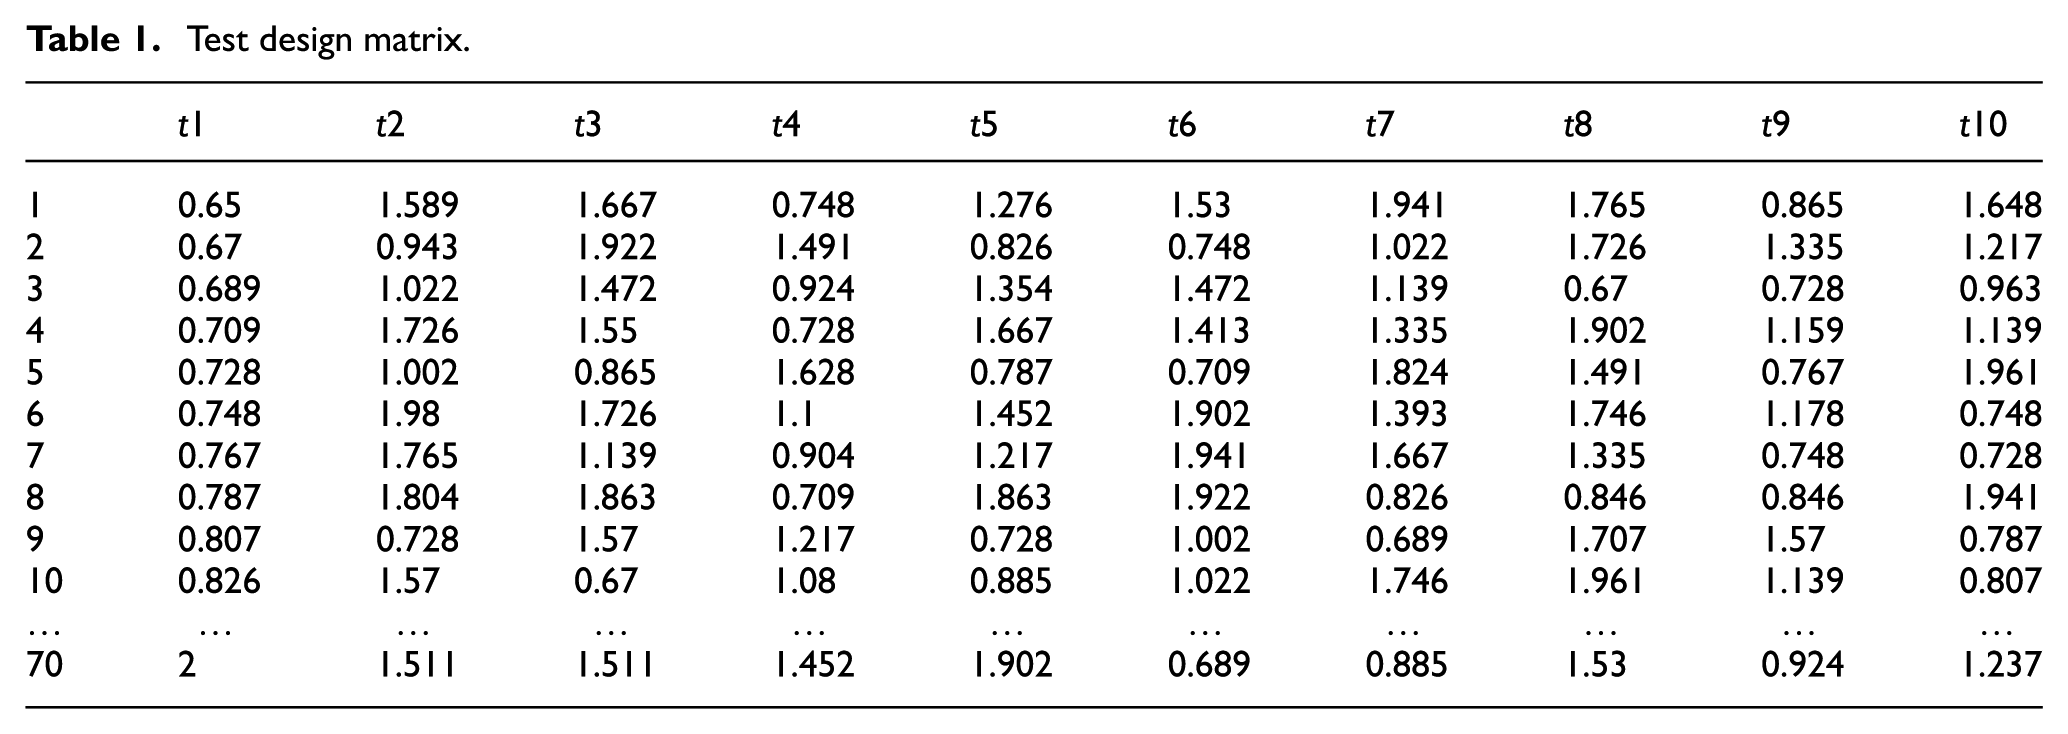
For the complex nonlinear problem of a crash, the LHS design method selecting the sample points can not only reduce test number but also improve the accuracy of the approximate model. Thus, the LHS design method is used to randomly select 70 sample points, and then a 10 × 70 test design matrix can be derived as shown in Table 1.
Test design matrix.
Kriging approximation model
An approximation model is a functional relationship between design variables and target responses by using mathematical approximations and interpolation. Therefore, a relatively simple mathematical relationship can be used to substitute complex engineering problems or the huge computational cost of simulation model. 6 Thus, the model can improve the efficiency of optimization. 7 Currently, approximate models used in actual engineering include the response surface approximation model (RSM), radial basis function neural network approximation model (RBF), and Kriging approximation model (Kriging)

where z(xi) is the measure value of the i position,
Compared with the other two approximation models, the Kriging approximation model has a better prediction outcome for highly nonlinear problems. 8 Meanwhile, the Kriging approximation model is composed of a regression model and a correlation model, and it has high fitting accuracy. The aforementioned 70 sample points are used to establish the Kriging approximation model for the design variables and response in ISIGHT software.
Accuracy evaluation of approximation model
The relative average absolute error (RAAE) and determination coefficient (R2) are usually used to estimate the accuracy of the approximation model. The mathematical expressions are as follows9,10

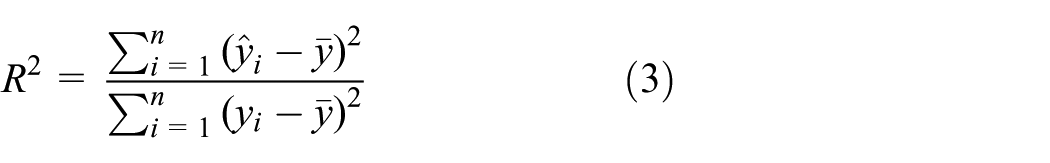
where n is the number of test samples, yi is the actual measure value of the responses,
The range of the RAAE and R2 is from 0 to 1. The value of the RAAE is close to 1 and the accuracy of the model is lower. However, the value of the R2 is close to 1 and the accuracy of the model is higher. In engineering analysis, the determination coefficient R2 of the approximation model is usually required to be at least 85%, and the RAAE should not be higher than 15%. 11
A total of 20 samples are chosen randomly from the 70 samples used to estimate the accuracy of Kriging approximation model in a 40% frontal offset crash. The error scatter plot of every response is shown in Figure 5, the RAAE of each response is shown in Table 2, and the R2 values are shown in Table 3.

Relative errors scatter of each response. (a) Relative errors scatter of instrument panel D1, (b) relative errors scatter of steering column D2, (c) relative errors scatter of clutch pedal D3, (d) relative errors scatter of amax, and (e) relative errors scatter of m.
RAAE of Kriging approximation model.

RAAE: The relative average absolute error.
R2 of Kriging approximation model.

From Tables 2 and 3, the response accuracy of 40% frontal offset crash Kriging approximation model meets all the requirements. It can substitute the finite element model for the subsequent optimal design.
Mathematical description of multi-objective optimization for 40% frontal offset crash
Finite element model
According to the three-dimensional model of the BIW, almost all parts of the BIW are modeled by quadrilateral shell elements. The total number of nodes in the finite element model is 451,820 and the total number of elements is 428,263, in which the triangular elements only account for 4.91% of the elements. Taking into account the computational efficiency, only the front part of BIW before B pillar is established in the detailed model. Because the rear part of the BIW shows almost no deformation in a crash, it can be simulated by mass points. The front seat passenger can be replaced by 77 kg weight mass points (refer to the quality of the Hybrid III 50th percentile male dummy in the C-NCAP) and the load is uniformly distributed at the seat mounting hole. The crash speed is 54 km/h and the crash time is 100 ms in the simulation calculation. 12 The relevant contact is set and it submitted to the LS-DYNA software for crash simulation as shown in Figure 6.
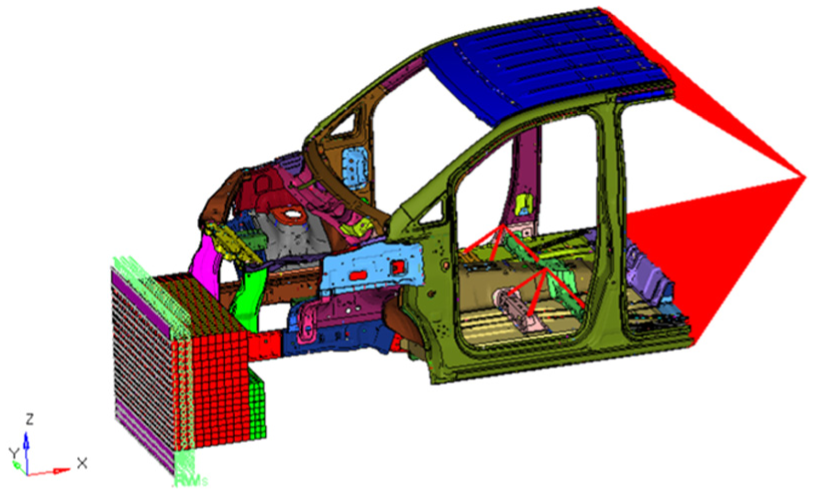
Finite element model.
The peak acceleration amax at the B pillar’s lower end, the total mass m of the BIW, and the intrusion degree of three key positions of the front passenger cabin were taken as the evaluation indices for the 40% frontal offset crash. The three key positions include the instrument panel D1, the steering column D2, and the clutch pedal D3, as shown in Table 4.
Forty percent frontal offset crashworthiness results.

Mathematical model of optimization

The peak acceleration amax at the B pillar’s lower end is an important indicator of the vehicle crashworthiness and it is set as the first objective function. The total mass m is a key indicator of the light weighting and it is set as the second objective function. Constraint conditions include the instrument panel D1, the steering column D2, and the clutch pedal D3. The design variables are the thickness t1, t2, …, t10 of the main thin-walled frame sheet as shown in Figure 7.

Distribution of design variables.
The design variables t1–t10 are set as a series of value according to actual thickness of the steel sheet commonly used in engineering. The allowable values for each variable are shown in Table 5.
Allowable values for design variables.

Fundamental principle of PSO
PSO was developed by Eberhart and Shi. 13 It is a computational method that optimizes a problem by trying to iteratively improve a candidate solution with regard to a given measure of quality. Compared with other optimization algorithms and evolutionary computation methods, PSO has the advantage of quick searching capability. 14 In computer science, PSO solves a problem by having a population of candidate solutions, here denoted “particles” and moving these particles around in the search-space according to simple mathematical formulae over the particle’s position and velocity.
Multi-objective optimization of 40% frontal offset crash
The Kriging approximation model is optimized by using the PSO multi-objective optimization algorithm. The maximum number of iterations is set as 200, the number of particles is set as 10, the inertia weight is set as 0.9, the global increment is set as 0.9, and the particle increment is set as 0.9. After 200 iterations, the non-inferior solution sets of optimal design are obtained. Figure 8 shows the optimization iterative process of each response. The red dots represent the non-feasible solutions that violate the constraint condition and the non-red dots represent the feasible solutions. The blue points represent the Pareto solution.
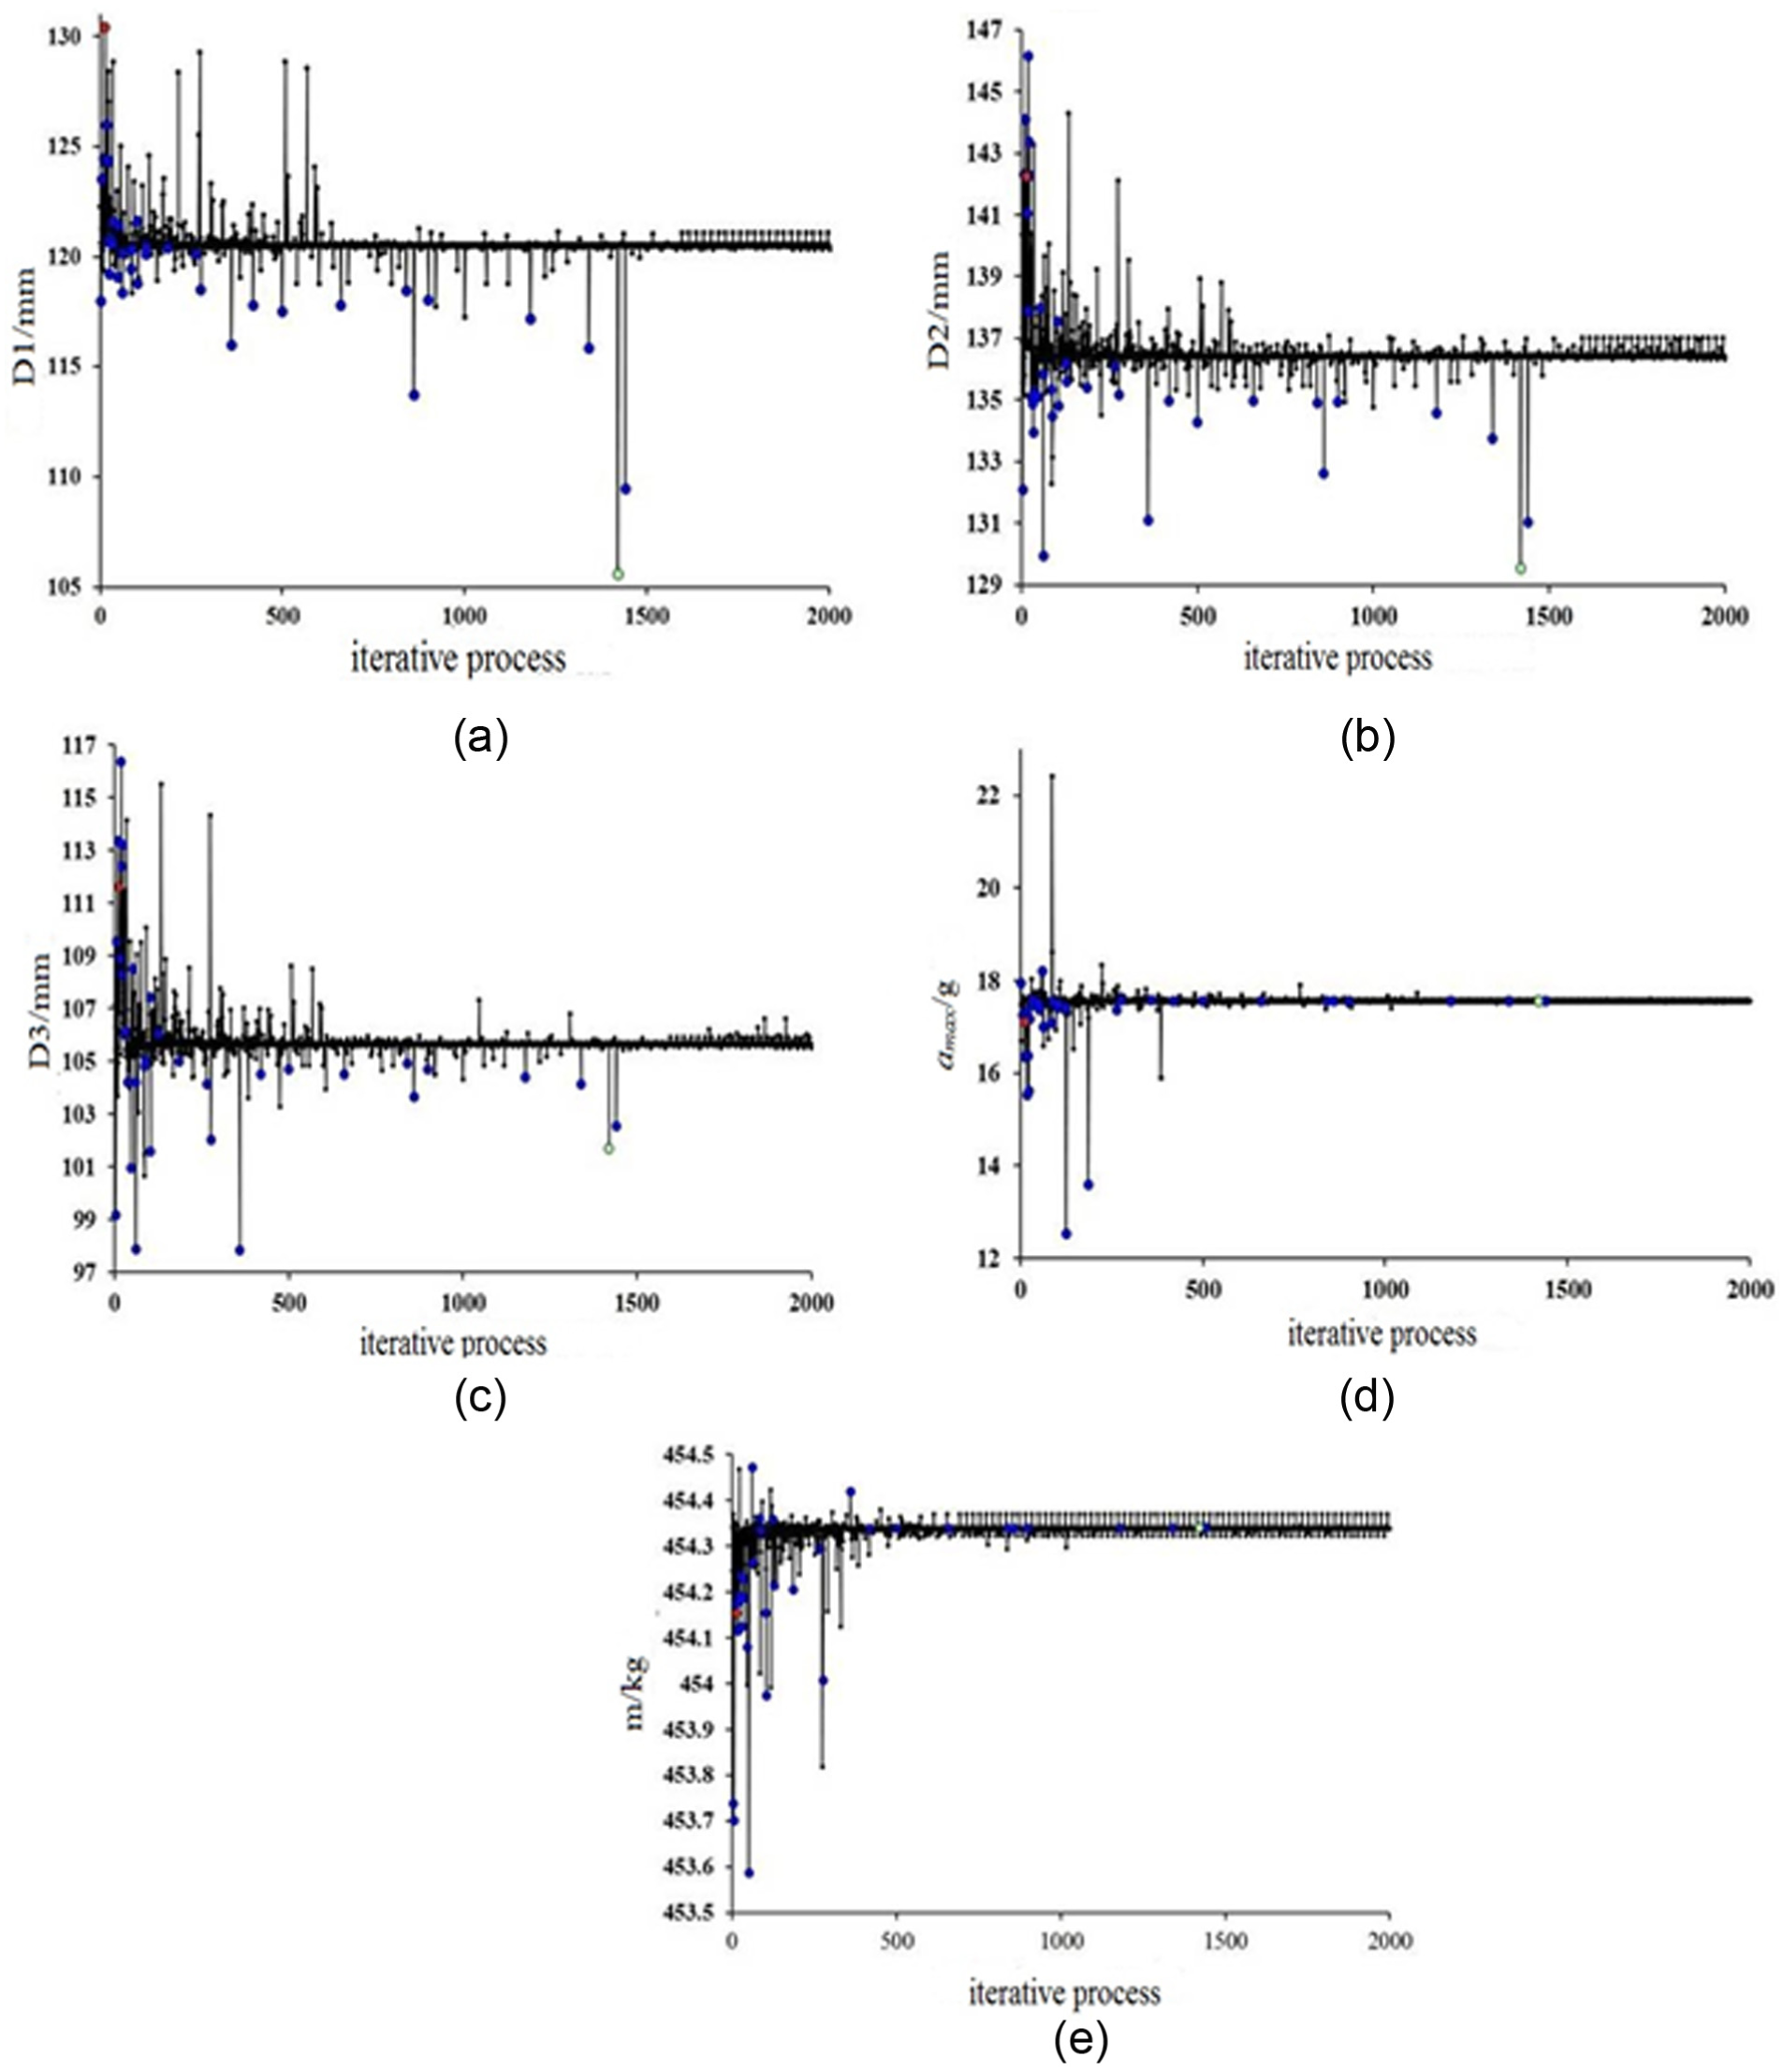
Optimization iterative process of each response. (a) Optimization iterative process of D1 intrusion, (b) optimization iterative process of D2 intrusion, (c) optimization iterative process of D3 intrusion, (d) optimization iterative process of amax, and (e) optimization iterative process of the total mass m.
Because the value of the design variables is not continuous, the Pareto solution in this optimization design is relatively scattered and the Pareto front is not obviously formed. However, as each discrete design variable corresponds with the sheet thickness, this optimization process has much more practical meaning. The Pareto solution set of D1, D2, D3, amax, and m is shown in Figure 9.
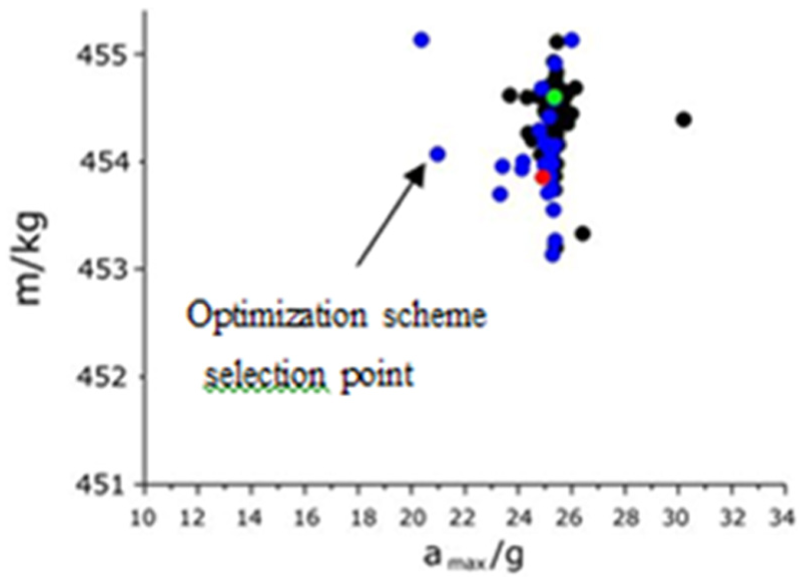
Pareto solution set.
In practical design, the values of amax and m are expected to be as small as possible. The arrow indicating points in Figure 9 is selected as the optimal solution according to the minimum distance selection method (MDSM) 15 and the practical engineering requirement, which reduces both amax and the weight. Table 6 shows the objective values of the optimal scheme (calculated by the approximation model) and the initial scheme (calculated by the finite element model).
Comparison of optimal scheme and initial scheme.

The optimization results show that the seven design variables decrease, while the other three sheet thicknesses increase. The intrusion degrees of two positions decrease and the other one increases. The objective functions of amax and m are both reduced as expected.
Verification of multi-objective optimization result for 40% frontal offset crash
Verification of fitting effect for approximate model
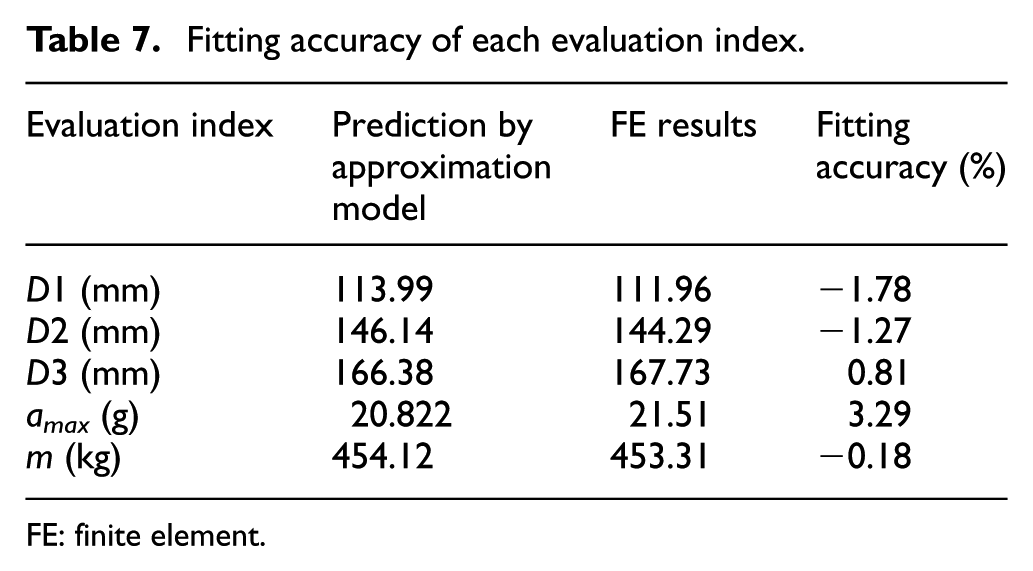
According to the optimized design variables, the sheet thickness of the original finite element model is adjusted, and then the evaluation indices are calculated by LS-DYNA. The results of the approximation model and the simulation results by finite element analysis are compared in Table 7.
Fitting accuracy of each evaluation index.
FE: finite element.
Table 7 shows that the fitting error for amax is <5%, and the error between the approximation model and the finite element results is small; these result are in line with expectations.
Verification of crashworthiness after optimization
Finite element simulation results before and after optimizations are compared. As shown in Figure 10, the peak acceleration amax at the B pillar’s lower end before the optimization is denoted by the red line and after the optimization is denoted by the blue dashed line.
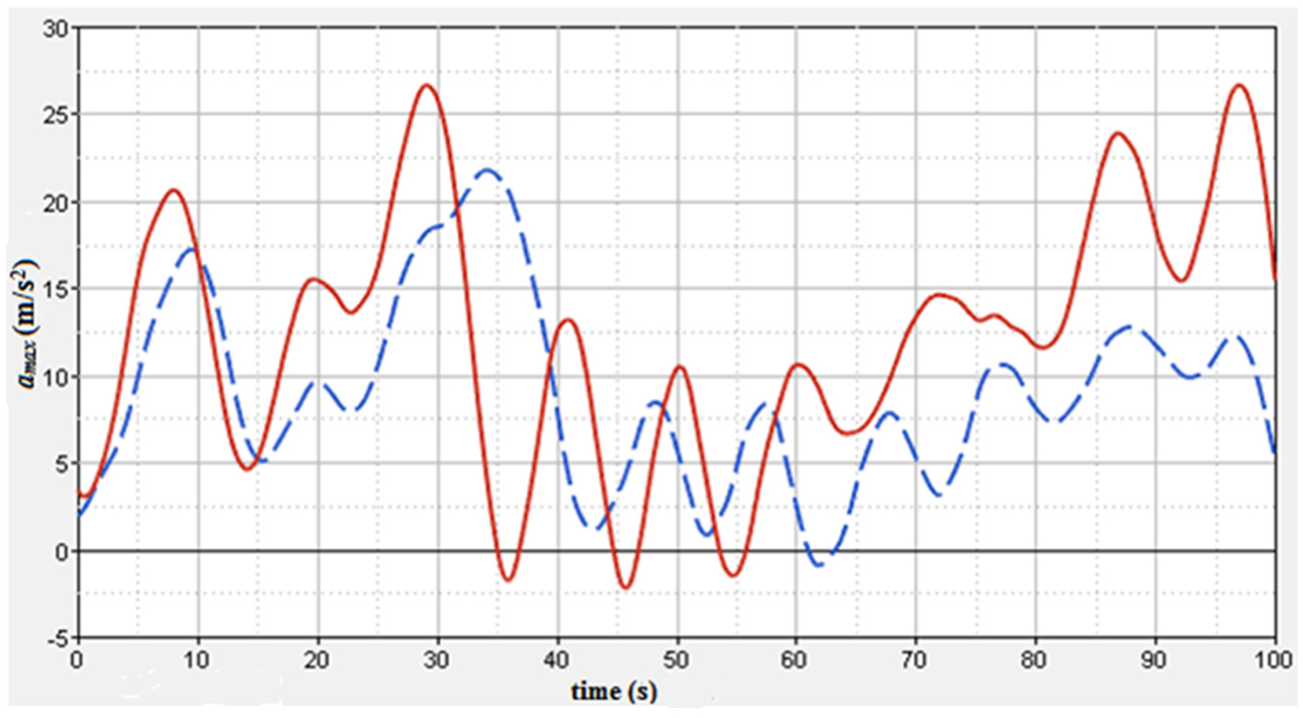
Before and after optimization curve of amax.
It can be seen that amax is reduced from 26.42 to 21.51 g after optimization. Meanwhile, the values of D1, D2, D3, and m are reduced, as shown in Table 8.
Improvements for each indicator.

As can be seen from the above table, the intrusion of key positions of the front cabin has been reduced compared with initial design. Intrusion of the steering column D2 and the clutch pedal D3 have been reduced significantly. After optimization, the total mass m of the BIW is also slightly reduced. The peak acceleration amax at the B pillar’s lower end shows a significant decrease. The results show that the approximation model is reasonable and optimization is effective.
Conclusion
Multi-objective optimization method of crashworthiness is presented in this article. A total of 70 sets of design points were used for a 40% frontal offset crash model using the LHS design method. The Kriging approximation model was used to establish the approximate model of objective functions with respect to the design variables. The optimal thickness parameters were obtained by the PSO algorithm. The following conclusions were determined:
The Kriging approximation model can be used to accurately establish the function relationship of objective functions with respect to the design variables. In this article, the error between the predicted value and the simulation result of the peak acceleration amax at the B pillar’s lower end and the total mass m were 3.29% and −0.18% separately.
After the optimization for the 40% frontal offset crash, the peak acceleration amax at the B pillar’s lower end decreased by 18.6%, the total mass m of the BIW is decreased by 0.87%, and the intrusion of the critical part of the passenger cabin also decreased. Thus, when controlling the increase of the total mass of the BIW, the crashworthiness can be improved.
The successful application of the optimization method proposed in this article can provide effective reference for the optimization of vehicle crashworthiness in the future.
Footnotes
Academic Editor: Yucheng Liu
Declaration of conflicting interests
The author(s) declared no potential conflicts of interest with respect to the research, authorship, and/or publication of this article.
Funding
The author(s) disclosed receipt of the following financial support for the research, authorship, and/or publication of this article: This project is supported by National Natural Science Foundation of China (Grant No. 51305269) and Shanghai Automotive Industry Science and Technology Development Foundation of China (Grant No. 1616).