
Abstract
Reliability analysis is a synthesis problem affected by both epistemic and aleatory uncertainties, due to the difficulties such as lack of statistical data and insufficient subjective information, which implies that the reliability analysis method has been seriously restricted in engineering applications. The reliability analysis results are expressed as evidence layer and probability layer here, and an analysis method based on hybrid evidence and probability is presented. First, the evidence layer of epistemic uncertainties has been constructed based on evidence theory. In the independence case of evidence variables, the joint basic probability assignment of the focal element is expressed as the product of all the evidence variables’ basic probability assignments involved; in the dependence case of evidence variables, the joint basic probability assignment of the focal element is derived through ellipsoid equation. Then, according to the limit state function characteristics, an analytic or numerical method is employed for the failure probability calculation, and the probability layer of aleatory uncertainty has been constructed. Finally, the probability calculation result with maximum credibility is chosen, and the corresponding focal element including the evidence variables is regarded as the design scheme. Numerical and engineering examples show the feasibility and effectiveness of the proposed method.
Introduction
In engineering, there are a lot of uncertainties in the design parameters such as the size parameters, manufacturing process, environment, load, and other parameters,1–3 including mechanical, electronic, and other fields. Meanwhile, the parameters such as product life and functional performance are also highly uncertain, and it is necessary to carry out the function reliability using a reasonable and feasible method. The uncertainties consist of aleatory and epistemic uncertainties in reliability analysis. 4 The aleatory uncertainty can be described by probability data, such as the environment random nature, inhomogeneity of the material, and variation in the space and the inherent change of the system characteristics. The epistemic uncertainty is rooted in incomplete knowledge to a certain degree, which is related to lack of system cognition, measurement uncertainty, inadequate test data, unobservable physical phenomena, and so on. Due to the lack of information, it is difficult to construct an accurate probability density function for epistemic uncertainty. So the epistemic uncertainty could be described through the non-probability method and data generally.
Combined with design, test, or experience data, a specific reliability analysis mathematical model is derived in accordance with the product function or logistic architecture involving aleatory and epistemic uncertainty; the probability with confidence level that a product performs a certain function will be revealed, by using probability or non-probability methods.5–8 However, there are also some difficulties in the reliability analysis problem, such as indefinite confidence level of the performance parameters’ threshold values, complexity of the design parameters’ uncertainty propagation characteristic, and failure physical process. Hence, whether the probability or non-probability analysis method is employed, there may be still some disadvantages in the reliability result, such as insufficient data utilization, inaccurate description of engineering problems and difficulty to reflect the real physical process of engineering problems. So the confidence level of the reliability analysis result is unknown or hard to judge yet. Due to the above limitations, the reliability analysis item is always difficult to integrate into the product design process effectively and has a limited effect for the design guiding. Therefore, to make the reliability analysis results more reasonable and credible, both aleatory and epistemic uncertainties should be taken into account in the general reliability analysis method. At the same time, it will also guide the data frame construction and data collection for engineering reliability analysis and provide technical support for the reasonable decision.
At the present stage, the structural reliability analysis is developing more comprehensive, thorough and specialized. The acceptance range of the analytical parameters is obtained by determining the parameter distribution through the probability reliability analysis method, and the accuracy and credibility of the analysis results depend on the sample size of probability data. Compared with the probability method, evidence theory has certain advantages in dealing with epistemic uncertainty, through the fusion of multi-source information and focusing on the consistency of information, as well as the exclusion and integration of contradictory information. The a priori data which evidence theory required are more intuitive, flexible,9,10 and easier to obtain. In addition, the data from different sources could be integrated by Dempster synthesis formula. 11 On the basis of the current data frame, we could get the conclusion which is accurate and reliable, and it provides a feasible way to quantify the credibility of certain decision. Smets et al. extended the Dempster–Shafer (D-S) evidence theory to any fuzzy subset in the frame of discernment (FD); the pignistic probability and transferable belief model (TBM) were also proposed by Dubois and Prade, 12 Smets 13 , and Smets and Kennes. 14 So the evidence theory has been used widely in the fields of expert system, information fusion, information analysis, and multi-attribute decision analysis, and provides application foundation to deal with the epistemic uncertainty on reliability analysis. This study shows that hybrid evidence and probability theory is an effective method for general epistemic and aleatory uncertainty.15–17
In the application on the reliability problem using the hybrid evidence and probability theory, based on the trust region management method and evidence theory, PR Adduri and RC Penmetsa 18 proposed a system reliability analysis for epistemic and aleatory mixed uncertain variables; Du 19 proposed a highly efficient reliability analysis method for the unified uncertainty analysis by the first-order reliability method (FORM-UUA); Mourelatos and Zhou 20 proposed an evidence-based design optimization (EBDO) method, which could search the neighbor region of the best point and determine the constraints; Jiang et al. 21 proposed a reliability analysis method based on evidence theory by introducing non-probability reliability index; Xiao et al. 22 proposed a unified uncertainty analysis (UUA) method based on the mean-value first-order Saddlepoint Approximation, denoted as MVFOSPA-UUA, to estimate the system probabilities of failure considering both epistemic and aleatory uncertainties simultaneously; Yao et al. 23 proposed an enhanced unified uncertainty analysis approach based on using general optimization solvers to search the most probable point (MPP) in the outer loop and then reformulate the double-loop optimization problem into an equivalent single-level optimization (SLO) problem; considering that uncertainty analysis is an integral part of reliability-based design, robust design, and design for Six Sigma in engineering applications, B Huang and Du et al. 24 proposed an efficient and accurate mean-value first-order Saddlepoint Approximation (MVFOSA) method; Tao et al. 25 proposed a reliability interval calculation method for the multi-objective system with aleatory uncertainty and epistemic uncertainty based on the sample point method. However, the above reliability analysis results are presented only in the form of probability reliability, and the relationship between the epistemic uncertainty and the credibility of reliability analysis results is also unknown; the confidence level of reliability analysis results is still difficult to acquire.
Considering that the reliability analysis result should consist of reliability and its corresponding confidence level, the traditional reliability analysis results are expressed as the evidence layer and probability layer in this article. In order to deal with the aleatory uncertainty and epistemic uncertainty in reliability analysis, the probability reliability analysis method and evidence theory are used to construct the probability layer and the evidence layer, respectively. First, the variables involved in reliability analysis are regarded as evidence variables, and the evidence space of epistemic uncertainties is constructed using evidence theory. Then, the variables are regarded as random variables in each focal element; reliability calculation is carried out in the probability space. In the independence case of evidence variables, the joint BPA of the focal element in the evidence layer is expressed as the product of the BPA of all the evidence variables involved; and in the dependence case of evidence variables, the joint BPA of the focal element in the evidence layer is derived through the ellipsoid equation of all the evidence variables. When the reliability calculation is carried out with evidence theory, the limit state function may be linear or non-linear, and the random variable distribution and the completeness degree of the characteristic parameters involved may be different. Therefore, considering that the limit state function is simple, the first-order second-moment method or eigenvalue method could be employed; considering that the limit state function is complicated and involves many parameters or different distributions, the numerical methods such as Monte-Carlo and response surface methods could be employed. And the probability layer has been constructed for the reliability analysis results based on aleatory uncertainty. Meanwhile, the maximum joint BPA of the probability calculation result is chosen as the final reliability analysis result, and the corresponding focal element including the evidence variables could be regarded as the design scheme. The confidence level of reliability analysis results can be determined using the proposed method. For further research, we will determine the influencing factors of the basic data frame in reliability analysis and also provide advice and direction for the follow-up design requirements, statistical data collection including operation information, and expert experience.
Basic conceptions of evidence theory
The main concept of evidence theory is that our knowledge on a given problem could be inherently imprecise, which was proposed by Dempster and Shafer. 26 Thus, an interval composed of the belief measure (Bel) and the plausibility measure (Pl) is employed to characterize the system response uncertainty.
For evidence theory, a set of mutually exclusive elementary propositions is defined called FD, which can be viewed as a finite sample space in probability theory. For instance,
27
if FD is given as X = {x1, x2}, then we will have two mutually exclusive elementary propositions x1 and x2. All the possible subset propositions of X will form a power set
For the evidence theory, the basic probability assignment (BPA) represents the degree of belief for a proposition. The BPA is assigned through a mapping function m: 2 X → [0,1], which should satisfy the following three axioms


where m(A) is the mass function, refers to the BPA corresponding to the event A, and it characterizes the amount of “likelihood” that can be assigned to A but to no proper subset of A.
Because the available evidence may come from some different sources, such bodies of evidence can be aggregated using existing rules of combination. Dempster synthesis rule is the most comprehensive rule for evidence combination, and for two BPAs m1 and m2 the combined evidence can be calculated as follows 26

where

with K representing the total conflict degree between the two independent sources; hence, Dempster synthesis rule is generally appropriate for evidence with relatively small amounts of conflict. When there is severe or total contradiction among the evidence from different sources, some modified versions of Dempster synthesis rule can be considered.28,29
For lack of information, generally it cannot provide a deterministic value for a proposition A as in the probability theory, but only an interval [Bel(A), Pl(A)]. The lower bound 0 ≤ Bel(A) ≤ 1 and the upper bound 0 ≤ Pl(A) ≤ 1 are called the belief measure and the plausibility measure, respectively, and are defined as follows

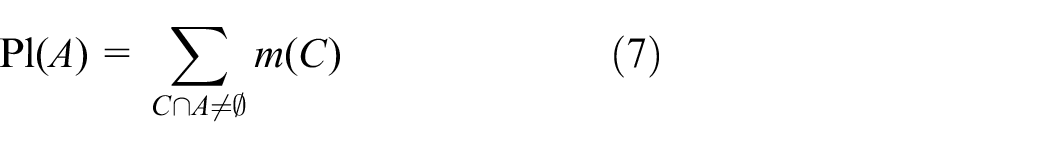
where Bel(A) is the summary of all the BPAs of propositions that totally agree with the proposition A and Pl(A) is the summary of all the BPAs of propositions that agree with the proposition A totally or partially. The properties of Bel(A) and Pl(A) are as follows


where A1 and A2 are two different propositions.
Reliability analysis method based on hybrid evidence and probability theory
In this article, the traditional reliability analysis results are expressed as {1 – α, 1 – p,
Probability reliability analysis method based on statistical data
The mechanical components’ failure modes are mainly failure of strength, stiffness, and stability. At present, the basic data of mechanical properties, environment, design conditions, and other aspects of the reliability design and analysis are nearly complete. There are several research methods based on probability statistics and analysis methods to ensure structural safety, such as static strength analysis, fatigue life analysis, and damage tolerance/durability analysis, and can provide the analysis results with confidence level. For example, for the static strength reliability analysis, the A basic value or B basic value obtained from the test with 95% confidence level is regarded as the material strength data generally, so the static strength reliability analysis results are also with the identical confidence level; similarly, the life results of fatigue durability analysis are with 95% confidence level and 95% reliability generally. It means that the analysis results of the structure static strength, fatigue, and durability are with both confidence level and reliability.
In engineering, the product reliability analysis is presented to the performance parameters, such as life, strength, and other parameters, of which confidence level could be derived from the sample size and distribution characteristics. Considering certain variable Y as lognormally distributed, the probability density function is given as follows

Under the confidence level 1 – α and the reliability 1 – p, the analysis process is as follows:
Assuming that the test sample number is n, the logarithmic mean of the test parameters is

where

where
Through the above derivation, the confidence level of the analysis results is 1 – α, the reliability is 1 – p, and the design scheme
Reliability analysis using hybrid evidence and probability theory
Theory model
The limit state function composed of multiple evidence variables and its reliable domain are defined as follows

The involved evidence variables are
If there are multiple sources of information for each evidence variable, we can use the Dempster synthesis rule to get the marginal BPA of each evidence variable. The new focal element is generated from the combination of all the evidence variables according to the limit state equation, which can be defined as the Cartesian product D generated by evidence variables
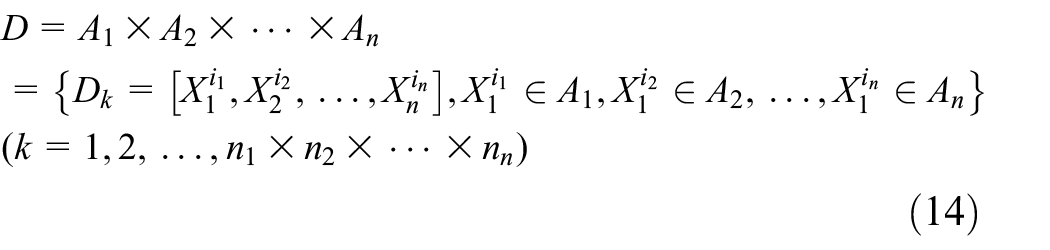
That is,
In the focal element dk, Xij can be regarded as the random variable, the distribution form and the characteristic parameter of which are known. The uncertainty propagation and reliability calculation of the random variables in the above functions can be described in terms of probability density function, and the failure probability calculation is as follows

where

The failure probability or reliability can be solved according to the distribution characteristics of random variables and the limit state equation. At present, the reliability calculation method of mechanical components is relatively perfect. When the reliability calculation is carried out with evidence theory, the limit state function may be linear or non-linear, the random variable distribution and its characteristic parameters may be unknown. Therefore, it should be combined with a different reliability method to solve the calculation difficulty; in the case that the limit state function is simple or linear, the first-order second-moment method or eigenvalue method could be employed; in the case that the limit state function is strongly non-linear and involves many parameters or different distributions, the numerical methods such as Monte-Carlo and response surface methods could be employed.
In summary, for the reliability analysis result {1 – α, 1 – p,
The joint BPA in the case that the evidence variables are independent of each other
In the case that the evidence variables are independent of each other, the joint BPA of multiple evidence variables is the product of the BPA of each independent evidence variable, as shown in the following

where
The joint BPA in the case that the evidence variables are dependent on each other
The ellipsoidal model is originally proposed for non-probability uncertainty analysis, on the assumption that the variation of the uncertain parameters falls into a multidimensional ellipsoid.30,31 This ellipsoid should faithfully describe the actual correlation between the parameters. Theoretically, it is possible to create such an ellipsoid for the uncertainty domain if one has sufficient knowledge on the relationship between the parameters. However, due to the complexity of the dependence in high-dimensional problems, this ellipsoid in many cases has to be obtained from the experimental samples.
When the evidence variables are dependent, the ellipsoid model is used to solve the joint BPA of the evidence variables in the limit state equation. Let
1. Construction of the ellipsoid model
The ellipsoid model is employed to deal with the dependent evidence variables in this article. Therefore, a multidimensional ellipsoid is constructed through the n-dimensional interdependent evidence variables falling into a joint FD

where the ellipsoid center XC is deduced through the marginal FDs

where

where S is a normalization factor to make the total BPAs of md equal to 1.0, which is given by

2. Covariance matrix constructed through correlation coefficient and variance
The covariance of two arbitrary evidence variables Xi and Xj is
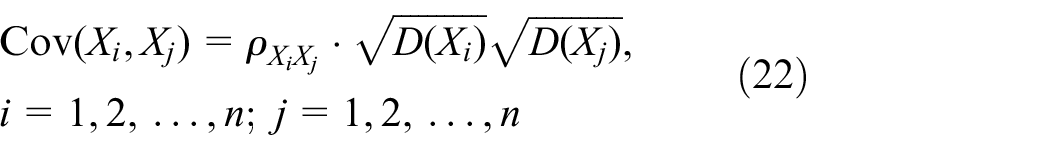

where
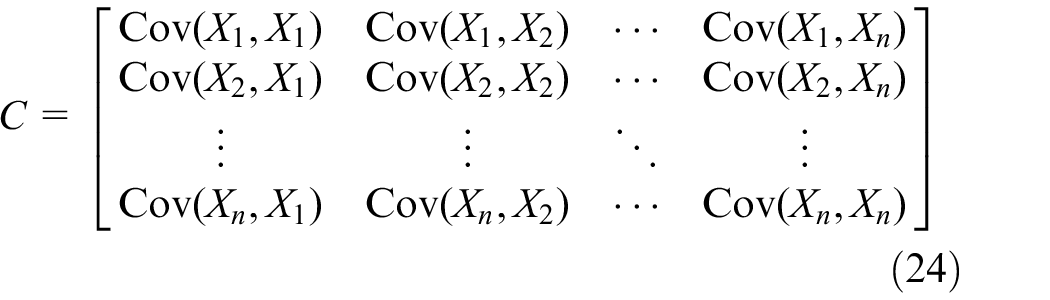
3. The ellipsoid equation is constructed through the covariance matrix

4. Through the above three steps, the n-dimensional evidence variable region is converted to the n-dimensional ellipsoid region, and the vertex of each focal element in the cube is substituted into the ellipsoid equation. And if the result is less than or equal to 1, it represents that the vertex is inside the ellipsoid; if the result is greater than 1, it represents that the vertex is outside the ellipsoid.
5. The sum of all initial joint BPAs of all focal elements, the vertex of which is outside the ellipsoid, is b, and let the new joint BPA of these focal elements be 0. The formula for the joint BPAe of the remaining focal elements is

where
Mechanical products’ uncertainty sources and FD
Parametric uncertainties are influenced by several factors including design requirements, load cases, and environment, the main parameters or failure modes of mechanical parts can generally be determined by the design requirements, the operation information, experimental data, related literature, expert experience, and other information. The determination process is a typical fusion of multi-source uncertain information. The uncertainty mainly includes the mechanical parts’ configuration, size, load, material properties, and other parameters; meanwhile, their distribution form, characteristic parameters, correlation degree, and the correlations between parameters have an important influence on the uncertainty propagation analysis and reliability analysis model; the correlation coefficient should be determined by statistical analysis method.
In the actual situation, design parameter uncertainty propagation analysis should be analyzed according to discipline characteristics or physics principle, in which there are many difficulties, such as huge difference of product, involving many subjects and related parameters, lack of parameter uncertainty information, indefinite or complicated state function, and so on. Under the condition that the architecture and fault mechanism of mechanical parts are clear, combined with completed uncertainty data, the reliability result with a high confidence level could be obtained using the reliability model based on the generalized stress–strength interference theory. The main sources of mechanical parts’ uncertainty information include the following:
Operation information;
Expert experience;
Design requirements;
Test data;
Historical data;
Similar product data.
Considering the uncertainty sources, the mechanical products’ uncertainty data fusion FD is constructed, each information source has different levels, and the data categories, concept, and BPA included at each level are also different, for example, different experts, multiple operation information, and so on. According to the failure mechanism and failure mode of mechanical products, the useful information contained in these data and information should be screened, the conflicting and contradictory data can be excluded using evidence theory, and the credibility of the mutually verified data is merged. In the fusion process, if one evidence is more important than all the other evidences, then the evidence should be allocated more credibility when the conflict part is redistributed.
Examples and discussion
Numerical example
A limit state function g = R – H – L is settled, and in the evidence variable level, the focal elements of R, H, and L are assigned different BPAs. The corresponding variable in each focal element can be described through a random variable subject to a certain probability distribution.
Marginal BPA of each evidence variable
The evidence variable R has two focal elements: the first focal element of R is R1 with mean
The focal element and marginal BPA of the evidence variable R.

BPA: basic probability assignment.
Similarly, the focal element and the marginal BPA of the evidence variable H are listed in Table 2.
The focal element and marginal BPA of the evidence variable H.

BPA: basic probability assignment.
Similarly, the focal element and marginal BPA of the evidence variable L are listed in Table 3.
The focal element and marginal BPA of the evidence variable L.
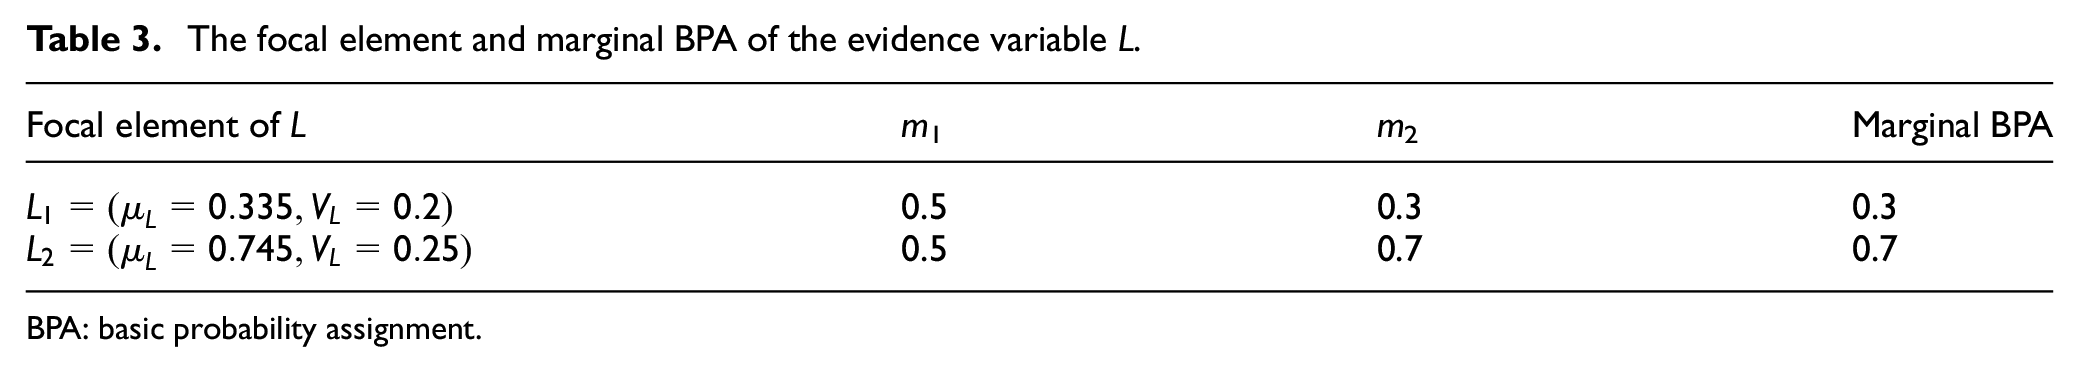
BPA: basic probability assignment.
R, H, and L are random variables with normal distribution in each focal element. According to the two cases that evidence variables are independent and dependent, there are two kinds of calculation results.
Reliability analysis under the independent evidence variables case
In the evidence space, [R, H, L] is a three-dimensional (3D) evidence variable, R has twotwofocal elements, H has three focal elements, and L has two focal elements. According to the limit state equation, 12 new focal element combinations D can be generated by making the arbitrary combination of the focal elements of each evidence variable, and the confidence level of the 12 new focal element combinations can be described by means of joint BPA. If the evidence variables R, H, and L are independent of each other, the joint BPA of multivariate variables is the product of the marginal BPA of focal elements of the involved evidence variable. In this numerical example, the random variables in each focal element are normally distributed and the limit state function is linear, so the FORM-UUA method is applied in the reliability calculation. The specific calculated results are listed in Table 4.
Reliability analysis results of independent evidence variables.

BPA: basic probability assignment.
So we obtain 12 reliability analysis results with credibility. According to the maximum credibility principle, we can choose [m = 0.412, Pf = 9.816E–01] as the final analysis results. At this time, the corresponding focal element is d132 = [R1, H3, L2].
Reliability analysis under the dependent evidence variables case
Considering the dependent variables case, the covariance matrix of [R, H, L] is set as
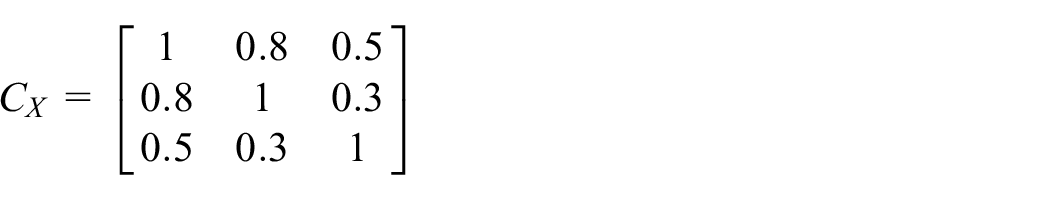
In the dependent evidence variables case, the ellipsoid model is constructed to calculate the joint BPA. Among the calculation results, the ellipsoidal equation value of the focal element d132 = [R1, H3, L2] is greater than 1, the assigned probability of which must be deducted, and the joint BPA of the other focal elements should be redistributed. Then, for each focal element, considering the correlation coefficient of random variables, the eigenvalue method of structural reliability analysis is used to calculate the failure probability. The reliability analysis results under the dependent evidence variables case are listed in Table 5.
Reliability analysis results under the dependent evidence variables case.

BPA: basic probability assignment.
Due to the correlated relationship between the evidence variables, the focal element with maximum confidence level in the independent evidence variables case did not fall into the ellipsoid region. So we obtain 11 reliability analysis results with confidence level. According to the maximum confidence level principle, we should choose [m = 0.301, Pf = 8.355E–01] as the final analysis results. At this time, the corresponding focal element is d131 = [R1, H3, L1].
Furthermore, the calculation results from the proposed method, Monte-Carlo simulation (MCS) method, and the FORM-UUA method are listed in Table 6. It can be seen that although the computational efficiency of FORM-UUA is slightly higher, the focal element of maximum credibility is wrong. The results obtained by the proposed method are approximately consistent with the results obtained by the MCS method, and the corresponding error of joint BPA is −2.59%; the corresponding failure probabilities of the focal element is solved by the eigenvalue method, and the results are the same, that is, 8.355E–01. In terms of efficiency, the times of ellipsoid equation calling required by the MCS method is 2.2 × 10³. The times of ellipsoid equation calling required by the proposed method is 96, and the calculation efficiency may be acceptable.
The numerical example calculation results using different methods.

BPA: basic probability assignment; MCS: Monte-Carlo simulation; FORM-UUA: unified uncertainty analysis by the first-order reliability method.
Engineering applications
Problem description
The mission door on certain type aircraft is locked by a lock rod at the rear of the fuselage, and the principle of the operation mechanism is shown in Figure 1; when the door is needed to be opened, the lock rod will be pulled out from the lock rod groove by the push rod under the explosive force generated by the explosive device, then the mission door will be opened. During flight, the door cannot be accidentally opened, the door is safe when the locking distance of the lock rod is greater than the safety locking distance; the door will be locking failure when the locking distance of the lock rod is less than the safety locking distance. The locking function of the mission door is affected by the mechanism size accuracy, stochastic vibration excitation during aircraft flight, safety locking distance, and so on. Therefore, the limit state function of locking reliability analysis is constructed as follows

when

Schematic diagram of the operation mechanism of mission door on certain type aircraft.
Calculation process
The rod locking distance L with tolerances
In the reliability analysis model based on hybrid evidence and probability data, the actual locking distance L of the door rod is a mechanism design parameter and could be accurately determined, the uncertainty of which is only affected by component size tolerances. In the evidence space, there is one focal element for L, and the random variable in the focal element can be described by the normal probability density function. The specific value is listed in Table 7.
The hybrid description of the actual lock distance L of the lock rod based on evidence and probability data.

The lock rod displacement response S under stochastic vibration
The influence factors on lock rod displacement.
The lock rod displacement response S under stochastic vibration during flight could be determined by the equivalent mass me of the vibration system, the system equivalent stiffness K, and the stochastic vibration excitation P. Where, equivalent mass me and equivalent stiffness K are deterministic variables, and the uncertainty of stochastic vibration excitation is so great such that it is difficult to determine accurately. In this case, the sources for stochastic vibration excitation P are mainly similar aircraft and related load standards, that is, there are two focal elements in the evidence space of P, and the credibility is assigned for the two focal elements by two experts, respectively. The power spectral density and the corresponding BPA distribution of stochastic vibration excitation in each focal element are listed in Table 8.
The evidence description for the stochastic vibration excitation of the lock rod.

There are three characteristics in the lock rod–spring system of the door as follows.
The lock rod–spring system is a linear vibration system of single degree of freedom;
The stochastic vibration excitation can be regarded as a stationary stochastic process;
The system characteristics are that the excitation is of zero mean, the effective response is zero, and both of them are normally distributed.
Therefore, the finite element model of the lock rod–spring system under the stochastic vibration excitation is established to derive the lock rod displacement. The stochastic vibration excitation of the door lock rod is a stationary stochastic process with zero mean, so the displacement response mean of the lock rod is also zero. The output of the finite element model is mainly the standard deviation of the displacement S under stochastic vibration.
Stochastic vibration finite element model.
The stop in the right end of the spring and the push rod in the left end of the lock rod are simplified into a mass block, respectively;
The lock rod is simplified into a mass block the same as push rod, the left end of the spring is connected with the lock rod, and the right end is connected with the stop.
As a result, the equivalent mass of the lock rod–spring system is me = 0.395 kg, the equivalent stiffness K = 1.79 N/mm, and the spring compression H0 = 28.4 mm.
Boundary conditions and loads.
The displacement values of the stop at the right end of the spring and the left end of the lock rod are 0;
The lock rod and spring are allowed only X-direction displacement;
The acceleration power spectral density of the X-direction is applied to the whole model, and the frequency range is 15–2000 Hz.
The stochastic vibration equivalent model of the lock rod is shown in Figure 2.
Calculation result

The stochastic vibration equivalent model of lock mechanism on the mission door.
The power spectral density values corresponding to two focal elements are applied to the above equivalent model. The hybrid description based on the evidence variable and probability density of the displacement response of the door lock rod under random vibration can be obtained. The results are listed in Table 9.
The hybrid description based on the evidence and probability of the displacement response S of the lock rod under random vibration.

Minimum safe locking distance L0 of the lock rod
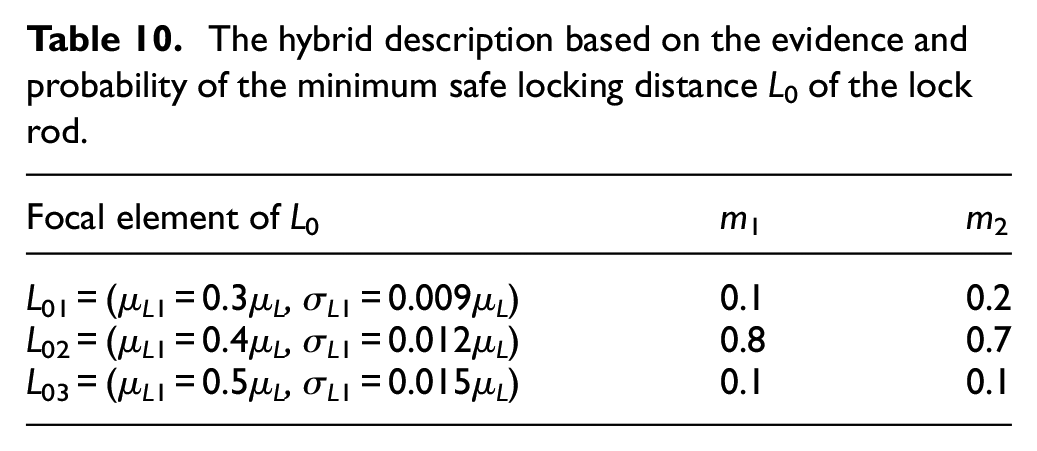
In the actual operation process, the main sources of the minimum safe locking distance L0 of the lock rod are designers, test operators, users, and so on. Therefore, L0 could also be described by the hybrid expression based on the evidence and probability. That is, in the evidence space, the designer, test operator, and user all have one focal element, and each focal element has two credibility allocation schemes. In each element, L0 can be regarded as a random variable described by the normal probability density function. The specific values of each focal element and the credibility assignment results are listed in Table 10.
The hybrid description based on the evidence and probability of the minimum safe locking distance L0 of the lock rod.
The marginal BPA of each evidence variable derived by means of evidence fusion
In the evidence space, [L, S, L0] is a 3D evidence variable, where L has one focal element, S has two focal elements, and L0 has three focal elements; the marginal BPA of each evidence variable is listed in Table 11. Furthermore, the Cartesian product generated by the above evidence variables consists of six new focal element combinations D, the credibility of which should be described by joint BPA.
The marginal BPA of each evidence variable.

BPA: basic probability assignment.
Reliability analysis when evidence variables are dependent on each other
Considering that the evidence variables are dependent on each other, the covariance matrix of [L, S, L0] is

When the evidence variables are dependent on each other, an ellipsoid model is constructed to calculate the ellipsoid equation of each focal element of [L, S, L0], and the results are listed in Table 12. The ellipsoidal equation values of the focal elements d111, d113, d121, and d123 are greater than 1, the assigned BPAs of which must be deducted, and the joint BPA of the other focal elements d112 and d122 should be redistributed. Furthermore, for each focal element, considering the correlation coefficient of random variables, the eigenvalue method of structural reliability analysis is used to calculate the failure probability. The reliability analysis results under the dependent evidence variables case are listed in Table 13.
The ellipsoidal equation values of each focal element and the joint BPA under the independent evidence variable case.
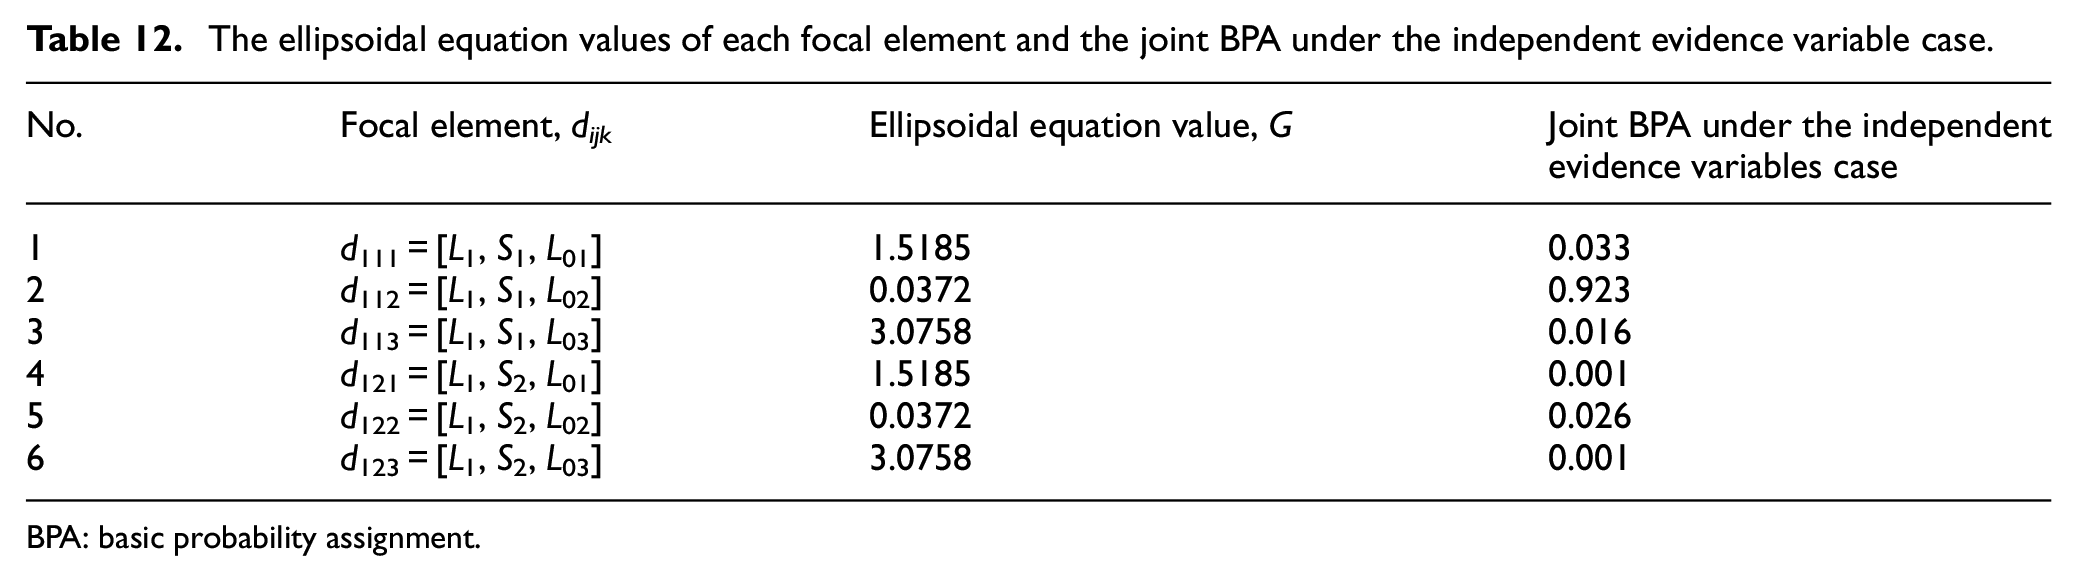
BPA: basic probability assignment.
Reliability analysis results when the joint BPAs are redistributed.

BPA: basic probability assignment.
Furthermore, the calculation results from the proposed method, the MCS method, and the FORM-UUA method are listed in Table 14. The results obtained by the proposed method are approximately consistent with the results obtained with the MCS method, and the corresponding error of joint BPA is −1.02%; the corresponding failure probability of the focal element is solved by the eigenvalue method, and the results are the same, that is, 3.0108E–10. In terms of efficiency, the times of ellipsoid equation calling required by the MCS method is 1.5 × 10³. The times of ellipsoid equation calling required by the proposed method is 48, and the calculation efficiency may be acceptable.
The engineering application example of calculating results using different methods.

BPA: basic probability assignment; MCS: Monte-Carlo simulation; FORM-UUA: unified uncertainty analysis by the first-order reliability method.
Compared with the proposed method, it can be seen that although the computational efficiency of FORM-UUA is slightly higher, the focal element with maximum credibility determined is consistent with the MCS method. However, because the FORM-UUA method does not count the correlation between the variables, the maximum joint BPA of the focal element is 0.923 and the error between the FORM-UUA and the MCS methods reaches −6.01%.
Therefore, the reliability analysis results of the focal element with the maximum credibility are chosen, namely, the locking failure reliability analysis result of the aircraft mission door is as follows: the locking failure probability is 3.0108E–10 and the confidence level is 0.972. The design scheme of the locking mechanism for the aircraft mission door is the focal element d112 = [L1, S1, L02]. That is:
The length L of the locking rod obeys normal distribution, the mean
The power spectral density P1 of the random vibration excitation in the locking state is 0.038 g2/Hz, and the lock rod displacement under this excitation is normally distributed, the mean of which is 0 and the standard deviation is 0.73 mm;
The minimum safe locking distance L0 of the lock rod is normally distributed, the mean is
Conclusion
Reliability analysis is a synthesis problem affected by both epistemic and aleatory uncertainties, due to the difficulties such as lack of statistical data and insufficient application of subjective information, in which implies that the confidence level of the reliability results is unknown and the reliability analysis has also been seriously restricted in engineering. On the basis of the above, a reliability analysis result expression including probability reliability and confidence level is proposed, and the mathematical model and calculation method are developed in this article.
Considering that the reliability analysis problem is affected by human factors, the variables involved in reliability analysis are regarded as evidence variables and the evidence space of epistemic uncertainties is constructed using evidence theory. Then the variables are regarded as random variables in each focal element; reliability calculation is carried out in the probability space. In the independence case of evidence variables, the joint BPA of the focal element in the evidence layer is expressed as the product of the BPAs of all the evidence variables involved; and in the dependence case of evidence variables, the joint BPA of the focal element in the evidence layer is derived through the ellipsoidal equation of all the evidence variables. When the reliability calculation is carried out with evidence theory, the limit state function may be linear or non-linear, and the random variable distribution and the completeness degree of the characteristic parameters involved may be different. Meanwhile, the maximum joint BPA (i.e. maximum confidence level) of the probability calculation result is chosen as the final reliability analysis result, and the corresponding focal element including the evidence variables could be regarded as the design scheme.
In the case that the BPA and correlation coefficient of evidence variables are known, numerical example and engineering application example are researched, respectively. The conclusions show that the proposed method is feasible and effective. It can provide the basis for scheme selection from the perspective of reliability. In addition, the proposed method can be extended to the corresponding data frame construction for reliability analysis, which provides technical support for improving the product reliability level.
Footnotes
Handling Editor: Shun-Peng Zhu
Declaration of conflicting interests
The author(s) declared no potential conflicts of interest with respect to the research, authorship, and/or publication of this article.
Funding
The author(s) disclosed receipt of the following financial support for the research, authorship, and/or publication of this article: This study was supported by the National Natural Science Foundation of China (Grant No. 10577015), which is gratefully acknowledged.