
Abstract
The objective of this research was to eliminate the influence of environmental stray light on the measured spectral reflectance in a spectral sensor system used on a weeding teleoperated robot for rape fields. The system mainly consists of a light source, signal acquisition, and data processing. In this study, optical modulation technology and discrete Fourier transform method were used to carry out experiments based on four characteristic wavelengths. The results show that the experimental system can obtain a stable reflectivity value no matter whether the stray light changes slowly or dramatically in the field environment. Furthermore, the calibration equation of spectral reflectance was obtained by curve fitting based on a FieldSpec3 portable spectrometer. The determination coefficients are all close to 1, and the root-mean-square errors are small. Through verification experiments, the results show that the average measurement error is less than 5%. Hence, this proposed method would be very helpful in improving the accuracy and efficiency of the spectral reflectance measurement, which in turn provides a theoretical basis for weed identification during in-field weeding by teleoperated robots.
Keywords
Introduction
Weeding robots have attracted a lot of attention in recent years.1–3 Using weeding robots can reduce the labor cost associated with weeding by humans as well as improve work efficiency. Robotic technologies have been developed rapidly in a wide range of engineering fields. The teleoperated robot is an important branch of robot research.4,5 The advantages of robotic teleoperation include the coalescence of human knowledge and astuteness with robot accuracy, repetitiveness, and power, 6 system stability, 7 the ability to eliminate humans from dangerous locations, such as when crops are sprayed with pesticides, 8 and good performance.9–11 Thus, the application of teleoperated robot technology is of great significance to the agriculture field. 12 In China, rape is an important source of edible oil. China is one of the world’s largest oilseed rape-producing countries, and rapeseed planted area and output are the first in the world. However, an abundance of weeds significantly endanger the rape crop. Since the rape planting acreage is large and the rural labor force is decreasing, the window available for weed removal is short. In order to complete weeding in a timely manner and improve the work efficiency of weeding, we have carried out an experimental study using teleoperated robots weeding in the rape field. Weed identification is the key problem facing weeding teleoperated robots, and measurement of the crop spectrum reflection is an important and first step in weed identification.
Many researchers have done a lot of work on weed identification using machine vision, spectral detection, and multispectral imaging technology.13–16 Field weed recognition based on image processing technology uses machine vision technology to capture, process, and analyze the field image containing the crops, weeds, and soil background information, such as the shape, texture, and color. The method has high spatial resolution and a high weed recognition rate. Due to the large amount of data in the image, the requirements of the processing speed of the recognition algorithm are large. For example, weed identification must have high accuracy, be nondestructive, and utilize plants spectral features, such as reflection and emission of light. Sensor measurements can be used to detect weeds, such as the measurement of the visible spectrum and near-infrared spectroscopy, and the vegetation indices derived from spectral information can be calculated easily, such as the red ratio vegetation index and the normalized difference vegetation index. 17 Feyaerts and Gool 18 developed a low-resolution spectrometer for the identification of five kinds of weeds based on six kinds of wavelengths in a sugar beet field. A classification accuracy of 83% was obtained. Borregaard et al. 19 measured spectral reflectance of young crops and soil for crop-weed discrimination by the line imaging near-infrared spectrometer in the wavelength range of 660–1060 nm. When divided into two groups (crop and weeds), the classification performance could reach 90%. The measurements included sugar beet, maize, and seven weed species. Identification of the crop and weeds was possible in laboratory tests by utilizing a few wavelength band ratios. 20 Wang et al. 21 developed an optical sensor system for wheat-weed identification based on a photosensitive transistor with a band-pass filter of the center wavelengths (496, 546, 614, 676, and 752 nm). After it was well trained, the detection accuracy of the system was generally over 70%. Dammer and Wartenberg 22 established a spot-spraying system under two wavelengths of light (650 and 830 nm) and measured an NIR/R quotient. Dammer et al. 22 have explored the spectral features of different kinds of weeds and crops for their identification under specified conditions.
It has been noted that stray light in the field will cause disturbance to reflected light in the measurement process. Routine measurements are carried out in the laboratory. The measurement conditions and environmental requirements are high. A weed identification model is built on the basis of crop spectral reflectance collected in the laboratory. It has a certain gap when applied under field conditions, and its identification accuracy is not high. In order to avoid the interference of stray light, expand the scope of application, and measure plant spectral reflectance data fast with high precision, we used an optical modulation technique to remove the influence of environmental stray light, so as to improve the signal-to-noise ratio (SNR) of the spectral reflectance of the crop.
Optical modulation and demodulation refers to the technical processes of changing the amplitude, intensity, frequency, phase, and polarization of light waves to carry information. Through the modulation of the optical signal, the DC radiation signal can be changed into an AC signal, and better filtering of background interference and an increase in the SNR of the measured signal can be obtained. Optical modulation technology has been widely used in optical communications, ranging, optical information processing, optical storage, and displays.23–25 A phase-intensity hybrid modulation method based on commercial LiNbO3 modulators was developed to reduce the cost of an ultra-short optical pulse source. 26 The optical modulation can eliminate the influence of the ambient light, which can open up a new way to improve the SNR of spectroscopy for inspection of the human tongue. 27 Lei et al. 28 utilized the optical modulation method to acquire the feature parameters in order to realize fast identification of CO based on a single sensing film. This approach opens up a path to explore how to select the metal oxide sensors. To date, few reports have been published on the optical modulation method for detecting weeds.
This research is aimed to solve the problem of eliminating environmental stray light. In this study, the optical modulation technology and discrete Fourier transform are introduced to eliminate stray light. At first, the intensity of the light signal which was emitted from the artificial light was modulated by the spectral sensor, and the reflection spectrum, which was mixed with the environmental stray light, was collected by the spectral sensor. Then, the output signal of the spectral sensor was demodulated, its maximum harmonic component was extracted, and normalization was conducted. This study focused on eliminating the influence of stray light and improving the measurement accuracy of the spectral reflectance of the crop. Three experiments were conducted: the elimination stray light experiment, the calibration experiment, and the verification experiment. The results show that the experimental system was able to obtain a stable reflectivity value no matter whether the stray light changed slowly or dramatically in the outdoor environment. It can be seen that the optical modulation method is effective and feasible. The method will further also facilitate modeling of the identification of rape and weeds based on the crop position and the crop spectral reflectance. A more practical motivation for this study is to improve weed identification in order to move work forward on the automatic weeding of the teleoperated weeding robot.
Materials and methods
The sensor system is mainly composed of a photoelectric signal modulation system and a photoelectric signal acquisition and processing system. The photoelectric signal modulation system mainly completes the modulation and emission of signals. The photoelectric signal acquisition and processing system mainly realizes the collection of reflected light and processing voltage signal. The photoelectric signal modulation system realizes the modulation of the incident light using the signal generator. The LED light source controlled by the signal generator sends a sinusoidal signal. The photoelectric signal acquisition system measures the reflected light signal using the photoelectric detector and collects the reflected light data using the industrial computer. The schematic illustration for the proposed sensor system workflow is shown in Figure 1.
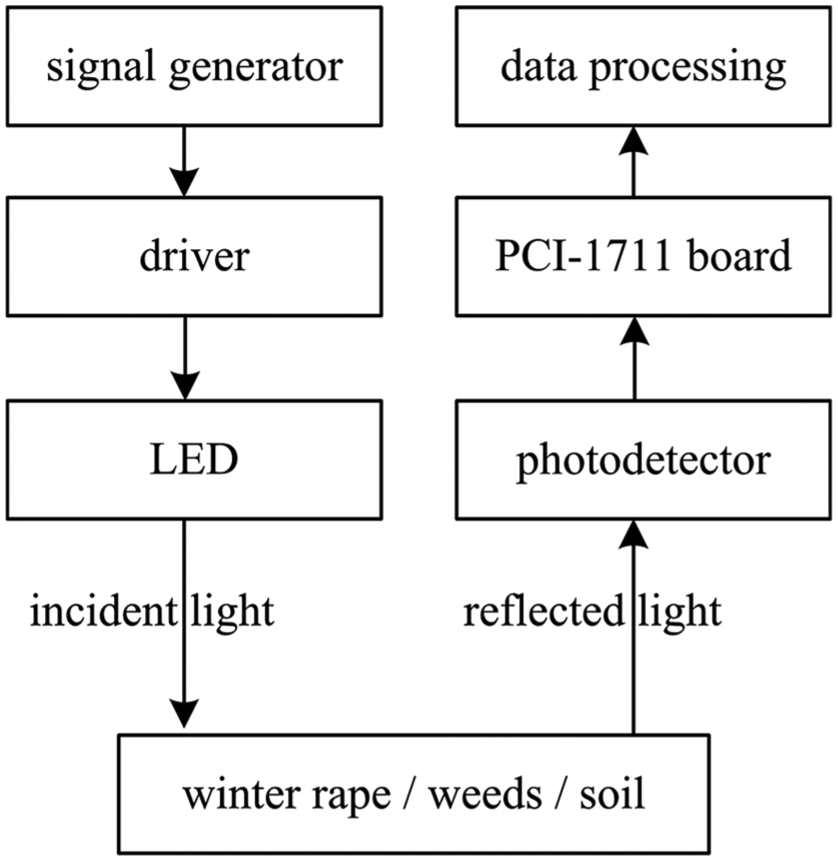
The schematic illustration for the spectral sensor system workflow.
The photoelectric signal modulation system mainly includes a signal generator, LED light source, and a driver. The area covered in rape and weed is relatively small; the field diameter of the spectral sensor is approximately 50 mm, and the actual distance from the sample is approximately 500 mm. The optical path design of the spectral sensor system is shown in Figure 2. The light source emits a specific wavelength of incident light to the samples (rape, weeds, and soil). Part of the light is absorbed and the other part is reflected by the samples. The reflected light is collected by the lens and filtered through the filter. Finally, the reflected light of a specific wavelength can enter the photodetector. In order to realize the modulation of the optical signal and satisfy the fast response characteristics of light modulation, a LED light source (Thorlabs Inc., Newton, NJ, USA) was used as the light source of the sensor system. The selected wavelengths of the LED light source were 590, 710, 750, and 940 nm. The LED had good monochromaticity. The maximum current was 1000 mA. The light intensity of LED light source was modulated by an external control mode. The LED light source was driven by a DC4100 driver during the operation of the spectral sensor system. The signal generator emitted a sinusoidal voltage signal of 20 Hz to the DC4100 LED driver, and the amplitude ranged from 0 to 5 V. The light source intensity changed according to the sinusoidal law, from zero to the maximum amplitude.
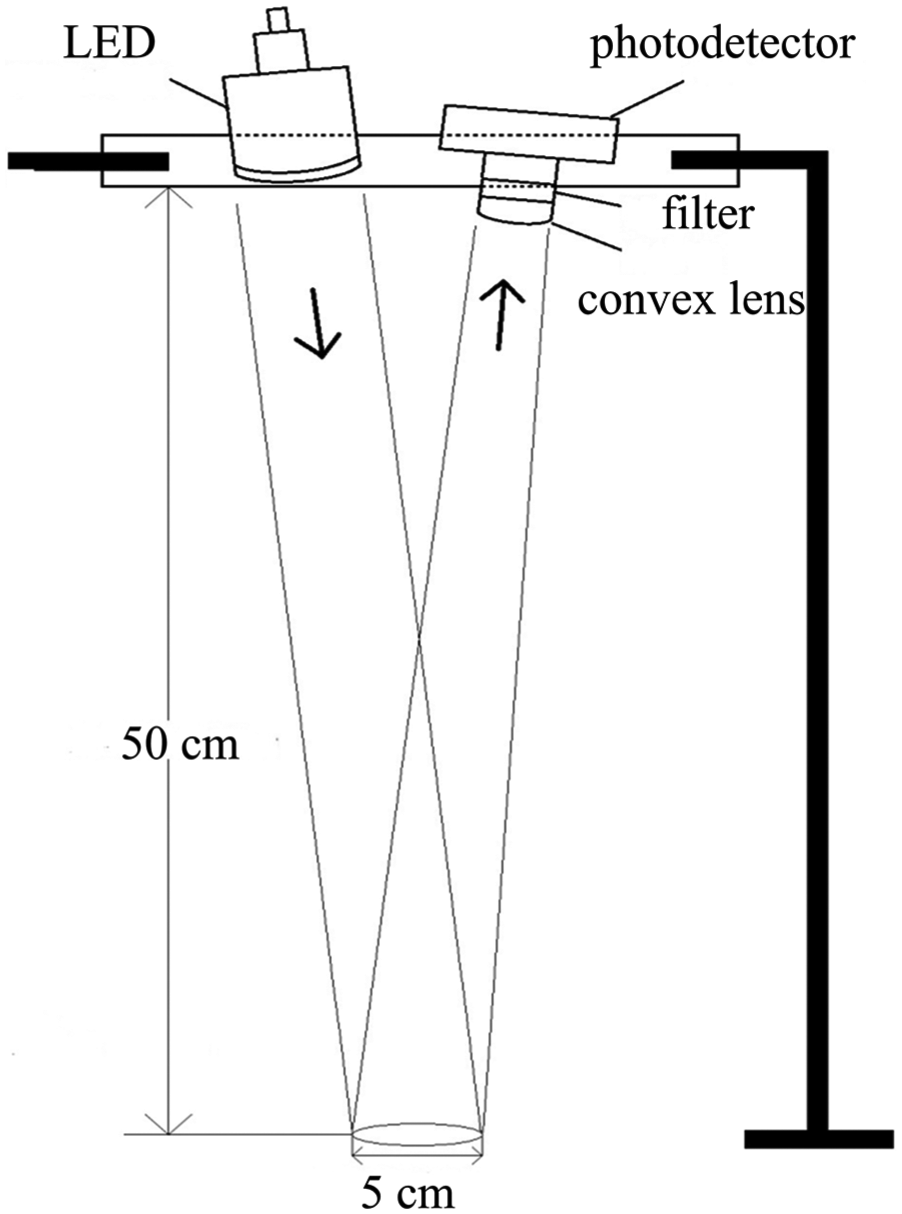
Optical path design of the spectral sensor.
The photoelectric signal acquisition and processing system mainly include a lens, a photodetector, a signal acquisition board, and the industry computer. In the spectral sensor system, the photodetector is crucial, which affects the accuracy of the measurement. The PDA100A photodetector is an amplified, switchable-gain, silicon detector designed for the detection of light signals over a wavelength range of 320–1100 nm. The photodetector has the magnification function with adjustable gain. The full waveform can be obtained by adjusting the gain for different intensities of light. The maximum output current is 100 mA. The gain adjustment range is from 0 to 70 dB. The photodetector converts optical signal into electrical signal.
The analog voltage signal from the photodetector was received by the PCI-1711 board in the industrial computer. This board can achieve 12-bit high-speed AD sampling, of which the rate can reach 100 kHz. In order to obtain the amplitude at the modulated frequency accurately, the resolution of the spectrum analysis should be improved. To meet the requirement, the sampling frequency was set as 1 kHz in this article. LabVIEW software was used for the data processing system. The program performs real-time waveform data processing. It mainly completes the waveform data collecting, filtering, spectrum analysis, and signal amplitude extraction. LabVIEW is systems engineering software for applications that require testing, measurement, and control with rapid access to hardware and data insights. When the sensor system works, noise signals which are smaller than 10 Hz or greater than 50 Hz should be filtered out by a finite impulse response band-pass fill for the collected data in the LabVIEW. The spectrum analysis can be performed through the discrete Fourier transform. The obtained voltage signal is a discrete signal in both the time domain and the frequency domain. The discrete Fourier transform is shown in equation (1)

The X(k) is a sequence, which is also called the discrete signal, composed of the limited length of N data points. In the formula, k = 0, 1, 2,…, n – 1 and e is the base of the natural logarithm; i is an imaginary unit.
Finally, the discrete Fourier transform for the filtered signal should be performed to achieve the spectral amplitude value. The amplitude value at the modulation frequency of 20 Hz is extracted as the representation of the spectral reflectance. The different amplitude reflects the different crop spectral reflectance.
Experiments and analysis
Stray light elimination experiment
In order to verify the effect of the optical modulation and demodulation technology on eliminating the interference of environmental stray light, winter rape leaves at the seedling stage were selected as the samples used in the experiments. External interference signals are mainly caused by sunlight. The best time to conduct the experiment is at approximately noon outdoors, when the weather is sunny and the sun zenith angle is less than 45°.
In order to demonstrate the effect of light on the reflectivity of the sample, the researchers periodically screened the sunlight on the leaves to simulate the dramatic changes in ambient light before the stray light elimination occurred. The collected waveform data are shown in Figure 3, and it can be seen from the figure that when the occlusion phenomenon exists, the voltage ranges from 0.6 to 1.6 V. When direct sunlight hits the blade, the voltage ranges from 2.6 to 3.2 V. The differences in voltage vary with the degree of occlusion. It can be seen that different ambient light irradiation conditions have a great influence on the reflected light measurement signal of the photodetector.

The result of occlusion experiment.
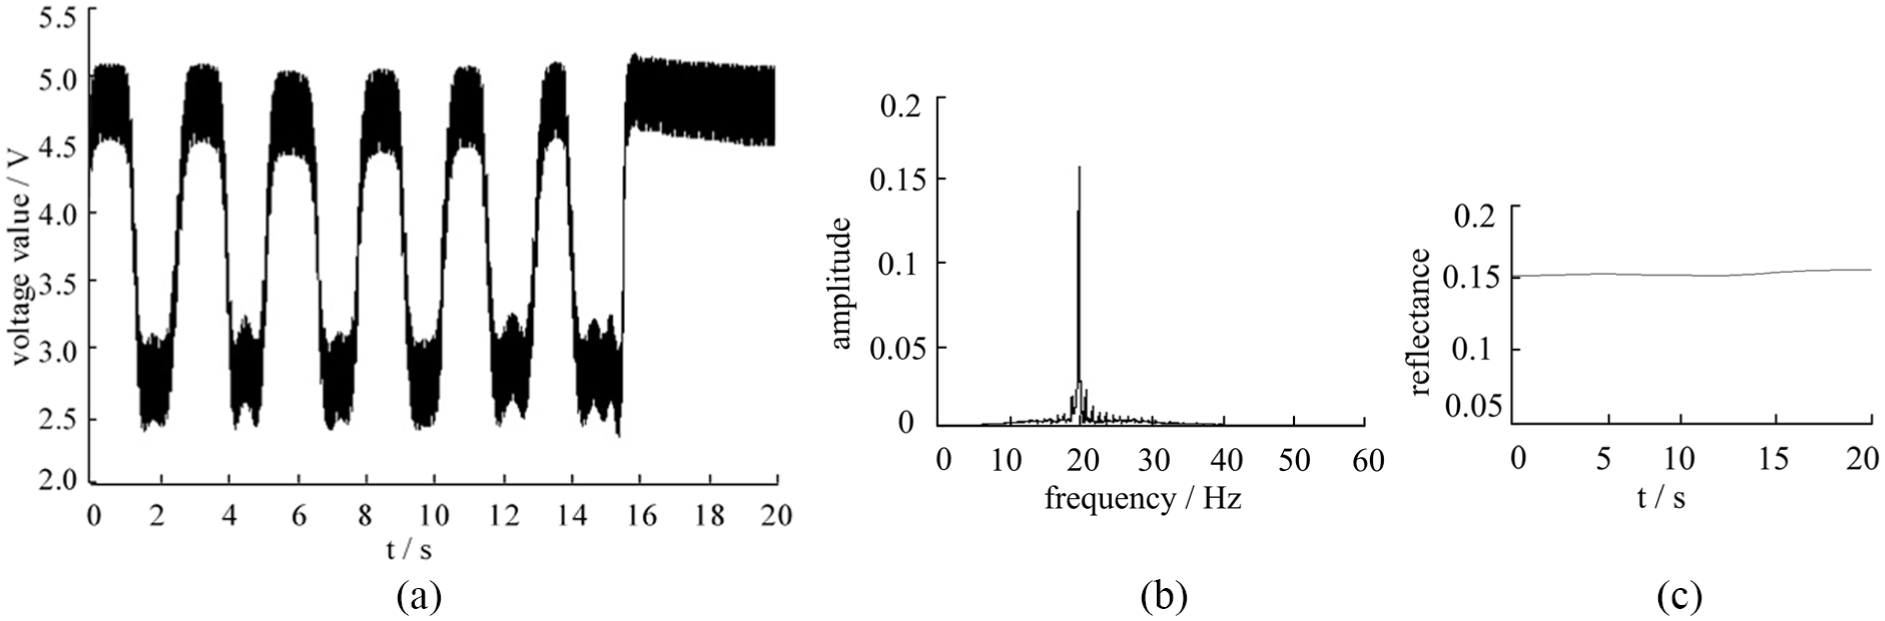
The leaves of winter rape should be placed to ensure that the coverage area of the leaves is greater than a circle with a diameter of 50 mm and irradiated by a LED light source with a central wavelength of 590, 710, 750, and 940 nm. 29 The light source should be modulated to be sine-wave with the frequency of 20 Hz. The photodetector probes the reflected light signal coordinated with the filter in real time. The detector gain knob must be adjusted so that the reflected light signal can be detected adequately without the premise of the detection of electrical signal saturation. In the process of collecting the waveform data, the exposure of the sun should be blocked irregularly to observe the effect of severe changes in the stray light on the test results. Finally, the voltage waveform data detected by the sensor system was recorded, as shown in Figures 4–7(a). Then, the data results were filtered and the spectra were analyzed; the amplitude was obtained at each frequency. The results are shown in Figures 4–7(b). Using demodulation technology, the amplitude was extracted under 20 Hz, which was the reflectance of the measured sample. The results are shown in Figures 4–7(c).

The results of experiment under 590 nm: (a) waveform data, (b) spectrum analysis chart, and (c) variation diagram of reflectance figurative value.

The results of experiment under 710 nm: (a) waveform data, (b) spectrum analysis chart, and (c) variation diagram of reflectance figurative value.

The results of experiment under 750 nm: (a) waveform data, (b) spectrum analysis chart, and (c) variation diagram of reflectance figurative value.
The results of experiment under 940 nm: (a) waveform data, (b) spectrum analysis chart, and (c) variation diagram of reflectance figurative value.
As shown in Figure 4 under the 590 nm light source, when we cover partial sunlight in winter rape, the DC component of the ambient stray light will change dramatically from 3.65 to 4.91 V; the change range is approximately 34.5%. The average value of 20 times reflectivity measured by the experimental system is approximately 0.042. The reflectance characterization is stable, although the waveform of the DC component changes drastically in 20 s.
As shown in Figure 5 under the 710 nm light source, when we cover partial sunlight in winter rape, the DC component of the ambient stray light will change dramatically from 1.4 to 2.2 V; the change range is approximately 57.1%. The average value of 20 times reflectivity measured by the experimental system is approximately 0.027. The reflectance characterization is stable, although the waveform of the DC component changes drastically in 20 s.
As shown in Figure 6 under the 750 nm light source, when we cover partial sunlight in winter rape, the DC component of the ambient stray light will change dramatically from 0.88 to 1.65 V; the change range is approximately 87.5%. The average value of 20 times reflectivity measured by the experimental system is approximately 0.035. The reflectance characterization is stable, although the waveform of the DC component changes drastically in 20 s.
As shown in Figure 7 under the 940 nm light source, when we cover partial sunlight in winter rape, the DC component of the ambient stray light will change dramatically from 2.5 to 5.1 V; the change range is approximately 100.4%. The average value of 20 times reflectivity measured by the experimental system is approximately 0.158. The reflectance characterization is stable, although the waveform of the DC component changes drastically in 20 s.
The result indicates that the optical modulation and demodulation technology has a significant effect on eliminating the interference of environmental stray light. The experimental results of Figures 4–7(c) show that using the active light intensity modulation combined with filtering and discrete Fourier transform, the value of the reflectance will be stable if the external environment illumination changes. Therefore, the sensor system can still obtain the reflectance of the measured samples under changing light conditions, and it is not subject to light changes. It provides a strong guarantee for the calibration of the sensor in the field.
Calibration experiment
In order to transform the data measured by the spectrum sensor system into the spectral reflectance of rape, soil, and weeds, we carried out calibration experiment using a spectrometer in the laboratory. We used a FieldSpec3 portable spectrometer (ASD Inc., Longmont, CO, USA) (Figure 8). The experimental samples of weed leaves, rape leaves, and soil needed to be prepared. Since the light source field of the spectrum sensor system (Figure 9) is a circle with a diameter of 50 mm, the rape, soil, and weed samples need to be covered in the circle, respectively. Among them, there were five rape samples, five soil samples, and four different kinds of weeds from which five samples of each kind were taken.

FieldSpec3 portable spectrometer.

Weeding robot spectral sensor.
In the experiment, we first used a portable spectrometer to detect the spectral reflectance of rape, soil, and weed samples, and then the reflectance characterization of samples was measured by the proposed spectral sensor of the weeding robot under the light source. We tried to ensure that the position of the samples was consistent. We measured each sample five times at the same position and calculated its average value. In the calibration experiment, we adjusted the gain of the photodetector. When the gain is 50 dB, the experiment can obtain the full waveform. At the wavelengths of 590, 710, 750, and 940 nm, the experimental results of the portable spectrometer and spectral sensor experimental system were recorded. We have a regression analysis of the data. The values measured by a spectral sensor and the reflectivity measured by a portable spectrometer were linearly fitted. The analysis results are as follows.
We obtain the curve through linear fitting at the wavelength of 590 nm as shown in Figure 10, and the curve equation is
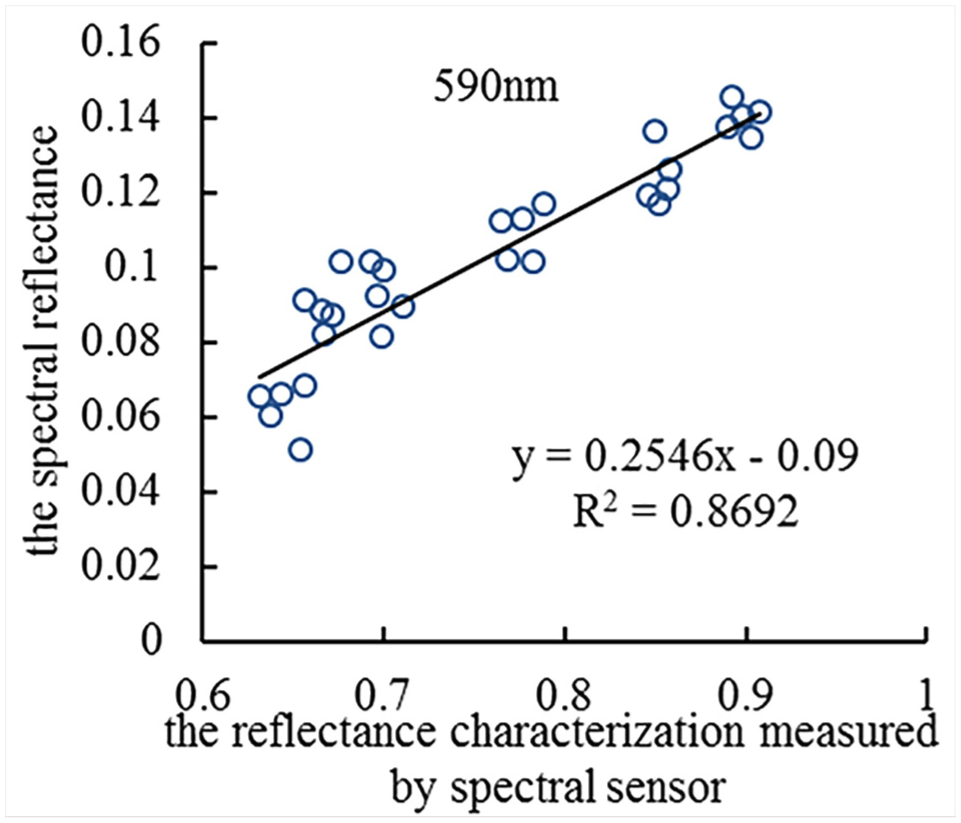
The fitted curve (590 nm).
We obtain the curve through linear fitting at the wavelength of 710 nm as shown in Figure 11, and the curve equation is
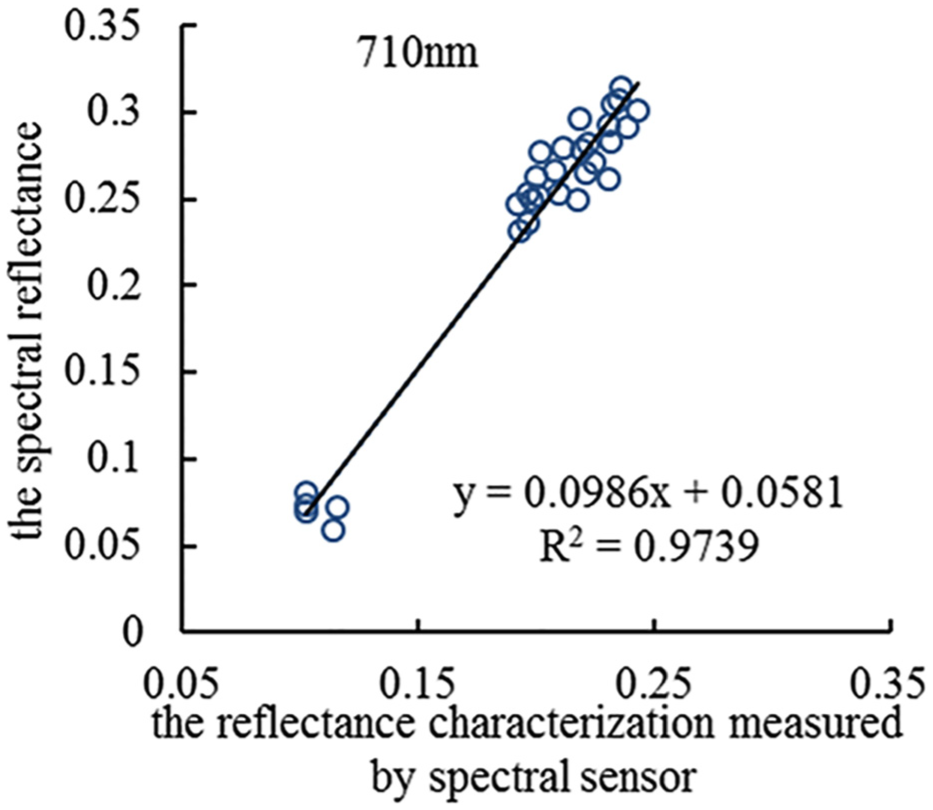
The fitted curve (710 nm).
We obtain the curve through linear fitting at the wavelength of 750 nm as shown in Figure 12, and the curve equation is

The fitted curve (750 nm).
We obtain the curve through linear fitting at the wavelength of 940 nm as shown in Figure 13, and the curve equation is

The fitted curve (940 nm).
The values of R 2 of the calibration variance are all high by above analysis. The relationship between the measured values of the two instruments is spaced along the fitted line or distributed on both sides of the fitted line, indicating that the system has good accuracy and stability. In the above analysis, each calibration equation has a high coefficient of determination, which indicates that the self-developed spectral sensors can be calibrated well by the relative reflectance detected by the spectrometer. It can clearly be seen that the reflectance characterization measured by spectral sensors is closely related to the actual spectral reflectance measured by the portable spectrometer. After the calibration, we can obtain the actual spectral reflectance calculated by the calibration equation in the field, which can eliminate the interference of stray light.
Verification experiment
Fresh leaves of winter rape, which were growing in the experimental field, were used as test samples in the verification experiment. Each leaf sample was cut into a 500 mm diameter circle. There were 15 samples in all. The spectral reflectance characterization of the samples was measured under the experimental system light source. The spectral reflectance was calculated by substituting the experimental results into the calibration equations at each wavelength. The verification test results of the calibration equation are shown in Table 1.
Verification test data of calibration equation.
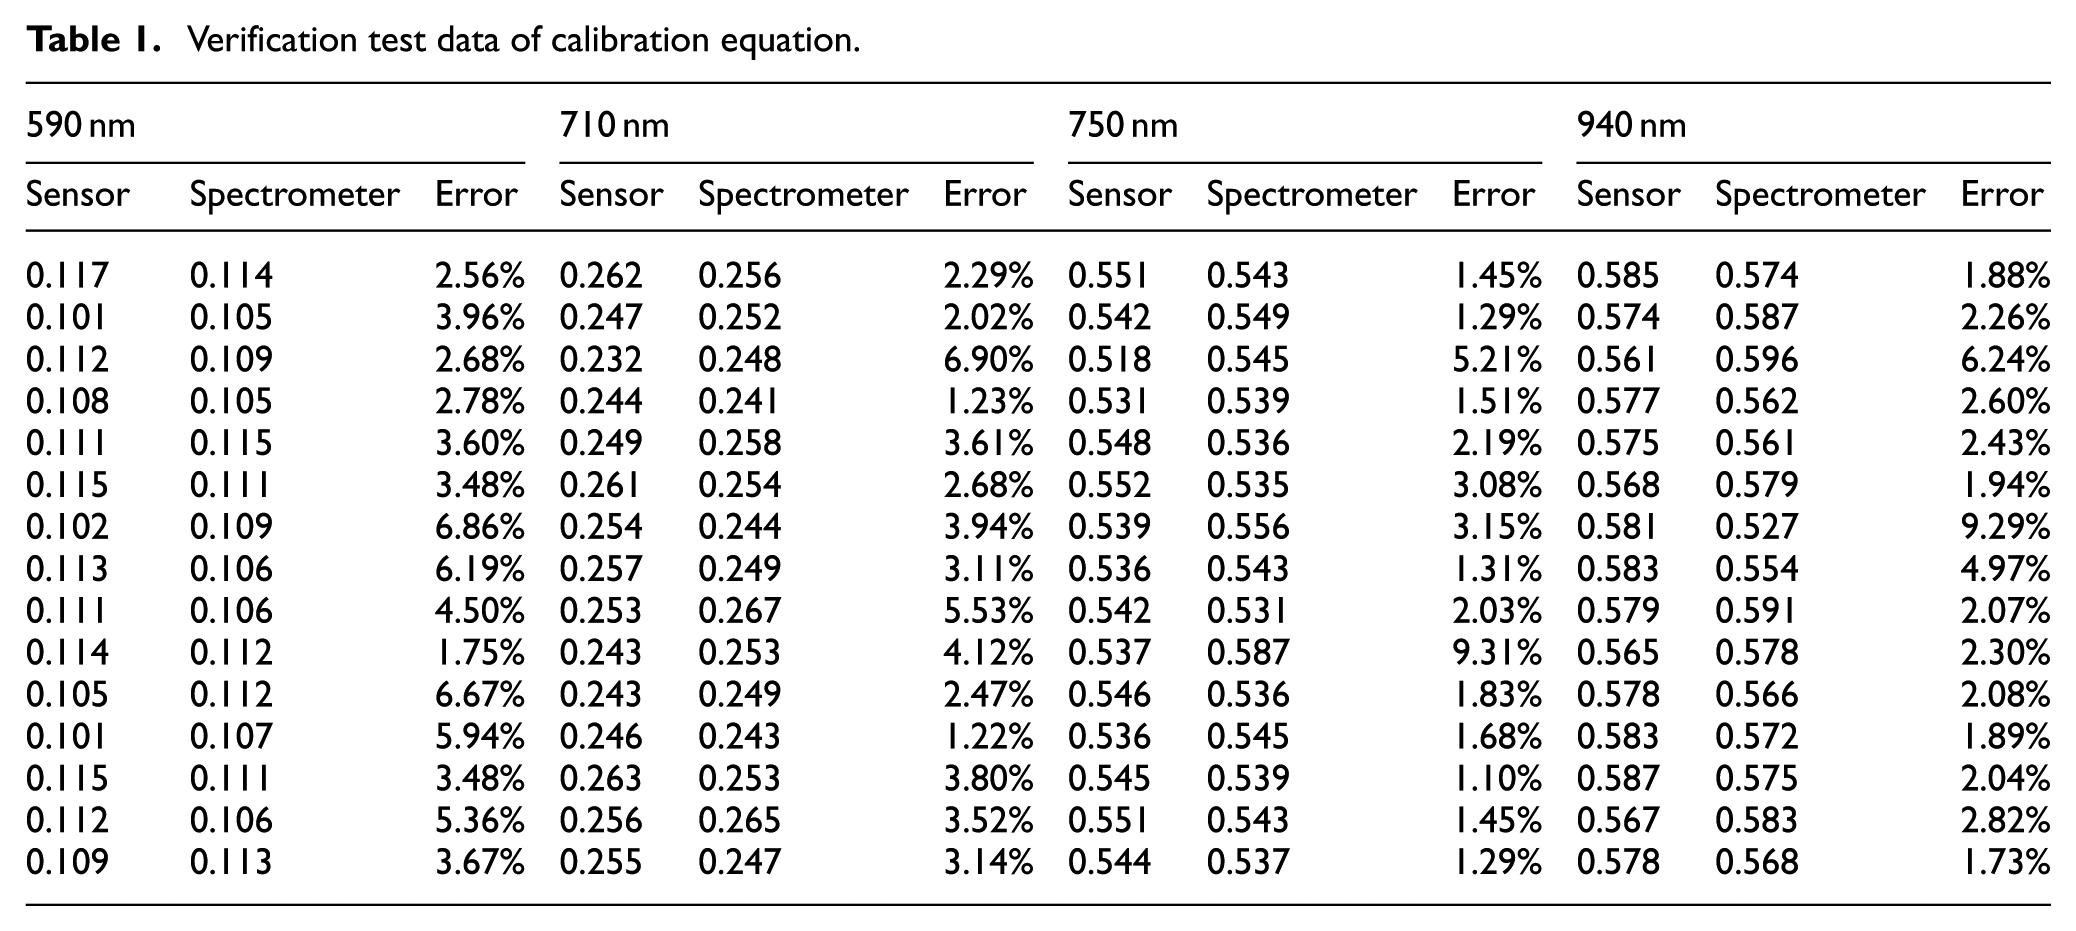
The spectral reflectance calculated by the calibration equation was compared with the spectral reflectance measured by an ASD portable spectroscopic analyzer. The average measurement error of the spectral sensor was 4.23%, 3.31%, 2.53%, and 3.1% under 590, 710, 750, and 940 nm, respectively. Thus, the detection error is less than 5% for the four center wavelengths. The maximum relative error is 9.29%. The main reason for the relative error of the test is that the relative position of the sample in the experimental system is biased against the relative position placed in the spectrometer when detecting the reflected light signal. The greater the relative position deviation, the greater the error.
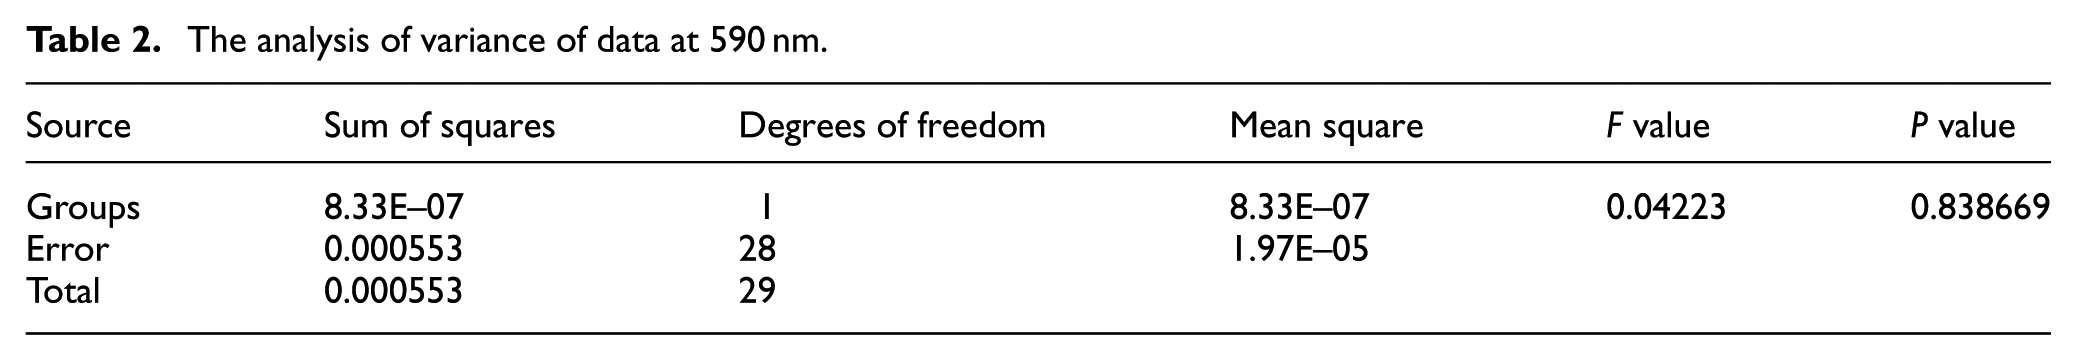
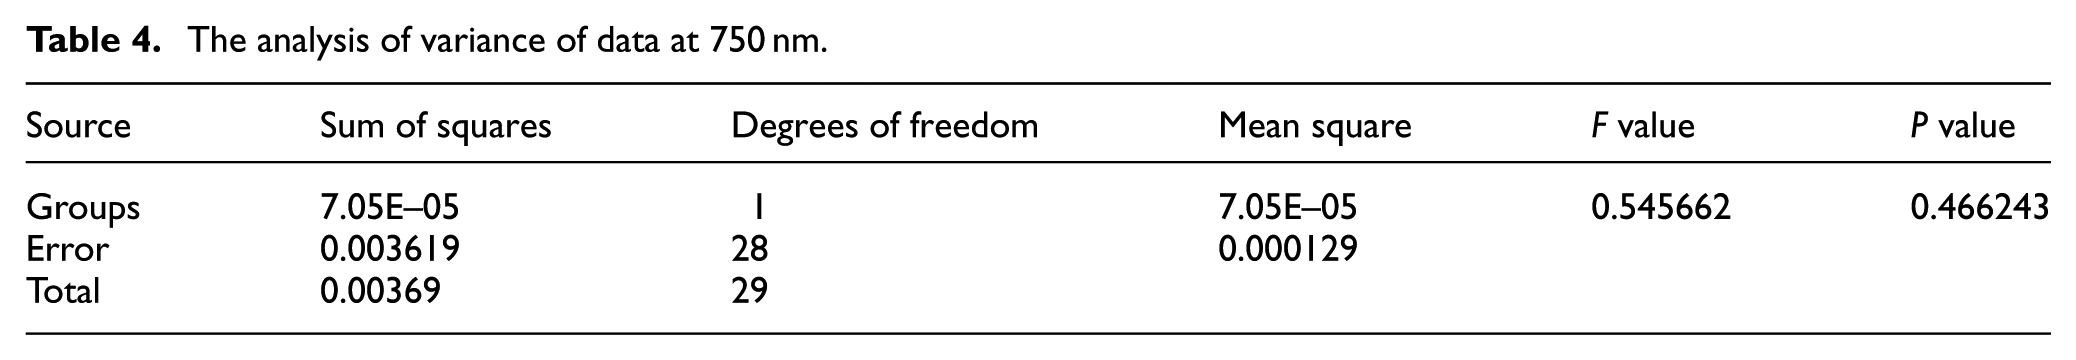
Origin software was also used to carry out single factor analysis of variance for the measured and calculated values, which was performed for each of the four wavelengths, respectively. From Tables 2–5, the F value is 0.042, 0.1, 0.546, and 0.892, respectively. Based on the critical value of the F distribution table, F0.05 (1, 27) is 4.21. The F values of the data in Tables 2–5 are all less than 4.21; hence, there is no significant difference between the two groups at a significance level of 0.05. Through the above analysis, the results of the proposed spectral sensor system can be obtained well. It is shown that the spectral sensing system is accurate and reliable.
The analysis of variance of data at 590 nm.
The analysis of variance of data at 710 nm.

The analysis of variance of data at 750 nm.
The analysis of variance of data at 940 nm.

Discussion and conclusion
In this article, the characteristic spectral signal of winter rape leaves was measured by the combination of optical modulation technology and the discrete Fourier transform. The intensity of the light signal, which was emitted from the artificial light, was modulated by the spectral sensor, and the reflection spectrum, which was mixed with the environmental stray light, was collected by the spectral sensor. Then, the output signal of the spectral sensor was demodulated, its maximum harmonic component was extracted, and normalization was performed. In this article, a stray light elimination experiment, calibration experiment, and verification experiment were carried out. The results show that the experimental system can obtain a stable reflectivity value no matter whether the stray light changes slowly or dramatically in the external environment. Thus, it eliminates the interference of the environmental stray light to the output signal of the spectrum sensor and improves the stability of the model. The determination coefficients of the four different central wavelength calibration equations were 0.8692, 0.9817, 0.9812, and 0.9812. The determination coefficients are close to 1, and the relative error of the experiment results is small. It can be seen clearly that the reflectance characterization measured by the self-developed spectral sensors is closely related to the actual spectral reflectance measured by the FieldSpec3 portable spectrometer. After calibration, the actual spectral reflectance calculated by the calibration equation was obtained, which can eliminate the interference of stray light. The experimental system and method have the advantages of having a high SNR, being lossless, and easy to realize, which eliminate the influence of uncontrolled environmental changes. The results provide a theoretical basis for weed identification when the teleoperated weeding robots operate in the field.
Overall, a lot of work still needs to be done and there are many problems that need to be solved, such as stability of the light source, the design of the signal conditioning circuit, and the algorithm of data processing. All of these will affect the accuracy of spectral reflectivity. Meanwhile, recognition models based on the spectral reflectance in four wavelengths will be built in future work. We can use the main classification methods, such as support vector machine (SVM), K-nearest neighbor (KNN), partial least squares discriminant analysis (PLS-DA), and artificial neural network (ANN). There are some uncontrollable factors, for example, temperature, humidity, and vibration in the teleoperated weeding robot operation, whose influence also need to be dealt with. We can then build a more effective data processing method. Besides eliminating the influence of stray light in the natural environment, there are many other problems encountered in weeding, such as the recognition model, obstacle avoidance during operating, path planning, and performance of the teleoperated weeding robot teleoperation. All of these factors restrict the weeding operation and need to be studied in future work. The universality and applicability of these methods for the weeding of other plants by the robot will also be a part of our future research.
Footnotes
Handling Editor: Michal Kuciej
Declaration of conflicting interests
The author(s) declared no potential conflicts of interest with respect to the research, authorship, and/or publication of this article.
Funding
The author(s) disclosed receipt of the following financial support for the research, authorship, and/or publication of this article: This work is supported by National Natural Science Foundation of China (51575244), Key University Science Research Project of Jiangsu Province (14KJA210001), Jiangsu Province “Qinglan Project” (2017), Graduate Innovative Projects of Jiangsu Province 2016 (KYLX16_0909).