
Abstract
High sampling frequency of eye-trackers introduces noise in raw eye movement data. Furthermore, the unstable sampling frequency of devices generates fluctuating time interval between samples, which has negative influence on the quality of raw eye movement data. Therefore, the article aims to propose a valid and universal procedure on raw eye movement data processing. The procedure will be suitable for eye movement data collected by most types of eye-trackers. Characteristics of raw eye movement data were analyzed, and a comprehensive data processing procedure was proposed. Steps in this procedure include preliminary inspection of raw data, the checking and correction of actual sampling frequency, the selection of eye movement data, small gaps filled-in, data filtering, and fixation identification. By this procedure, raw eye movement data collected by eye-trackers can be used to identify types of eye movements and obtain fixation points in eye-tracking experiment. In the end, a paradigm test was designed to examine the correctness of data processing flow, and the application of eye movement data was also discussed.
Introduction
As an evolutionary species, humans acquire external information by different ways. Visual, auditory, olfactory, and tactile senses are most commonly used. Researchers had studied the ratio of information obtained by different types of sensation. It was found that vision obtains about 80% of environmental information, which makes it the most important way for information searching and receiving. 1 Thereafter, eye tracking had been gaining in popularity for decades as a window to understand and study observer’s visual characteristics, as well as the cognitive ability.2–5 For instance, eye tracking was widely used to investigate where observer is looking at and what draws observer’s interests in fields of reading, running, daily working, driving, swimming, and so on. 2 In 1962, the first eye-tracking device was developed to record eye movement during relatively unconstrained activities.6,7 A camera was mounted on the observer’s head, which filmed the view ahead and tracked the reflection of eyeballs simultaneously. By this way, experimenters could inspect gaze targets while observer is conducting a particular task. Problems about this device were the low tracking accuracy and the limited tracking range. Hence, eye-tracker designed on the basis of pupil tracking was widely used after that. Infra-light was used to illuminate eyeball and produce a white pupil. The reflection pupil was then tracked automatically by eye-trackers, and eye movement was recorded from time to time. 8 Except for pupil, iris was also used to reflect eye movement. 9 Until now, non-contact eye-tracker combined with a video camera is the most commonly method to record eye movement.
Study on eye movement functions had revealed that there are several types of eye movements to ensure that humans observe external environment flexibly. Among different types of eye movements, visual fixation and saccade are much more important and special. Saccade is the fastest movement. It redirects eye to a new target within a quite short time. Fixation is the interval between saccades, in which target is held almost stationary.10,11 It had been proved that humans capture information by fixation.12–17 It was also by fixation we could know what kind of objects draw people’s attention, as well as what kind of visual clues were used when people execute kinds of missions. Due to the fact that all types of eye movements were recorded in eye-tracking experiment and that the direct identification of types of eye movements is of giant difficulty, many researches had been carried out to identify types of eye movements, especially identify fixation and saccade with high accuracy.18–23
Fixation identification is a subjective process. It is hard to know when the fixation behavior starts and when it ends. While the function of fixation is commonly approved, its identification is much more argumentative. Some researchers believed that fixation has much smaller angular velocity than other types of eye movements, so angular velocity was used to distinguish fixation from others. However, the exact threshold of angular velocity to define fixation still remains uncertain. 22 Some researchers thought that fixation points usually cluster together as a whole in spatial dimension and the behavior lasts for a rather long time, but the spatial proximity and time duration are hard to decide. 18
Another important problem about fixation identification is the quality of raw eye movement data collected by eye-trackers. Relevant researches until now were quite few. It had been known that eye movement was recorded by eye-tracker with high sampling frequency. Due to the high sampling frequency of eye-tracker, noise would be brought into. Furthermore, the unstable sampling frequency of device generates fluctuating time interval between samples, which has a negative influence on the quality of raw eye movement data. Therefore, it was of great significance to process raw eye movement data before they are used to identify types of eye movements. 24 The article aims to develop a valid and universal procedure to process raw eye movement data collected by eye-trackers. Characteristics of raw eye movement data were analyzed, and a comprehensive data processing procedure was proposed.
Analysis of raw eye movement data
Types of parameter collected by eye-trackers
In transportation field, eye-tracker was widely used to collect eye movement data in driving. The collected data could be used to analyze driver visual characteristics. In general, eye-tracker was mounted on the instrument panel just in front of the driver, as shown in Figure 1. A coordinate fixed on eye-tracker was established to describe eye movement conveniently. The origin of the coordinate locates in the center of eye-tracker. The x-axis directs to driver’s left side, z-axis parallels to vehicle’s longitudinal axis and directs to driver, and y-axis perpendiculars to the xz-plane and directs to upward.

Eye-tracker–fixed coordinate used to describe driver eye movement.
By market survey, parameters used to describe eye movement by different kinds of eye-trackers were quite similar. Essential parameters are listed and described in Table 1.
Essential parameters collected by eye-trackers.
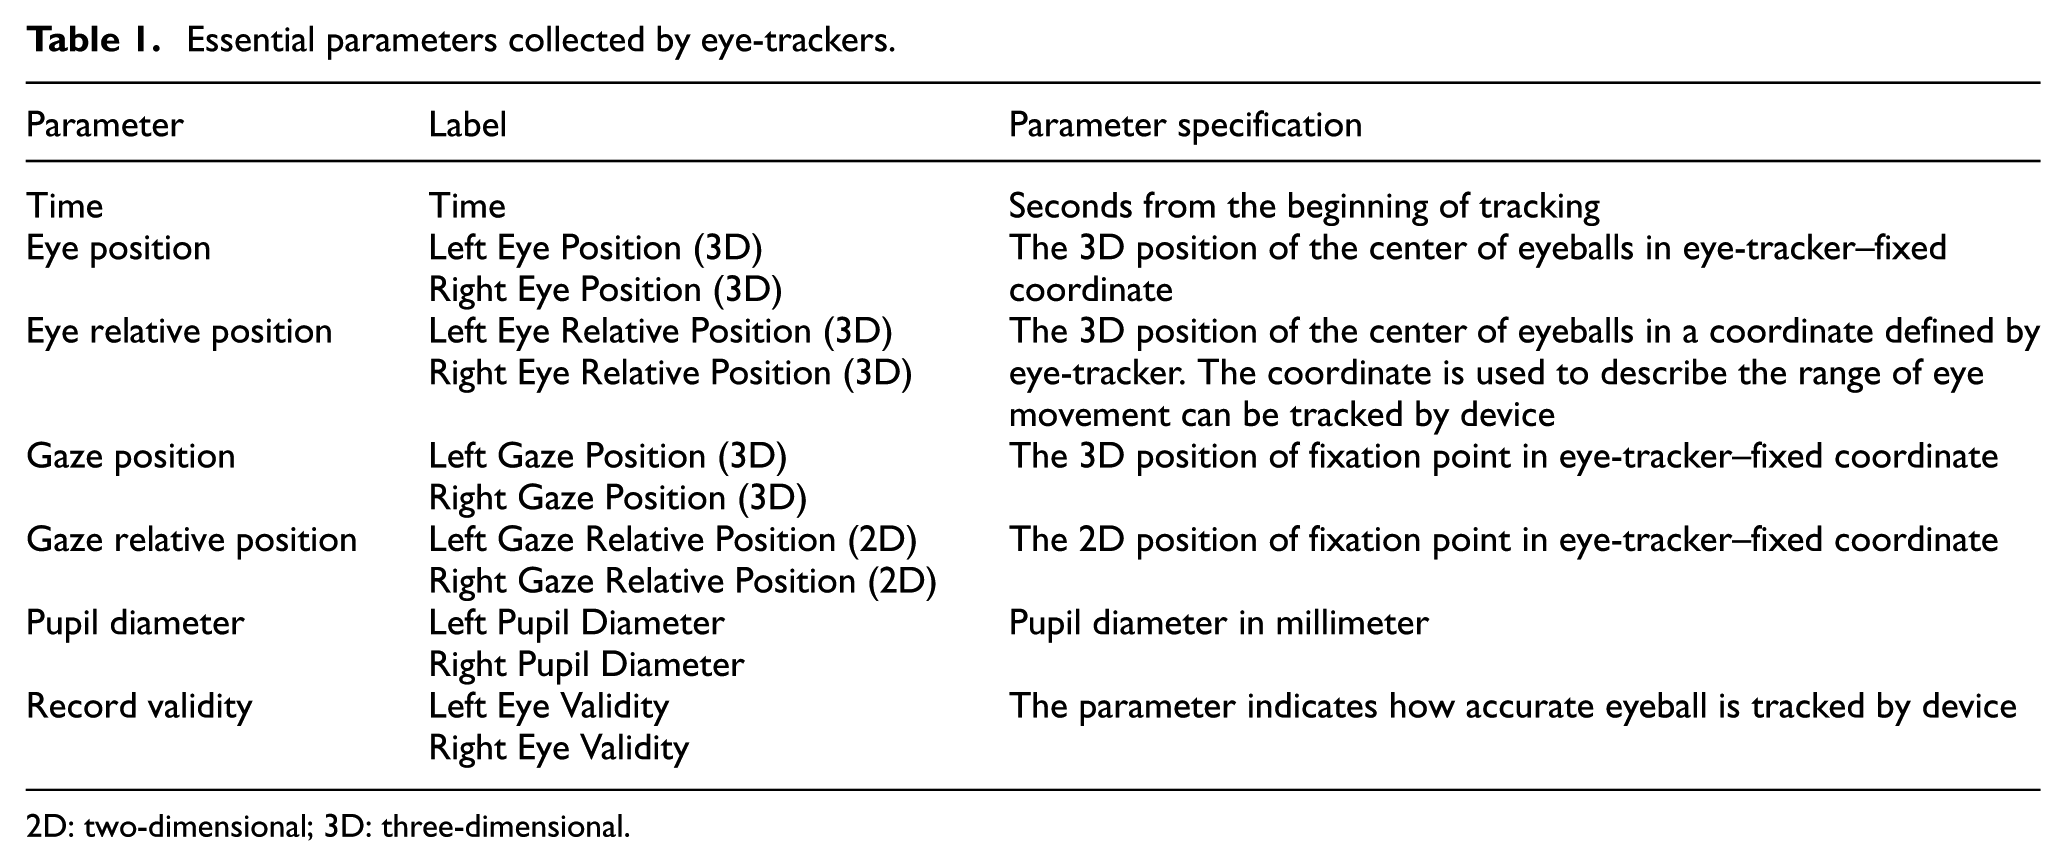
2D: two-dimensional; 3D: three-dimensional.
Both left and right eyes were recorded by eye-tracker in tracking process. The record validity is a very important parameter. It is used to describe how accurate eye movement was tracked by equipment. Generally, larger value indicates less tracking accuracy. Validity value for both left and right eyes being small indicates that driver’s eye movement was tracked very well. While either left or right eye cannot be tracked, validity value of the record is the largest and the other parameter values are all set to be zero.
Sampling frequency
Human eyes move quite quickly. During fovea relocations, eyes move as fast as possible, their speeds can reach to 700°/s. To capture eye movement accurately, high sampling frequency for eye-tracker was asked. Commonly, sampling frequency of eye-trackers changes from 40 to hundreds of Hz.
An eye-tracker with sampling frequency of 60 Hz was used to collect eye movement data. A statistical analysis was then carried out to examine its practical sampling frequency. The test result is plotted in Figure 2.

Practical sampling frequencies in data collection.
The job was done by calculating how many records were included per second. It was found that practical sampling frequency changes from 55 to 79 Hz gradually. The probability of occurrence for these frequencies is presented in Figure 2. Obviously, the sampling frequency of 60 Hz shares a great proportion. There was about 65% probability that the eye-tracker records eye movement with the frequency of 60 Hz. However, eye movement recorded by the device at other frequencies still makes up 35% of the probability.
Principles of eye movement data processing
Classification of types of eye movements
The function of eye movement is to acquire surrounding information quickly, identify objects of interests, and judge their color, size, position, and so on. There are six basic types of eye movements: visual fixation, saccade, smooth pursuit movement, vergence movement, optokinetic reflex, and vestibulo-ocular reflex. The first three kinds of eye movements, which had been studied for decades, have direct and intense relationship with human daily works.
Visual fixation is the most important function of eyes. Targets are held on fovea almost stationary for at least 100–200 ms in fixation. Thereafter, the identification and recognition of objects were completed. During fixation, the size, the position, motion velocity, color, and other else features of the target can be recognized. Hence, fixation can directly reflect observer’s interests. It had been proved that eye movement velocity in fixation process is quite low. In general, the maximum eye movement velocity in fixation process will not above 100°/s.
Saccade and smooth pursuit work together to acquire and hold object image on fovea. Their function is to shift gaze. Saccade is the interval between fixations, by which sight is rapidly redirected and focus of interest is relocated. Saccade has quite large velocity, its peak velocity can reach to 700°/s. Normally, the transfer amplitude changes from 1° to 50°, and the transition lasts for about 10–100 ms. Due to high motion velocity, eyes almost blink and vision is quite blur in saccade process. Therefore, saccade does not have the function of object identification or recognition.
Smooth pursuit enables a slow moving target to be held on fovea. This type of eye movement can only be aroused when object moving at a slow speed is tracked. Smooth pursuit is composed of three phases: initiation, pursuit, and pursuit termination phase. The first two phases are the most interesting and important to be analyzed. In smooth pursuit, brain needs to process both space and time information which are necessary to rotate head and eyeballs along the motion of objects. The maximum eye movement velocity in smooth pursuit can reach to 60°/s. When target moves at a quite slow velocity, there is no saccade in smooth pursuit movement. With the increase in moving speed, eyes could not follow the motion of objects. Under this situation, saccade is generated to chase objects. It also should be mentioned that smooth pursuit movement has specific predict function. When the purchased target is hidden by backgrounds, observer could predict where and when the target will appear again.
Characteristics of visual fixation
Visual fixation is commonly used to reflect observer’s interests, and it is an important method to investigate visual clues when conducting searching, driving, running missions, and so on. Hence, it is of great significance to identify and judge visual fixation correctly from eye movement data.
Characteristics of visual fixations had been studied by many researchers, and the features are summarized as follows:
Visual fixation has rather low eye motion velocity. To identify objects of interests carefully, observer needs to focus the target on fovea almost stationary. The velocity profiles of visual fixation show essentially low-velocity distributions (i.e. <100°/s). While the velocity profiles of saccade show essentially high-velocity distributions (i.e. >300°/s), angular velocity of eye movement was usually used to identify fixation. Some researchers used a threshold of 20°/s to distinguish fixation, while some used a threshold of 30°/s.
Visual fixation commonly has a long duration. In fixation process, information on target was identified and recognized. The whole information processing needs a rather long time. It was widely accepted that fixation is rarely less than 100 ms and often lasts 200–400 ms.25,26 Besides, fixation duration has a relation with task complexity. The more difficult the task is, the longer duration the fixation needs. To identify fixation accurately, duration should be considered.
Visual fixation has the property of spatial proximity. Fixation points generally appear as a cluster to keep observer’s focus on one target or relevant visual targets. Therefore, fixation points usually cluster together in spatial. It was published by some studies that the spatial dispersion–threshold is about 0.5°–1° in visual angle if the distance from eye to screen is already known. 18 Otherwise, the spatial dispersion–threshold to identify a fixation cluster should be estimated based on eye movement data analysis.
Eye movement data processing
The processing procedure
Visual fixation is a direct reflection of observer’s interests. By investigating fixation distribution and duration in daily works, how observer surveys surroundings, what visual clues are used to instruct human decisions, and so on, can be researched. However, raw eye movement data collected by eye-tracker were not suitable to identify fixation directly. Due to the fact that raw eye movement data were greatly influenced by sampling equipment, some solutions must be carried out to repair flaws in raw data.
A universal procedure for raw eye movement data processing was designed, as shown in Figure 3. The checking and correction of sampling frequency was the most important step in the procedure. Steps after frequency correction were initiated by this work.

A universal procedure for raw eye movement data processing.
Methods and algorithms for raw eye movement data processing
Preliminary inspection of raw eye movement data
Parameters of eye movement are all collected and recorded in eye-tracker–fixed coordinate. Different eye-trackers have different equipment-fixed coordinates; it is necessary to check the range of parameter values first. For eye-tracker presented in Figure 1, the range of parameter values should obey the principles listed as follows:
z-axis coordinate of eye position (3D) should be positive when record is valid.
z-axis coordinate of gaze position (3D) should be negative when record is valid.
Pupil diameter should be positive when record is valid.
For valid record, eye relative position should be in the range defined by eye-tracker.
The four restrictions should be checked first to ensure that collected raw data are reliable. While any one of them is not satisfied, record validity label should be changed from valid to invalid. The change on record validity is of great significance. Records remarked with invalid label mean eye-tracker cannot track eyeballs correctly and this record is not useful.
The checking and correction of practical sampling frequency
It was found that practical sampling frequency is not equal to eye-tracker’s designed one. It fluctuates up and down and varies with an unpredictable amplitude. Due to the variable sampling frequency, the number of records in each second is not consistent. This makes data processing quite complicated, especially the synchronization of eye movement data and other data types.
A section of practical records is presented in Figure 4. Compared with ideal sampling moment, the practical sampling moment may be early (situation marked 1), late (situation marked 4), filled with none record (situation marked 3), or filled with more than one record (situation marked 2). By the correction of practical sampling frequency, there will be one record for each ideal sampling moment, as shown in Figure 4.
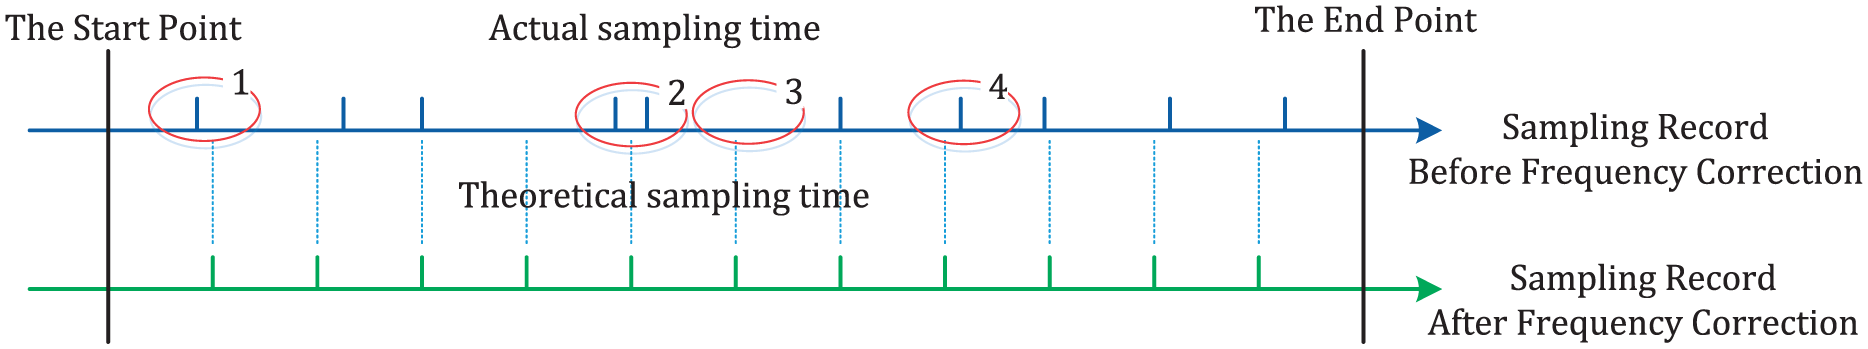
A section of practical records.
The correction process is listed as follows:
Record eye-tracker’s designed sampling frequency, which is expressed as F in this article. At the same time, gather the start and end time of eye-tracking experiment, which are labeled as TS and TE, respectively.
Calculate the number of ideal records and allocate sampling moment for each one. The number of ideal records is presented as follows

For each ideal record, its sampling moment can be written as follows
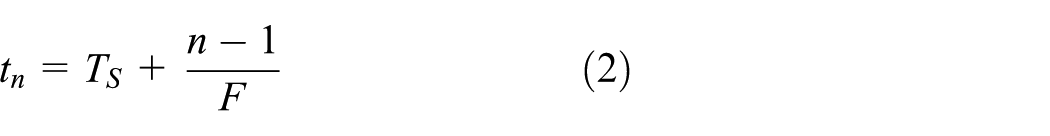
It should be mentioned that there is only one sampling moment for each ideal record. At the very beginning, parameter values of each record are all set to be blanks.
3. For each ideal record, find the practical records closest to it. Assign the closest practical record to each ideal one and fill blanks of the ideal record using parameter values of the assigned practical one.
Compare sampling moment of the ideal record and that of the assigned practical one. If time difference between the ideal and the practical one is less than or equal to 1/2F, this practical record was assigned to the ideal one, and its parameter values were used to fill the blanks of the ideal record. If time difference between them is more than 1/2F, there is no practical record corresponding to this ideal one. For this situation, parameter values of the ideal record still remain zero or blanks, except for its record validity. Record validity of this ideal record was marked as invalid. If there are more than one practical records corresponding to this ideal one, record collected earlier was assigned to the ideal record.
A section of records after frequency correction is presented in Figure 5. It is quite clear that there is a small time offset for each practical record after frequency correction. By frequency correction, the number of records in each second is equal to the equipment-designed sampling frequency.
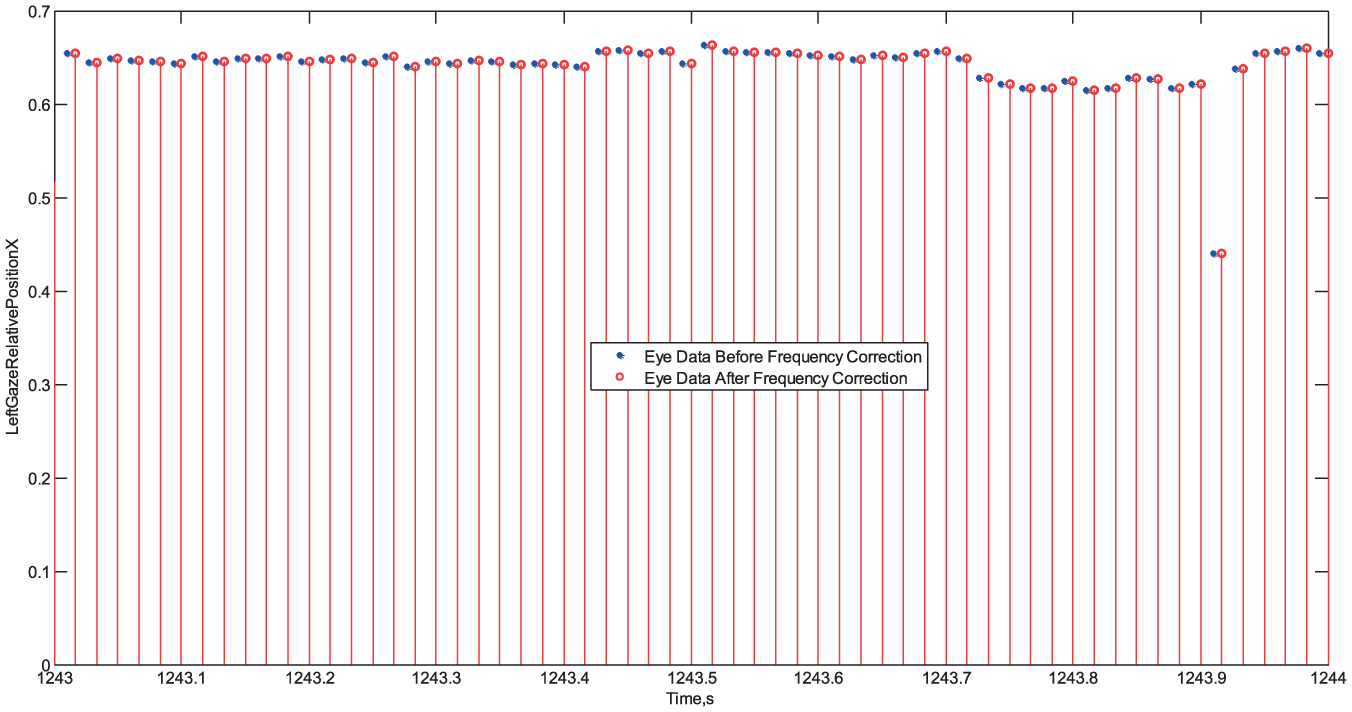
A section of records before and after frequency correction.
The selection of eye movement data
Both left and right eyes were tracked by eye-tracker in an eye-tracking experiment. Hence, eyeball position, gaze position, pupil diameter, and record validity for both left and right eyes were recorded. Due to the fact that target information can be obtained by eye movement data of either left or right eye, it is essential to select eye movement data that were used to identify visual fixations.
It has been studied by lots of researchers that human eyes do not play functions equally. One eye develops better and works harder, and visual information captured by this eye could be transported to the brain much quicker. This one is named as dominant eye, and the other one is named as auxiliary eye. The dominant eye plays a major role when judging and recognizing surroundings. Thereafter, if observer’s dominant eye is known, eye movement data of this eye will be a good choice to identify visual fixation.
If observer’s dominant eye is not known, eye movement data of both left and right eyes will be used to identify different types of eye movements. Under this situation, there will be two choices. For the first choice, average of eye movement data of both eyes was calculated. If record for left or right eye is invalid, only eye movement data of the valid tracked eye were used, eye movement data will be that of the valid tracked eye. If records for both left and right eyes are invalid, eye movement data are set to be zero or blanks. This method was named as average of both eyes. It could be described as follows:
For the jth record, both eyes were tracked validly,
For the jth record, only left eye was tracked validly,
For the jth record, only right eye was tracked validly,
For the jth record, both eyes were badly tracked,
Where i presents different parameters, Pij is the calculated parameter value in the jth record, PLij is the collected parameter value of left eyes in the jth record, and PRij is the collected parameter value of right eye in the jth record.
The difference between the first choice and the second one mainly focuses on the solution of eye movement data when only one eye is tracked validly. For the second method, if record for left or right eye is invalid, eye movement data are set to be zero or blanks. Only records when both left and right eyes were tracked validly were used to calculate the average. The second method was named as strict average of both eyes. It could be described as follows:
For the jth record, both eyes were tracked validly,
For the jth record, at least one eye was badly tracked,
Small gaps filled-in
In the process of sampling frequency correction, the number of practical records is usually smaller than that of ideal records, which means that some ideal records will be labeled invalid. Combination with the fact that some practical records are actually useless while it was not assigned to any ideal record, ideal records with invalid label were brought into the cluster of valid records, as shown in Figure 6. The duration of gap is quite short, but the cluster of valid records was disturbed. Therefore, gaps should be picked out and parameter values of records in the gaps should be interpolated.
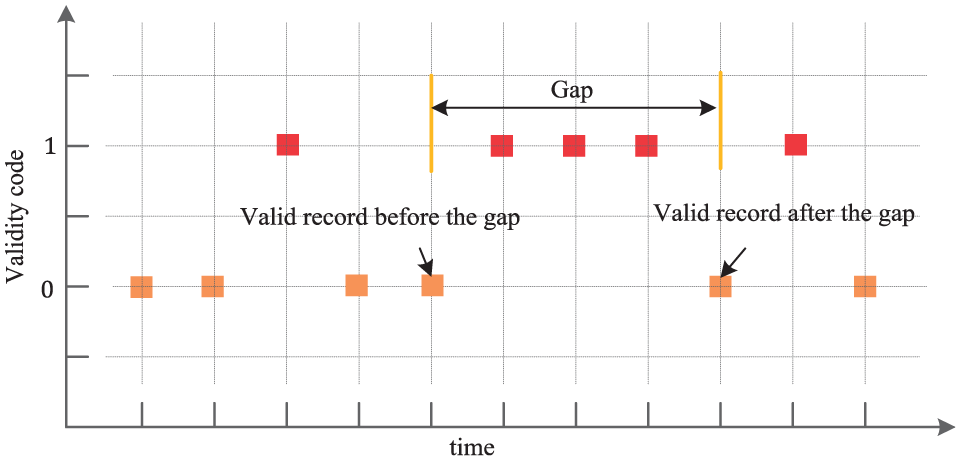
Record validity after sampling frequency correction.
However, not all gaps should be interpolated. Gaps caused by blinks, tracking failure, and so on, are not suitable to be filled in. In general, these gaps will last for quite a long time. However, gaps caused by frequency correction are very short. Therefore, these two situations are easily to be distinguished from each other. It was discovered that the maximum blink duration is about 75–425 ms. Therefore, 75 ms was employed to judge whether gaps can be filled in or not. For gaps, the duration time of which is shorter than 75 ms, interpolation should be applied on.
Linear interpolation was employed to calculate parameter values of records in gaps, which is presented as follows

where Pgap is the parameter value of records in gaps, Pf is the parameter value of valid record before the gap, Pa is the parameter value of valid record after the gap, Tf is the sampling moment of valid record before the gap, Ta is the sampling moment of valid record after the gap, and Tgap is the sampling moment of records in gaps.
One kind of eye movement data of records in gaps after linear interpolation is shown in Figure 7. It is obvious that gaps caused by frequency correction were filled in, while the others were not. It can be seen that the interpolated eye movement data will have the same characteristics.

Gaps filled-in by linear interpolation.
Data filtering
The high sampling frequency of eye-tracker ensures accurate tracking. It brings noise at the same time. Therefore, data filtering or smoothing was necessary.
A section of records is presented in Figure 8. Eye movement in the AB and CD part is well recorded, while the BC part is a gap. For records section shown in Figure 8, filtering was conducted on the AB and CD parts, and the BC gap is not processed.

A section of records which was disconnected by gaps.
Moving average and moving median method were commonly used in data smoothing. Both methods were used to smooth eye movement data, and the results are given in Figures 9 and 10. It is quite clear that smoothing results obtained by these two methods are quite similar.

Eye movement data filtered by moving average.
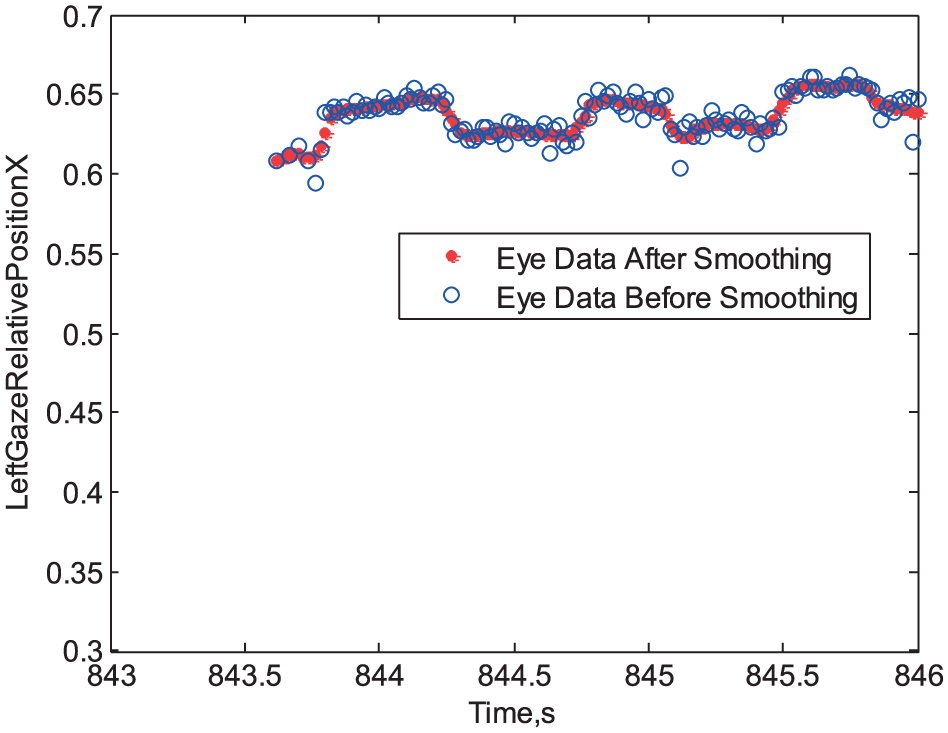
Eye movement data filtered by moving median.
A more careful examination on smoothing results was carried out to investigate their corresponding root-mean-square error (RMSE). The calculation results are listed in Table 2. It indicates that both smoothing methods can obtain good results.
RMSE for moving average and moving median method.

RMSE: root-mean-square error.
Fixation identification
Drawing visual fixations from raw eye movement data is an important job, which had been studied for several decades. While all types of eye movements are included in eye movement data, fixation identification significantly reduces the size and complexity of eye movement protocol. It removes saccades and collapses fixations into a single representative tuple.
Until now, many algorithms were developed to identify fixation points from eye movement data, such as I-VT (velocity–threshold identification), I-HMM (HMM identification), I-DT (dispersion–threshold identification), I-MST (MST identification), and I-AOI (area of interest identification). Characteristics of each algorithm are presented in Table 3.
Characteristics of fixation identification algorithms.

I-VT: velocity–threshold identification; I-HMM: HMM identification; I-DT: dispersion–threshold identification; I-MST: MST identification; I-AOI: area-of-interest identification.
I-VT method uses angular velocity to identify fixation points. Based on the low motion velocity of visual fixation, researchers assumed that angular velocity of eye movement in 3D space smaller than a given threshold could be defined as fixation, while those bigger than the threshold would be defined as saccade. Therefore, angular velocity of eye movement was calculated and compared with the given threshold. Normally, threshold commonly used was 20°/s or 30°/s. Some also thought that the threshold of 10°/s could define a more accurate result. Velocity–threshold identification is the most convenient method to distinguish fixation points. By this method, only motion velocity is considered.
I-DT model takes the distribution or spatial proximity of gaze position into account. It has been found that fixation points are usually spatial clustered, and observer’s focus on the target needs to last at least 100 ms. Hence, I-DT method used the characteristics of spatial cluster and long enough duration of visual fixation to identify fixation points. The minimum duration of visual fixation usually uses 100 ms, and the dispersion–threshold usually uses angular velocity as a measure indicator. The value of dispersion–threshold is influenced by experiment settings, it should be determined by the distance from eye-tracker to the screen where gaze points are reflected on. Dispersion-threshold method considers both duration and spatial proximity characteristics of fixation points, and the solution process is much more complicated than that of the I-VT method.
I-VT and I-DT were the most commonly used fixation identification methods. While the purpose of this article is to propose a procedure on raw eye movement processing, only I-VT and I-DT were discussed and used to identify fixation points. Fixations identified by I-VT and I-DT are plotted in Figure 11. The comparison results of these two methods are listed in Table 4.

Fixation identified by I-VT and I-DT methods: gaze relative position (a) in y-axis and (b) in x-axis.
The comparison of I-VT and I-DT methods.

I-VT: velocity–threshold identification; I-DT: dispersion–threshold identification.
Figure 11 reveals that fixation points identified by I-VT and I-DT methods are quite similar. Table 4 gives a much more detailed comparison between fixation points identified by I-VT and I-DT methods. It can be seen that the number of fixation points identified by I-VT method is smaller than that identified by I-DT method. At the same time, average fixation duration and ratio obtained by I-VT method are both larger than those obtained by I-DT method. Therefore, it can be concluded that fixation points obtained from I-DT method are much more scattered. While one fixation point which has quite long duration was identified by I-VT mehtod, there may be two or three fixation points that have shorter durations which were identified by I-DT method at the same time and at the same position.
It also can be seen that only one parameter was used in I-VT method, while two parameters will be needed for I-DT method. Besides that, the dispersion threhold in I-DT method needs an adaptive adjustment for each experiment, and the adjustment process is of great difficulty and complexity. Therefore, the I-VT method is acutally used in the fixation identification job.
Fixation points obtained by different selection of eye movement data
As mentioned in section “The selection of eye movement data,” the selection work of eye movement data should be done before drawing fixation points from raw eye movement data. As long as observer’s domain eye is known, it will be a better choice to use data of dominant eye to obtain types of eye movements. While dominant eye is not known, eye movement data of average or strict average of both eyes will be used to conduct eye movement processing.
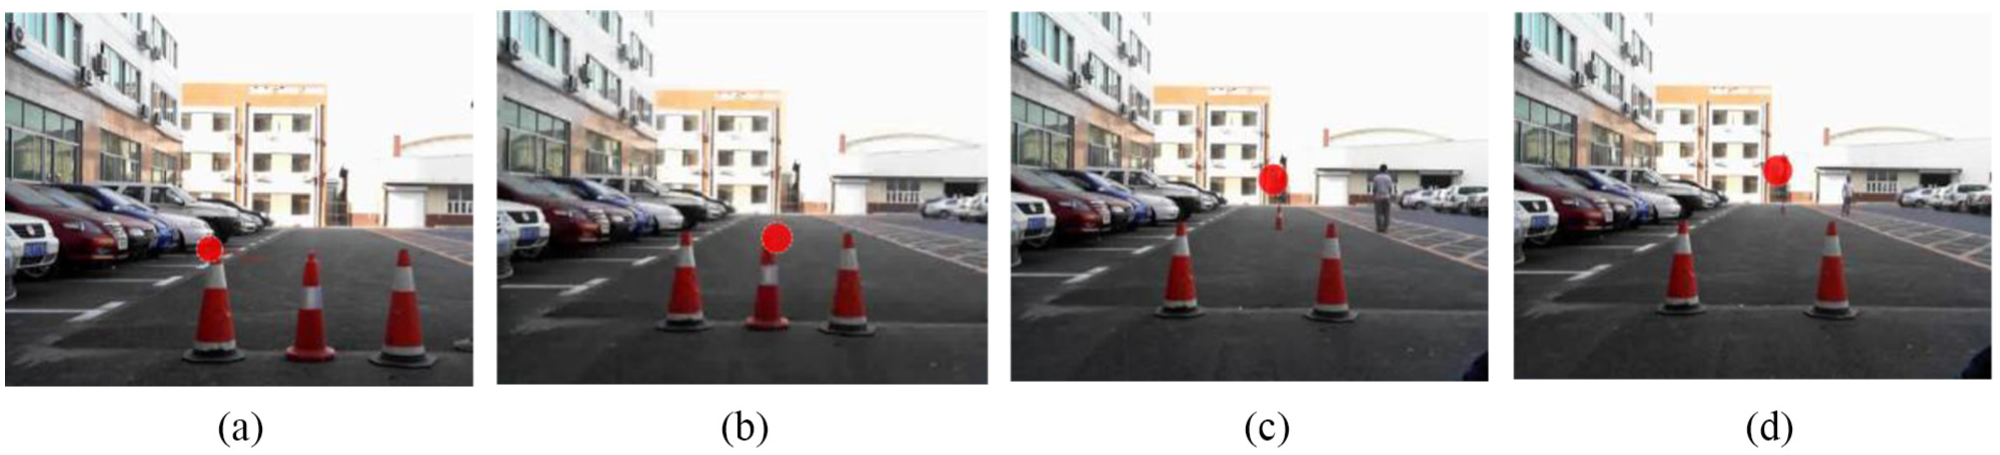
A field eye-tracking test was performed to record eye movement. The collected data were used to investigate the impact of eye movement data selection on fixation identification. During the test, driver was asked to fix his focus on the front vehicle. Furthermore, test to pick out driver’s dominant eye was carried out. It turns out that the driver has right eye to be dominant one. Fixation points drew from eye movement data of left eye, right eye, average, and strict average of both eyes are plotted in Figure 12.

Fixation points drawn from different selection of eye movement data: (a) left eye, (b) right eye, (c) average of both eyes, and (d) strict average of both eyes.
Ratio of total fixation duration to experiment time is obtained and listed in Table 5. It is quite clear that the ratio acquired when eye movement data of right eye were used to identify fixations is the biggest, while that acquired when eye movement data of left eye were used to identify fixations is the smallest.
Ratio of total fixation duration to experiment time under different selection of eye movement data.

It can be concluded that fixation points drawn from eye movement data of right eye, average of both eyes, and strict average of both eyes are quite similar. The difference between results obtained from eye movement data of right eye and the strict average of both eyes is almost negligible. However, fixation points drawn from eye movement data of left eye have a rather big difference with the others. The results prove that eye movement data of dominant eye are the best choice to conduct identification of types of eye movements. Otherwise, eye movement data of average or strict average of both eyes will be a better choice.
Validity analysis of processing on raw eye movement data
Experiment design
To examine the correctness of the processing procedure on raw eye movement data, a paradigm test was designed to track observer’s eye movement purposely. The paradigm test is shown in Figure 13.

A paradigm test designed to check the correctness of the processing on eye movement data.
In the eye-tracking experiment, observer was asked to focus his fixation on test points. The test points were arranged with equal interval. The distance between observer and test point, as well as the time when fixation behavior began and finished, was recorded. For each test point, observer was asked to gaze this target for at least 5 s. The paradigm test was carried out for several times to obtain a stable eye movement. Eye-tracking results obtained were used to conduct data processing (Table 6).
Duration of eye movement collection in the paradigm test.

The observer’s dominant eye was tested before the experiment. The observer has left eye to be the dominant one, and eye movement data of left eye were used to conduct data processing. Eye-tracker used in the experiment has designed sampling frequency of 60 Hz. This value was used to correct practical sampling frequency. Besides, angular velocity threshold of 30°/s was used to identify fixation points.
Experimental data processing
Eye movement data of left eye were used to draw observer’s fixation points. Results are presented in Figure 14. When the distance from observer to the target is quite close, fixation points could accurately reveal participant’s fixation target. However, with the increase in distance, fixation points plotted on the scene picture could not coincide well with participant’s fixation target, and the derivation between fixation point and the target grows gradually.
Fixation points obtained by eye movement data of left eye: (a) fixation target is close, (b) fixation target is quite close, (c) fixation target is distant, and (d) fixation target is quite distant.
The direction of gaze sight was also investigated in the paradigm test. Yaw and pitch angles were used to express the direction of gaze sight in eye-tracker–fixed coordinate. In yaw angle, gaze sight rotates on z-axis, whereas in pitch angle, gaze sight rotates on x-axis, as shown in Figure 15. They can be expressed as follows


where H is the height of gaze point, L is the lateral position of gaze point, and D is the longitudinal distance of gaze point.

The direction of gaze sight in eye-tracker–fixed coordinate.
Yaw and pitch angles of gaze sight in the paradigm test were calculated, as shown in Figures 16 and 17. For pitch angle, its value increases gradually with experiment time passes and the distance between observer and test point increases. This phenomenon suits the practical situation. For yaw angle, it oscillates around zero, which means that observer’s gaze sight almost inclines with z-axis.

Pitch angle of gaze sight.

Yaw angle of gaze sight.
By pitch angle, the distance from observer to test point can be approximately expressed as follows

Therefore, the distance between observer and test point is calculated and presented in Figure 18.

Distance between observer and test point, which was obtained by pitch angle of gaze sight.
To present calculation results clearly, distance obtained by pitch angle for each test point is plotted in Figure 19. The red dots indicate distance obtained by pitch angle and the blue line indicates the designed distance. It is quite clear that the distance obtained using pitch angle is not a constant value. Besides, when the distance is quite small or quite large, the derivation between calculated result and the designed distance is quite big.

Distance obtained by pitch angle for each test point: distance for (a) test point 1, (b) test point 2, (c) test point 3, (d) test point 4, (e) test point 5, (f) test point 6, (g) test point 7, (h) test point 8, and (i) test point 9.
The comparison of the calculated result and the designed distance are presented in Table 7. It is quite clear that distance obtained by pitch angle could reflect the practical situation in a limited range. In this eye-tracking test, the range is about 10–19 m. While test points are set too close or too distant, the calculation results lead to a great error with practical situation. Hence, the spatial distance obtained by eye movement data is not suitable in the whole range but acceptable in a limited range.
The comparison of distance obtained by pitch angle and the designed one.

Conclusion
Raw eye movement data collected by eye-trackers cannot be used to draw fixation points directly due to the defects existed in them. By checking on raw eye movement data, it was discovered that the actual sampling frequency is not equal to eye-tracker’s designed one. The actual sampling frequency varies in a wide range, and the number of records in each second differs a lot. The irregular sampling frequency brings huge disadvantage on fixation identification, and hence, a pre-process on raw eye movement data was needed.
A universal procedure for raw eye movement data processing was designed thereafter. The whole procedure includes preliminary inspection of raw eye movement data, the checking and correction of practical sampling frequency, the selection of eye movement data used to identify different types of eye movements, small gaps filled-in, data filtering, and fixation identification. The purpose of preliminary inspection is to check data validity and change the validity state of unpleasant records. By the checking and correction of sampling frequency, the fluctuated sampling frequency in actual experiment was adjusted to keep constant. Furthermore, it is the most import step in the whole processing due to the fact that it makes the irregular sampling records turning into regular. While eye movement data of both left and right eyes can be used individually to draw fixation points, it was an essential work to select movement data before types identification. The work of small gaps filled-in and data filtering was brought out by frequency correction. By doing these steps, problems existing in raw eye movement data can be fixed. While the raw data have been processed, fixation points in eye movement can be identified to research observer’s visual characteristics.
To prove the correctness of the processing on eye movement data, a paradigm test was designed and eye movement was tracked in the experiment. Raw data collected by eye-tracker were processed by procedure proposed in this article, and the fixation points and the direction of gaze sight were obtained. It turns out that the processing on raw eye movement data is reliable, and the fixation points obtained could reflect observer’s interests or gaze target. Besides that, pitch angle of gaze sight that was obtained from eye movement data could be used to measure distance from observer to the gaze target in a limited distance range.
Through this study, the following conclusions are obtained:
Deflections in raw eye movement data were mainly caused by the high sampling frequency of eye-trackers and its unstable character in working.
Procedure on raw eye movement data processing proposed in this article was composed by preliminary inspection, the checking and correction of practical sampling frequency, the selection of eye movement data, small gaps filled-in, and data filtering. The checking and correction of practical sampling frequency is the most important step. The effectiveness of proposed procedure was verified by a paradigm test.
The proposed universal procedure on raw eye movement data is an important guarantee to carry out research on eye movement analysis.
Footnotes
Acknowledgements
The authors wish to thank King-Far International Inc. Technology Center for providing eye-tracker and professional suggestions on experiment design.
Handling Editor: Xiaobei Jiang
Declaration of conflicting interests
The author(s) declared no potential conflicts of interest with respect to the research, authorship, and/or publication of this article.
Funding
The author(s) disclosed receipt of the following financial support for the research, authorship, and/or publication of this article: This research is supported by National Natural Science Foundation of China (51578262) and CES-Kingfar Excellent Young Scholar Joint Research Funding.