
Abstract
Objective
The aim of this study is to assess the relationship between eye-tracking measures and perceived workload in robotic surgical tasks.
Background
Robotic techniques provide improved dexterity, stereoscopic vision, and ergonomic control system over laparoscopic surgery, but the complexity of the interfaces and operations may pose new challenges to surgeons and compromise patient safety. Limited studies have objectively quantified workload and its impact on performance in robotic surgery. Although not yet implemented in robotic surgery, minimally intrusive and continuous eye-tracking metrics have been shown to be sensitive to changes in workload in other domains.
Methods
Eight surgical trainees participated in 15 robotic skills simulation sessions. In each session, participants performed up to 12 simulated exercises. Correlation and mixed-effects analyses were conducted to explore the relationships between eye-tracking metrics and perceived workload. Machine learning classifiers were used to determine the sensitivity of differentiating between low and high workload with eye-tracking features.
Results
Gaze entropy increased as perceived workload increased, with a correlation of .51. Pupil diameter and gaze entropy distinguished differences in workload between task difficulty levels, and both metrics increased as task level difficulty increased. The classification model using eye-tracking features achieved an accuracy of 84.7% in predicting workload levels.
Conclusion
Eye-tracking measures can detect perceived workload during robotic tasks. They can potentially be used to identify task contributors to high workload and provide measures for robotic surgery training.
Application
Workload assessment can be used for real-time monitoring of workload in robotic surgical training and provide assessments for performance and learning.
Keywords
Introduction
Compared with traditional open surgery, minimally invasive surgery (MIS) offers potential benefits of smaller incisions, reduced infection risks, decreased postoperative pain, and shortened patient recovery time (Fuchs, 2002; Verhage, Hazebroek, Boone, & Van Hillegersberg, 2009). Despite benefits, early MIS techniques like laparoscopic surgery have been observed to increase mental and physical workload (Berguer, Chen, & Smith, 2003; Berguer, Forkey, & Smith, 2001; Hemal, Srinivas, & Charles, 2001; Yu, Lowndes, Thiels, et al., 2016) due to limitations in tactile sensation, video displays, interface design, and the disconnection of separating the surgeons’ hands from target organs (Ballantyne, 2002; Hamad & Curet, 2010; Lowndes & Hallbeck, 2014; Yu, Lowndes, Morrow, et al., 2016).
Advances in robotic surgical systems have the potential to address some of the ergonomic limitations observed in laparoscopic surgery (Moorthy et al., 2004; Yu et al., 2017) by providing increased dexterity, adjustable console positions, and stereoscopic visualization (Lanfranco, Castellanos, Desai, & Meyers, 2004). Yet, mental workload in robotic surgery may be a greater concern due to increased technique complexity, unique interfaces, and the disconnection with the surgical team (Catchpole et al., 2019; Weber, Catchpole, Becker, Schlenker, & Weigl, 2018; Yu et al., 2017). For example, similar to laparoscopic surgery, flow disruptions in robotic surgery have been observed to occur frequently, and disruption severity has been associated with increased self-reported workload (
Several studies have attempted to objectively measure surgeons’ workload during robotic surgery. Physical workload has been measured using surface electromyography and motion tracking sensors (Lee et al., 2014; Yu et al., 2017; Zihni, Ohu, Cavallo, Cho, & Awad, 2014). Measurement of perceived workload is more limited and has primarily focused on self-reported methods, for example, National Aeronautical and Space Administration Task Load Index (NASA-TLX; Lee et al., 2014) and Surgery Task Load Index (SURG-TLX; Moore et al., 2015). These measures have been successful in distinguishing mental workload between surgical techniques, team roles, and experience level. However, subjective approaches have potential bias (e.g., inter-subject variability and the ability to self-assess), disrupt the surgical task, and are available at the completion of the case when they are typically administered (Carswell, Clarke, & Seales, 2005; Miller, 2001; Young, Brookhuis, Wickens, & Hancock, 2015). Continuous and objective measures are needed to reliably detect specific events that increase perceived workload and to provide feedback to enhance learning.
With advances in wireless sensors and signal analytics, physiological measures are becoming more feasible in the operating room and can provide objective approaches to continuously monitor surgeons’ workload without interfering intraoperative work (Dias, Ngo-Howard, Boskovski, Zenati, & Yule, 2018; S. Liu et al., 2018; Yu et al., 2017). The relationship between physiological measures and mental workload has been published in many domains. Examples of physiological measures include pupillometry, blink rate, heart rate variability (HRV), and electroencephalograms (EEGs). Applications of EEG to surgery workload are still nascent, and preliminary works have shown that EEG metrics correlated with objective performance and perceived workload during robotic procedures (Guru, Esfahani, et al., 2015; Guru, Shafiei, et al., 2015). However, the extensive setup time, intrusive setup procedure, and susceptibility to motion/muscle artifacts have limited EEG’s application and reliability in the fast-paced and dynamic surgical environment (Ayaz et al., 2012; Cao, Chintamani, Pandya, & Ellis, 2009; Miller, 2001). Heart rate sensors are easier to implement and have been frequently used to infer workload (Moore et al., 2015; Roscoe, 1993). However, emotional stimulus and physical workload could also increase heart rate (Jorna, 1992, 1993), and many studies have noted that HRV might not be sensitive enough for measuring mental workload (Gabaude, Baracat, Jallais, Bonniaud, & Fort, 2012; Nickel & Nachreiner, 2003).
Similar to the aforementioned physiological measures, eye-tracking metrics have also shown strong associations with perceived workload in other domains (Beatty, 1982; de Greef, Lafeber, van Oostendorp, & Lindenberg, 2009; Marquart, Cabrall, & de Winter, 2015). With advances in wireless and wearable sensors, this approach may address some of the usability and reliability concerns of the other physiological modalities. In surgery, eye tracking has seen growing applications in training and evaluation (Henneman, Marquard, Fisher, & Gawlinski, 2017; Tien et al., 2014). These studies showed that gaze patterns differentiated between expert and novice surgeons (Khan et al., 2012; Wilson et al., 2010) and recommended projecting experts’ gaze patterns to trainees to improve their performance and accelerate the learning process (Chetwood et al., 2012; Wilson et al., 2011).
Preliminary works have also applied several eye-tracking metrics to measure surgical workload. For example, peak pupil size increased with task difficulty while novices transported rubber objects over dishes with different target sizes and distances (Zheng, Jiang, & Atkins, 2015). Lower blink frequency range was associated with higher NASA-TLX ratings during simulated laparoscopic tasks (Zheng et al., 2012). In addition, blink rate was higher for experts than novices during the cutting phase of simulated microsurgery although it did not vary for any of the other phases (Bednarik, Koskinen, Vrzakova, Bartczak, & Elomaa, 2018). However, these studies were limited to basic skills tasks and laparoscopic techniques. The accuracy of eye-tracking measures for robotic tasks with more complex interfaces remains unknown. Research is needed to determine the impact of robotic interfaces and high technical complexity of telesurgery on eye-tracking technology’s implementation and its ability to predict workload.
This initial study aims to explore the relationship between perceived workload and eye-tracking metrics in robotic surgical tasks. Workload is manipulated by task difficulty, as perceived workload tends to increase with increased task demand (Marinescu et al., 2018; Miyake, 2001). We hypothesize that (1) eye-tracking metrics can predict trainees’ perceived workload and (2) eye-tracking metrics are sensitive to task difficulty levels.
Materials and Methods
Participants
This study was reviewed by the university’s institutional review board. The study population was surgical trainees who participated in robotic skills training (i.e., limited previous robotic experience). Eight surgical trainees from a large academic medical school were recruited voluntarily. All of the participants were right-hand dominant, four were female, and the mean (±standard deviation) age was 26 (± 1.6) years. None had prior clinical robotics experience. They performed robotics tasks (described later) periodically over the course of 4 months.
Robotic System and Tasks
The da Vinci Surgical System (dVSS; Intuitive Surgical, Inc., Sunnyvale, CA) was used at times when it was not needed for clinical procedures. The system consisted of a surgeon console with controls (e.g., foot pedals, master controls, and controls to adjust positioning) and tele-surgical robotic arms. The console also included a widely used simulation software (M-Sim®) provided by the da Vinci manufacturer, which enabled trainees to perform simulated exercises without physically activating the actual robotic arms. Both the console and the software were used in this study.
Tasks and difficulties were selected from the simulation software based on recommendations from the surgical education community. Interviews with experts in robotic surgery and medical education were used to select six tasks that can assess skills required to perform robotic surgery. These tasks required trainees to use camera control, endowrist manipulation, clutching, needle control, and needle driving to transfer or suture objects (Alzahrani et al., 2013; Perrenot et al., 2012). Depending on the specific task, up to three levels of difficulty were available in the simulation software, and all available levels were used in the study. A task at a certain level is referred to as an exercise in this paper. Preliminary task analysis based on the human processor model (Card, Moran, & Newell, 1986; Y. Liu, Feyen, & Tsimhoni, 2006) and Therbligs (Gilbreth & Kent, 1911) was conducted to briefly describe the task demands across task levels. The human processor model divides the task process into three discrete serial stages: perceptual, cognitive, and motor. For our tasks, these were translated into visual, cognitive, and manual demand of the task. Within each demand, actions were decomposed into basic motion elements defined by Therbligs. See Table A1 in the appendix for task descriptions and task demands. Task order was not randomized due to the curriculum-building nature of the training sessions, that is, simpler tasks were prerequisites of more advanced tasks. Based on the task order in previous studies (Finnegan, Meraney, Staff, & Shichman, 2012; Kenney, Wszolek, Gould, Libertino, & Moinzadeh, 2009), tasks were performed in the following order: Camera Targeting, Peg Board, Ring and Rail, Sponge Suturing, Dots and Needles, and Tubes. In each task, lower (easier) levels were presented before higher (more difficult) levels.
Data Collection
Performance data
The simulation software automatically assessed trainees’ performance based on several criteria, for example, task time, economy of motion, drops, instrument collisions, excessive instrument force, instrument out of view, and master workspace range (Perrenot et al., 2012), which was summarized as an overall score (0%–100%) with higher scores representing better performance. This overall score was recorded and used as the measurement of performance. Due to the design of the software, this overall score was displayed upon completion of each exercise, allowing the participant to see their performance score.
NASA-TLX
The NASA-TLX survey (Hart & Staveland, 1988) was used to assess perceived workload. The NASA-TLX contains six sub-dimensions of workload (mental demand, physical demand, temporal demand, performance, effort, and frustration) and each was rated on a visual analogue scale that ranged from 0 (very low) to 10 (very high). Scores from each dimension were summed to calculate the final NASA-TLX workload score, resulting in a final value between 0 and 60. Although a weighted NASA-TLX has also been used by other investigators, many studies have demonstrated a summed score as an acceptable implementation of NASA-TLX (Hart, 2006).
Eye-tracking metrics
A wearable eye-tracking system, Tobii Pro Glasses 2.0 (Tobii Technology AB, Danderyd, Sweden) was used to binocularly sample eye movements at 50 Hz. The eye-tracking device consisted of two major parts. A camera was located in the middle of the glass frame (outer side) to record the view of the scene while sensors were mounted in the inner side of the glass frame to capture eye movements and pupil diameter.
Pupil diameter and gaze points were continuously recorded by the system during sessions. Recordings were annotated using the Tobii Pro Lab Software (Tobii Technology AB) and extracted for further analysis. Four eye-tracking metrics were calculated from the raw data: pupil diameter (mean of left and right), gaze entropy, fixation duration, and percentage of eyelid closure (PERCLOS), defined as follows.
Pupil diameter
This metric was estimated by the eye-tracking system using images of the eyes. Previous work showed association between larger pupillary dilations and increased cognitive load (Beatty, 1982; Beatty & Kahneman, 1966; Granholm & Steinhauer, 2004; Palinko, Kun, Shyrokov, & Heeman, 2010; Pomplun & Sunkara, 2003).
Gaze entropy
It is an index that measured visual scanning randomness and was previously used as a measure of mental workload in aviation tasks (Harris, Tole, Stephens, & Ephrath, 1982; Tole, 1983). The rationale was that the exploration pattern became more random when workload increased, but divergent results had been reported in previous studies (Allsop & Gray, 2014; Di Nocera, Camilli, & Terenzi, 2007). It was adopted for the current study and calculated based on the Shannon entropy theory (Di Stasi et al., 2016; Shannon, 2001):
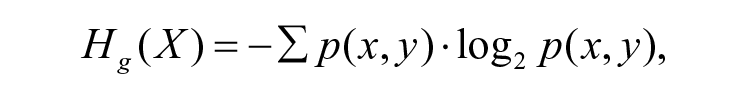
where
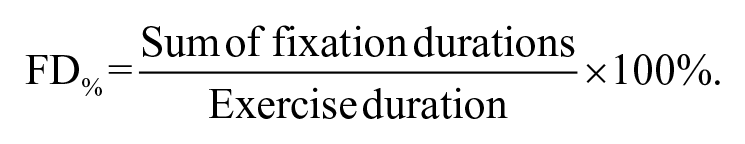
Fixation duration
It is the total amount of time spent in fixations. Studies had suggested that fixation duration reflected information processing load (Morris, Rayner, & Pollatsek, 1990; Reimer, Mehler, Wang, & Coughlin, 2010) and increased as workload increased (de Greef et al., 2009; Recarte & Nunes, 2000). We scaled the absolute time to the percentage of time in the exercise duration:
PERCLOS
In previous research, PERCLOS had been calculated as the percentage of time during which the pupils were covered by the eyelids by more than 80% of their area (Wierwille, Wreggit, Kirn, Ellsworth, & Fairbanks, 1994). Studies had shown that higher PERCLOS reflected increased fatigue and decreased vigilance (Marquart et al., 2015; Singh, Bhatia, & Kaur, 2011; Sommer & Golz, 2010). It had also been used as a machine learning feature to predict workload (Halverson, Estepp, Christensen, & Monnin, 2012; Tian, Zhang, Wang, Yan, & Chen, 2019). In this study, since the device did not support eyelid closure measurement, it was estimated by the percentage of time duration (per exercise) where neither left pupil nor right pupil was detected. Since participants’ head movements were constrained, this estimation was not confounded by participants looking away. It could be potentially confounded by missing data (lost pupil frames due to device malfunction), which was 1% for our device.
Study Procedure
This study was an exploratory study to determine the potential usage of eye tracking in robotic surgery, and a prospective observational study design was used. The number of sessions was not predetermined, and participants were observed every time they attended robotic training sessions over the 3-month study period. Data collection sessions were also scheduled based on robotic console availability. Participants were informed of the study at least 1 week in advance. Data collection was conducted when any participant confirmed attendance.
For each session, after arriving to the operating room, the participants reviewed a study information sheet and completed the demographic questionnaire. They were then fitted with the eye-tracking system. The system was calibrated at the beginning of each session. Baseline pupil diameter for the participants was collected following procedures recommended by previous work (Beatty & Lucero-Wagoner, 2000; Marshall, 2000; Mosaly, Mazur, & Marks, 2017). Specifically, each participant looked at the center of a white screen for 10 s (minimum diameter) and then a black screen (maximum diameter) for 10 s.
Instructions for basic operations of the console (e.g., functions of buttons, and foot pedals) were provided to all participants in their first session. Although they were allowed to familiarize themselves with the controls, no practice sessions on the study tasks were provided. During each task, the console would display pre-programmed messages on task goals and operations, and a researcher was present to address any questions or concerns throughout the session. In each session, participants were expected to perform 12 exercises. To maintain consistency with the trainees’ curriculum and system usage schedule, the time constraint of each session was 45 min. Therefore, considering participants’ skill and capability, advanced difficulty levels were not completed in the early phase of training. After completing each exercise, the participant completed a NASA-TLX survey. Eye-tracking data were continuously recorded throughout the entire session and post-processed in the Tobii Pro Lab software.
Statistical Analysis
Pupil diameter and gaze entropy were normalized using the feature scaling formula given following (Bo, Wang, & Jiao, 2006) to scale the data to the range of [0, 1], accounting for potential variation from individual differences in pupil diameter and pupil dilation. It also prevented a distortion in analysis caused by variable magnitude differences. Here, 0 denoted the minimum value for an individual and 1 denoted the maximum for an individual:

Repeated measures correlation tests,

Mixed-effects models were used to determine eye-tracking metric sensitivity to changes in task levels (difficulty). This approach accounted for random effects of subject and repeated measures by allowing varying intercept (Cnaan, Laird, & Slasor, 1997; Dingemanse & Dochtermann, 2013). Each task was fitted by separate models, resulting in five models (Task Tubes had only one level of difficulty, therefore the effect of difficulty was not tested). Significance level for all statistical analyses was set at
Classification
To explore the joint capability of various eye-tracking features for detecting high workload, the Naïve Bayes algorithm (Friedman, Geiger, & Goldszmidt, 1997) was used. The algorithm was based on Bayesian theorem:
Perceived workload levels were determined by categorizing the total NASA-TLX scores into either high or low workload. Although there is still much debate on what NASA-TLX threshold is considered “high workload,” some studies observed that scores above 50 to 55 (out of 100) may lead to increased performance errors (Colle & Reid, 2005; Mazur et al., 2014; Mazur, Mosaly, Hoyle, Jones, & Marks, 2013; Yu, Lowndes, Thiels, et al., 2016). Therefore, in this study, scores above 30 (out of 60) were categorized as high workload. Limited studies have discussed the threshold of low workload. In our training environment, low workload may indicate that the tasks were too easy. We assumed that the distribution of workload scores (n = 168) resembled a normal distribution (Grier, 2015), and the number of low workload instances were sampled to be the same as those in the high end. Scores in the middle were not used for classification considering that they were ambiguous and may not necessarily represent either high or low workload. A k-fold cross-validation procedure was used for model training and testing (Hastie, Friedman, & Tibshirani, 2001). Based on sample size, three folds were performed. A confusion matrix was used to determine the accuracy and sensitivity of eye metrics in predicting workload. All analyses were conducted in R (R Core Team, 2018; RStudio Team, 2016).
Results
A total of 15 sessions across all participants were collected over the study period. Two participants completed three sessions, three participants completed two sessions, and three participants one session. A total of 168 exercises were collected, including performance scores, NASA-TLX ratings, and eye-tracking features. Minimum exercises completed in a session was n = 8, and all participants completed each exercise at least once. For some sessions, participants did not complete all 12 exercises as explained in the “Materials and Methods” section. Average and standard deviation of exercise completion time was 194 ± 157 s. The standard deviation was large because difficult exercises took more time than easy exercises (Table 1).
Mean and Standard Deviation of Completion Time by Task and Level
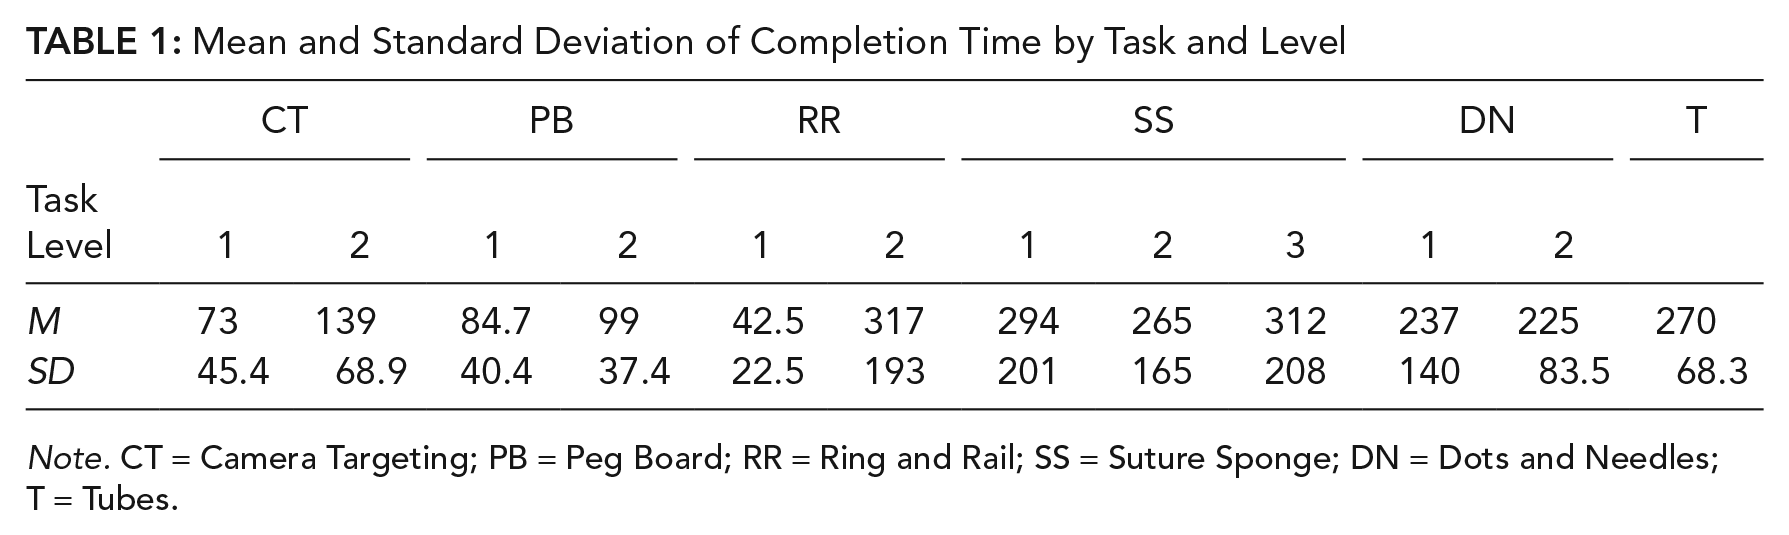
Note. CT = Camera Targeting; PB = Peg Board; RR = Ring and Rail; SS = Suture Sponge; DN = Dots and Needles; T = Tubes.
Workload and Task Performance
Repeated measures correlation was used to test the association between perceived workload (NASA-TLX rating) and task performance score. The correlation between NASA-TLX ratings and performance scores across all exercises (n = 168) was –.55 (p < .001), indicating that when workload was perceived to be high, performance was poorer.
Focusing on the relationship between workload and performance for each task, the correlations were significant for Ring and Rail (
Repeated Correlation Between NASA-TLX and (a) Performance and (b–e) Eye Metrics
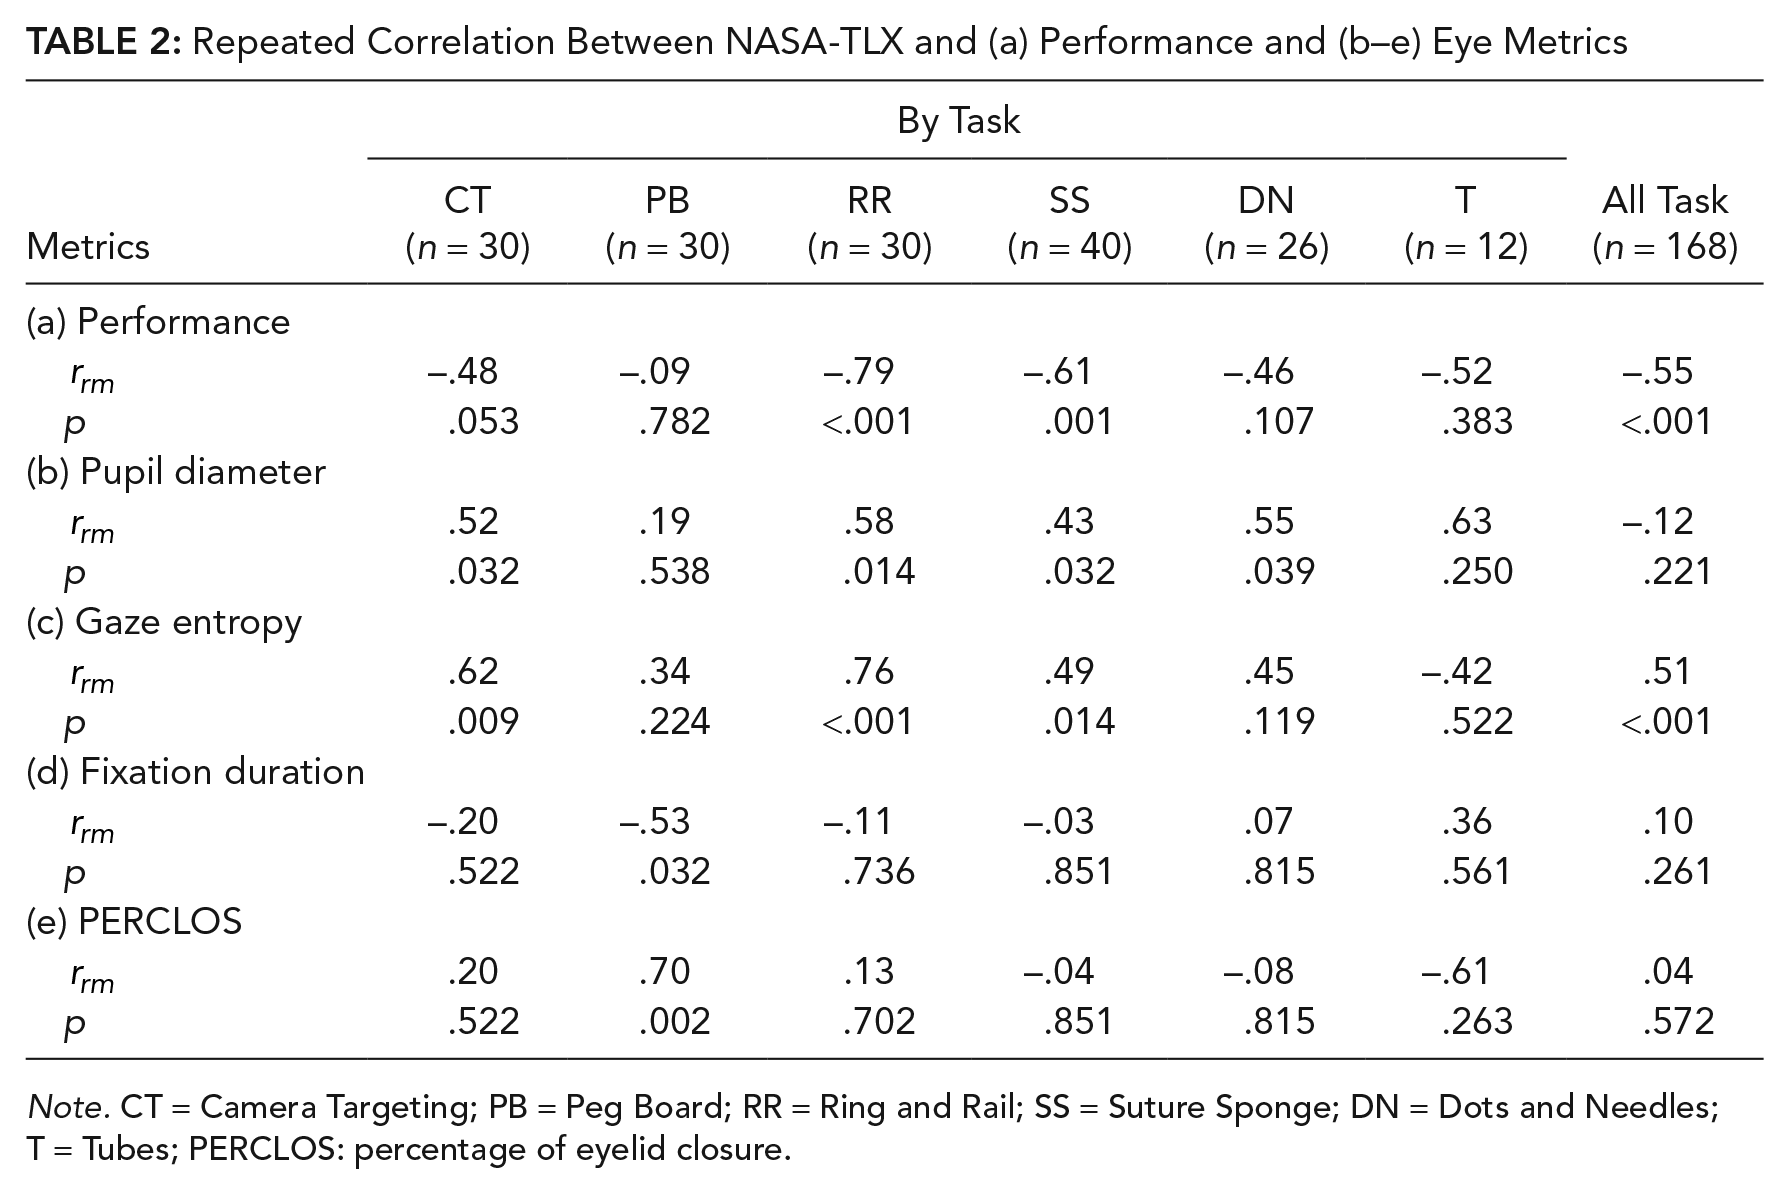
Note. CT = Camera Targeting; PB = Peg Board; RR = Ring and Rail; SS = Suture Sponge; DN = Dots and Needles; T = Tubes; PERCLOS: percentage of eyelid closure.
Workload and Eye-Tracking Metrics
Correlation values for other eye-tracking metrics with perceived workload are reported in Table 2 (b–e). Of the four eye-tracking metrics, only gaze entropy had significant correlation with NASA-TLX ratings (
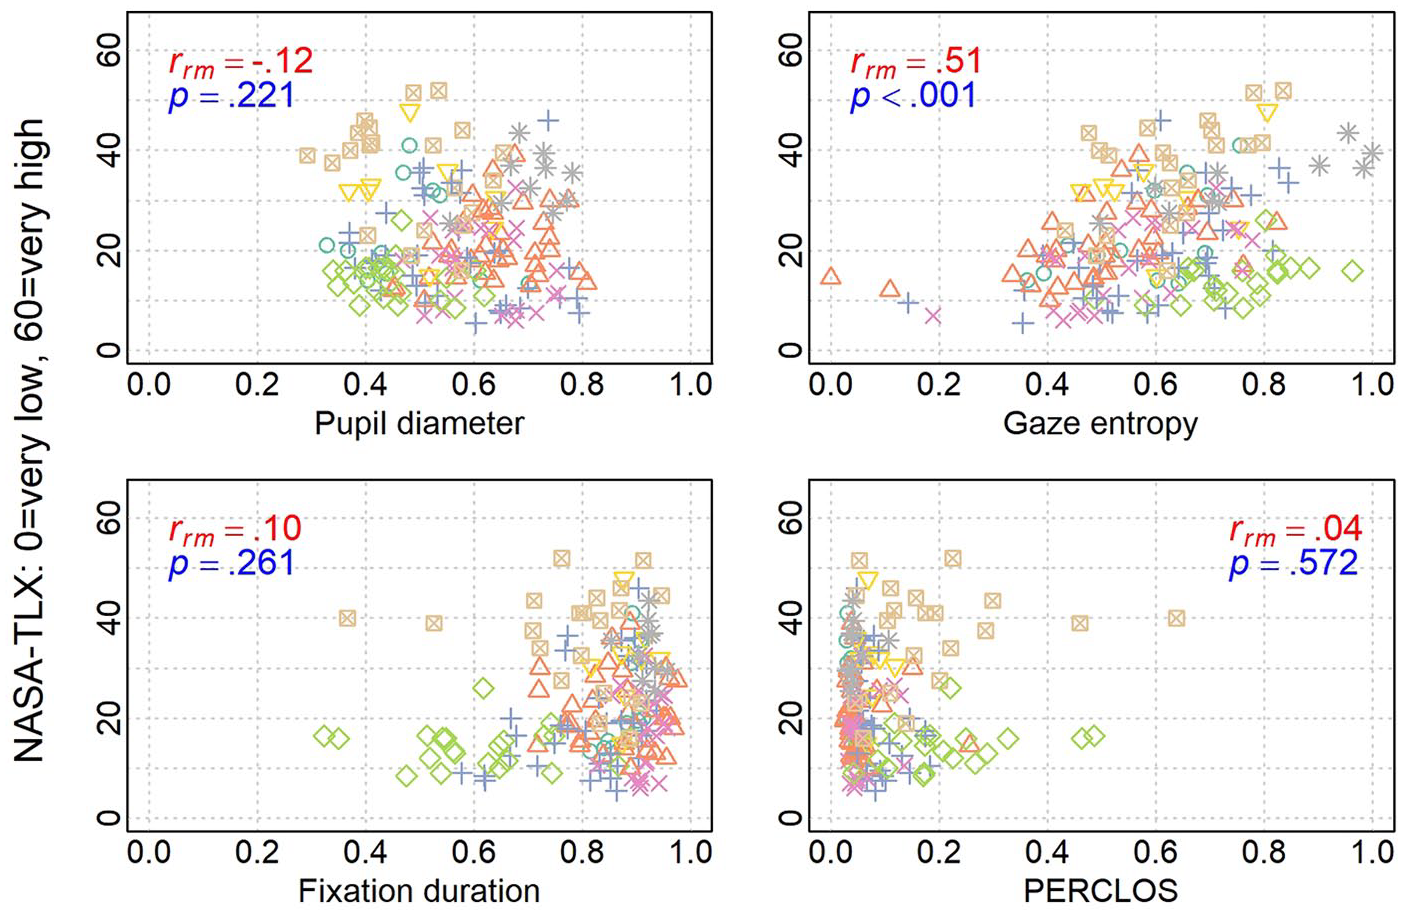
Distribution of eye-tracking measures over workload. Colored shapes represent different participant (only gaze entropy was significant with medium effect size). NASA-TLX = National Aeronautical and Space Administration Task Load Index; PERCLOS = percentage of eyelid closure.
Task Difficulty on Eye-Tracking Measures
Mixed-effects models were used to test eye-tracking metric sensitivity to changes in task difficulty. With task goal and skill remaining consistent, the simulator increased difficulty levels by incorporating additional task requirements, which was expected to influence workload (see Table A1). Since changes in difficulty levels varied by task, each task was fitted with a model separately. Results for mixed-effects models are shown in Table 3, excluding results for fixation duration and PERCLOS, which did not reach statistical significance.
Mixed Models Summary for Effects of Task Level (Level 1 Is Reference Group) on Eye-Tracking Metrics
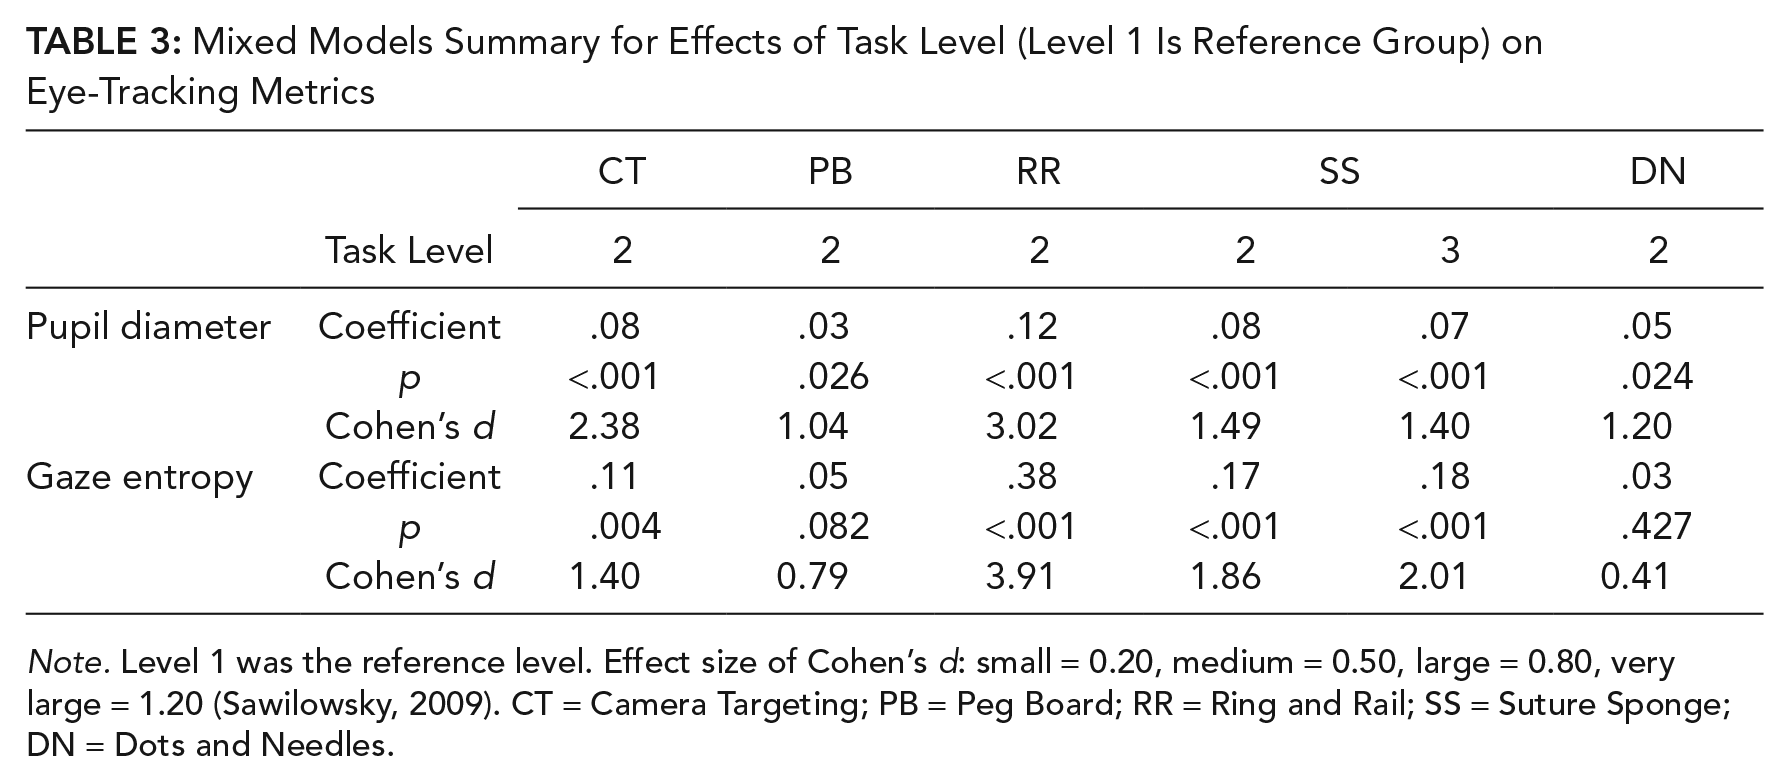
Note. Level 1 was the reference level. Effect size of Cohen’s d: small = 0.20, medium = 0.50, large = 0.80, very large = 1.20 (Sawilowsky, 2009). CT = Camera Targeting; PB = Peg Board; RR = Ring and Rail; SS = Suture Sponge; DN = Dots and Needles.
Increasing difficulty was observed to significantly increase pupil diameter for all tasks (all p-values <.05). The positive coefficients suggested that pupil diameters in Level 2 for all tasks were larger than that in Level 1. Level effects in tasks were very large (Cohen’s d) except for task Peg Board. However, when there were three levels of difficulty (Suture Sponge), a Tukey post hoc test suggested that there was no difference between Levels 2 and 3 (p = .964).
For gaze entropy, a significant effect of difficulty level was observed in the following tasks: Camera Targeting, Ring and Rail, and Suture Sponge. Based on Cohen’s d, effects were large in all of the three tasks. The positive coefficients suggested that gaze entropy in Level 2 was greater than that of Level 1. Gaze entropy between Levels 2 and 3 in task Suture Sponge was not significantly different. Mean value of all metrics are reported in Table 4 by task and difficulty level. NASA-TLX ratings were higher in higher level of difficulty.
Mean Value of All Metrics Across Task and Level
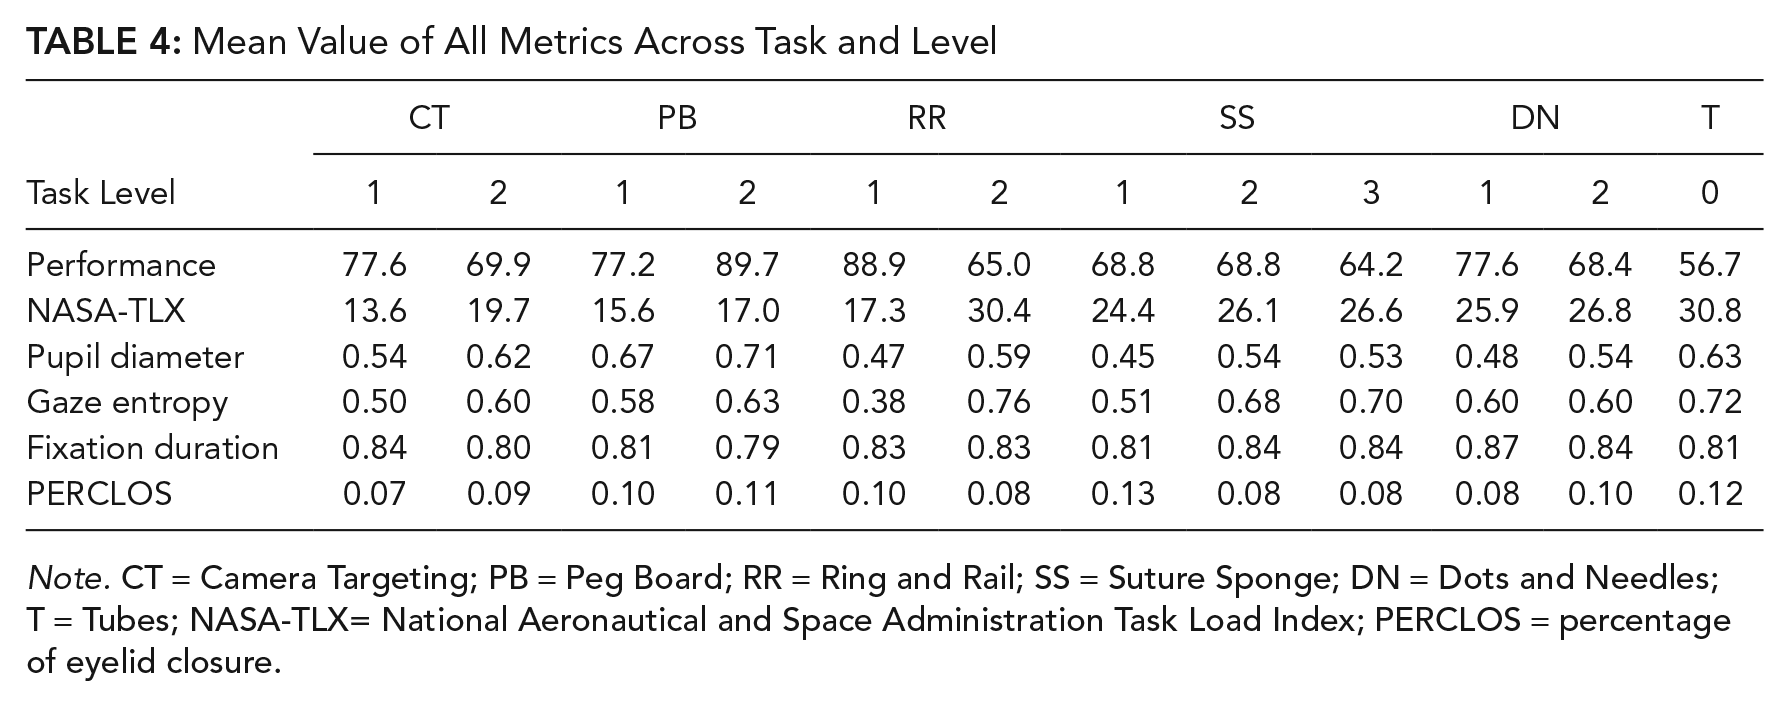
Note. CT = Camera Targeting; PB = Peg Board; RR = Ring and Rail; SS = Suture Sponge; DN = Dots and Needles; T = Tubes; NASA-TLX= National Aeronautical and Space Administration Task Load Index; PERCLOS = percentage of eyelid closure.
Workload Classification
There were 43 high workload instances with NASA-TLX scores above 30, which is the 75% quantile. The same number of instances (43) at the lowest end was labeled as low workload, which had values below or equal to 14.5 (25% quantile). Using the Naïve Bayes model, nine features were included to classify low/high workload: two demographic features (participant gender and trainee level [medical student/surgical resident]) and seven eye-tracking features (left/right pupil diameter mean, left/right pupil diameter standard deviation, gaze entropy, fixation duration, and PERCLOS). Average precision of eye-tracking measures in predicting workload was 82.8% and average classification accuracy was 84.7%. The confusion matrix for the three-fold cross-validations is presented in Table A2 in the appendix.
Discussion
Eye Metrics and NASA-TLX
This study investigated the relationship between eye-tracking measures and perceived workload in robotic surgery. The first hypothesis (eye-tracking metrics can predict the level of subjective workload) was tested with both correlation analyses and machine learning classification techniques.
Gaze entropy increased significantly as NASA-TLX ratings increased. Limited studies studied the impact of gaze entropy in robotic surgery, yet Di Stasi et al. (2016, 2017) showed that gaze entropy increased with laparoscopic surgical task complexity. They explained that without knowing the optimal visual exploration strategy, surgeons might follow a suboptimal approach, which caused gaze to move constantly, especially during complex tasks.
Although many studies reported increases in pupil diameter and fixation duration with increased workload, we found no significant correlations with NASA-TLX. One possible explanation may be the robotic infrastructure. The light condition inside the enclosed console was controlled and determined by the video display of the simulation. This environment differed from previous applications of these eye-tracking metrics and may have affected pupil diameter. PERCLOS had been more commonly linked to fatigue, yet also proposed as a measure for estimating workload (Halverson et al., 2012; Tian et al., 2019). When under prolonged states of low workload, a state of drowsiness can co-occur with a state of low attentional arousal. However, PERCLOS did not distinguish between task difficulty and perceived workload in this study. In this robotic training setting where participants were actively engaged, low arousal levels were unlikely, which can explain the low mean PERCLOS values observed.
The relationship between NASA-TLX ratings and physiological measures has been long studied, yet it remains debatable which one is a better measurement of workload. For perceived workload, NASA-TLX has been more widely used and recommended as a practical and accurate way for measuring surgeons’ workload (Carswell et al., 2005; Dias et al., 2018). Recent work by Matthews, Reinerman-Jones, Barber, and Abich (2015) found that many physiological measures as well as NASA-TLX ratings were sensitive to changes in workload, but their estimates were uncorrelated. They suggested that this was caused by individual differences or the failure of assuming workload as a unitary latent construct. Other studies explained that physiological methods gave more information on how individuals responded to workload instead of what was imposed on them (Cain, 2007; Meshkati, Hancock, Rahimi, & Dawes, 1995). Our results showed that gaze entropy was significantly correlated with NASA-TLX, supporting the assumption that a latent workload construct can be estimated by both subjective and physiological methods. However, there remained unexplained variability between our gaze entropy and NASA-TLX correlation, which supports the argument that workload is multi-factorial and each method measured unique information. Therefore, the machine learning classification approach was used to combine four eye-tracking measures and investigate whether they can estimate the same level of workload as the NASA-TLX does, but in a less disruptive way.
In the Naïve Bayes model, the nine features classified between low and high workload labels with an average accuracy of 84.7%. Similar work by Halverson et al. (2012) reported an accuracy range of 16%–98% using different model specifications. In Halverson’s study, there were two tasks: high workload tasks and low workload tasks, where participants needed to monitor more vehicles in the high workload task. In contrast, we did not classify the different tasks, but the different levels of perceived workload from the participants using their NASA-TLX ratings. This method is relevant to our research question of perceived workload and reflects the surgeons’/trainees’ capacity of dealing with task demand. Classification of workload is clinically helpful to surgical education. The eye-tracking technique is able to provide real-time feedback on trainees’ workload status, and the instances of high workload, which indicate when trainees are experiencing difficulty.
Eye Metrics and Task Difficulty
The second hypothesis tested was whether eye-tracking metrics can distinguish between varying work demands due to task difficulty level. The findings generally supported the sensitivity of eye-tracking metrics for distinguishing the differences. Mixed-effects models found significant level difficulty effects on pupil diameter and gaze entropy.
The phenomenon that pupil diameter was larger under higher level of difficulty agrees with previous studies in surgical laparoscopy (Zheng et al., 2012) and other domains (Beatty, 1982; Beatty & Kahneman, 1966; Granholm & Steinhauer, 2004; Palinko et al., 2010; Pomplun & Sunkara, 2003). Results for gaze entropy support the hypothesis that visual exploration becomes less fixed (i.e., the gaze pattern becomes more random) during more complex tasks.
Gaze Behavior in Robotic Surgery
Visual search is an indispensable step in robotic surgery. The task demands in this study were consistent with live robotic surgeries, where surgeons must rely on visual cues for completing the operation. These visual cues are delivered from the camera inside the patient that captures both current tissue states and robotic arm location. This information (e.g., current locations with respect to their desired target) is critical for planning actions necessary for completing the task goals. When searching for the target, trainees need to visually locate the target and also physically move controls to reach the target, which constitutes a source of workload. Thus, eye-tracking measures can directly provide data for understanding trainees’ task performance and learning process. For example, when trainees are unfamiliar with the environment, they may not adopt the optimal scanning strategy. As the task difficulty increases, they need more glances to compensate for the sub-optimal strategy. Similarly, when trainees are novice in console operations, they tend to make mistakes and need more movements to complete tasks. Therefore, quantitative eye metrics provide feedback regarding when the trainees’ visual behaviors are inefficient and when they experience high workload. Instructors can personalize training tasks to help trainees learn how to process visual cues and practice specific skills before proceeding to more complex tasks.
Although promising, future work is ongoing to address the current study’s limitations. For example, due to the curriculum-progression nature, task orders in this study were not randomized, which might produce order effects. In addition, the number of sessions and exercises for each participant was not controlled in the study; having a consistent number of sessions can improve analysis accuracy and contribute to the understanding of task learning curve. Although gaze entropy was a sensitive measurement in tasks that demanded exploratory visual search, it could be less reliable in other tasks. Eye metric interaction with visual skills, cognitive skills, and manual manipulation skills have not been explored in this study but could be of potential interest in further work.
Results from this study should be viewed as initial findings from an exploratory effort. One purpose of this paper is to inspire further works on glance patterns during acquisition of new robotic surgical techniques: to prompt other researchers to explore the use of glance metrics in training and assessing surgical robotics skills. Eye-tracking metrics can identify difficult phases during training and help with the curriculum design. It may also identify trainees who are experiencing unusually high workload and are in need of extra help. In the future, more complicated techniques may be used to identify high-level tasks (Lalys, Riffaud, Bouget, & Jannin, 2012) and decompose tasks and skills (Reiley & Hager, 2009), which will augment the interpretation of workload.
Key Points
Workload measurement techniques in surgery are primarily subjective, but eye tracking can be a less-intrusive, continuous, and objective workload measurement technique.
Task performance scores, NASA-TLX ratings, and eye metrics were collected. NASA-TLX was found significantly correlated with performance. Performance accounted for between 0.84% and 62.82% of variance in NASA-TLX ratings.
Gaze entropy was positively correlated with NASA-TLX during robotic surgical tasks. Gaze entropy accounted for between 17.51% and 38.53% of variance in NASA-TLX ratings.
Naïve Bayes Model using the eye-tracking metrics and demographic information distinguish between self-reported workload in high and low scenarios with on average 84.7% accuracy.
Footnotes
Appendix
Classification Confusion Matrix
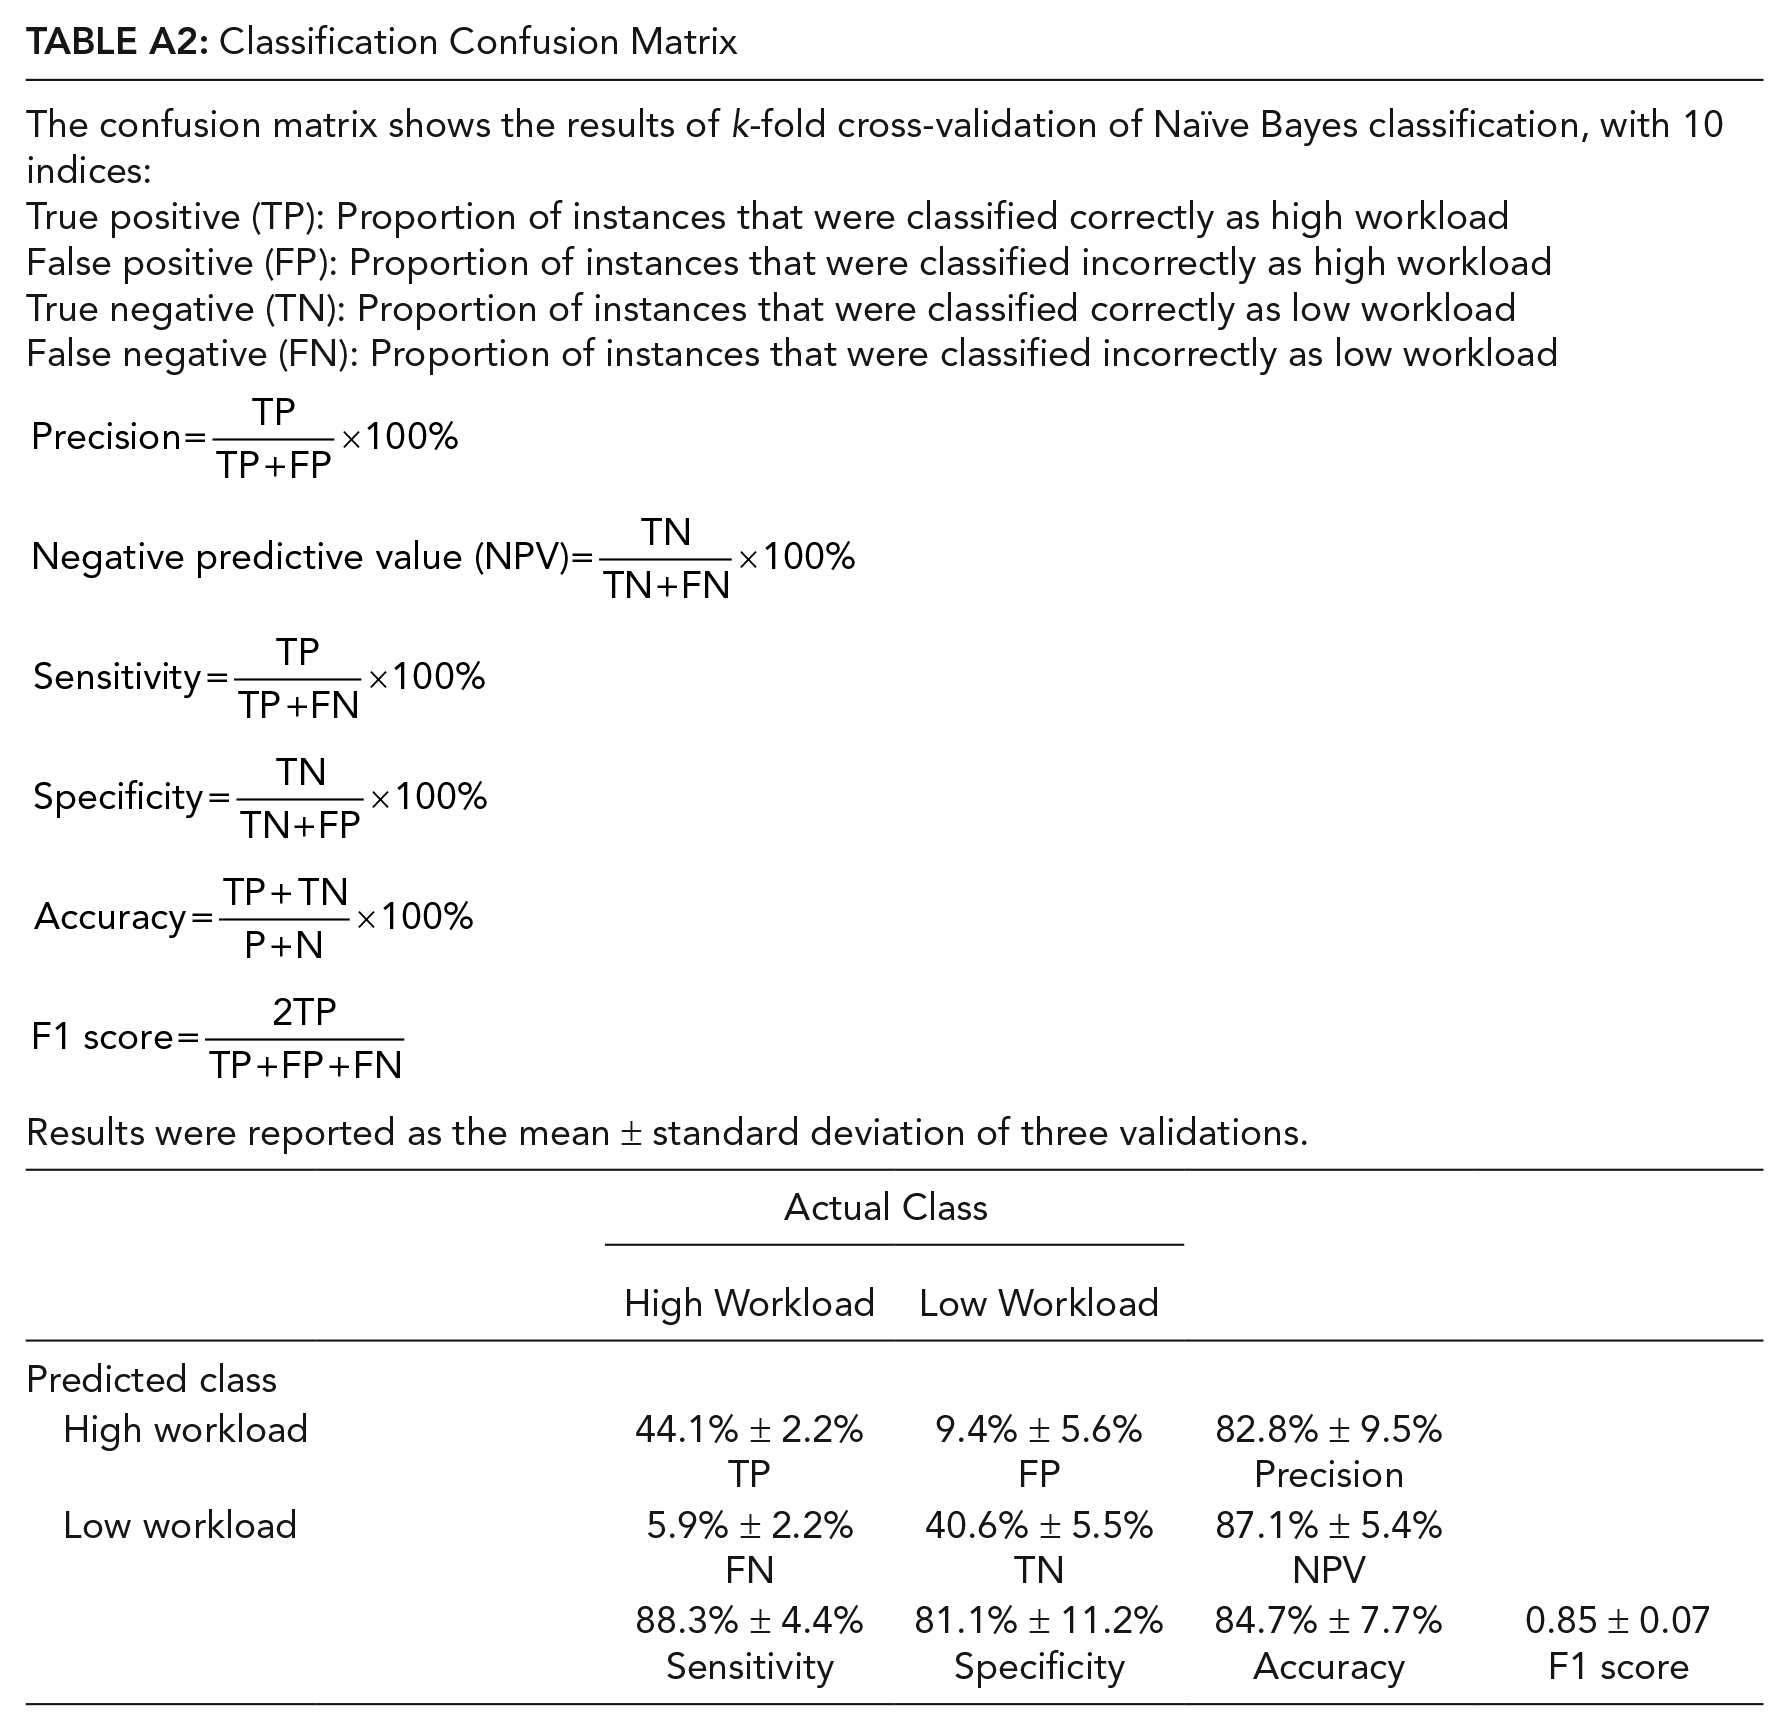
| The confusion matrix shows the results of k-fold cross-validation of Naïve Bayes classification, with 10 indices: True positive (TP): Proportion of instances that were classified correctly as high workload False positive (FP): Proportion of instances that were classified incorrectly as high workload True negative (TN): Proportion of instances that were classified correctly as low workload False negative (FN): Proportion of instances that were classified incorrectly as low workload Results were reported as the mean ± standard deviation of three validations. |
||||
| Actual Class | ||||
|---|---|---|---|---|
| High Workload | Low Workload | |||
| Predicted class | ||||
| High workload | 44.1% ± 2.2% TP |
9.4% ± 5.6% FP |
82.8% ± 9.5% Precision |
|
| Low workload | 5.9% ± 2.2% |
40.6% ± 5.5% |
87.1% ± 5.4% |
|
| 88.3% ± 4.4% |
81.1% ± 11.2% |
84.7% ± 7.7% |
0.85 ± 0.07 |
|
Acknowledgements
The authors would like to acknowledge that this work was supported in part by Walther Oncology Physical Sciences & Engineering Research Embedding Program, Purdue Center for Cancer Research, Indiana University Simon Cancer Center; and Technology Research Grant from Intuitive Surgical, Inc. The authors would like to thank all reviewers for their feedbacks.
Supplemental Material
Supplemental material is available for this article: doi:10.4231/0EVK-9P12.
Chuhao Wu is a Master’s student in Industrial Engineering (IE), Purdue University. He earned a Bachelor’s degree in Engineering Management from Beijing Jiaotong University in 2017.
Jackie Cha is a PhD student in IE, Purdue University. She earned a MSE in Biomedical Engineering from the University of Michigan in 2016.
Jay Sulek is a Urologist in Urology Associates, P.C. He earned a MD from University of Maryland in 2012.
Tian Zhou is a Senior Data Scientist at Boston Consulting Group. He earned a PhD in IE from Purdue University in 2018.
Chandru P. Sundaram is a Professor of Urology at Indiana University. He earned a MD from Madras Medical College in 1985.
Juan Wachs is an Associate Professor of IE at Purdue University. He earned a PhD in Industrial Engineering and Management from the Ben-Gurion University in 2008.
Denny Yu is an Assistant Professor of IE at Purdue University. He earned a PhD in Industrial and Operations Engineering from University of Michigan in 2014.