
Abstract
This article aims to identify the dynamic characteristics (natural frequency in particular) of existing buildings by experimental methods, and then, to compare the results with those reflected by several code provisions and numerical analyses. To this end, ambient vibration tests were carried out on 40 existing concrete and steel buildings in order to obtain the natural frequency of such buildings. The results were then investigated as compared with those arising from several codes and standards, and also with those obtained from numerical analyses. It can be shown in this study that the test results are significantly different from those calculated based on the codes and standards. Moreover, the effect of in-fill walls on the fundamental natural frequency of such buildings is shown. The findings of this research can be used for model calibration and revision of the existing legislations.
Introduction
Overall behavior of structures is directly affected by their dynamic features for instance eigenvalues, eigenvectors, and damping. Identification such as these dynamic characteristics has been of interest to many researchers in the recent years. These dynamic characteristics are usually predicted by either empirical formulas suggested in codes and standards, or analytical techniques such as finite element methods which was done in 2004 by H Crowley and R Pinho in Italy. Indeed, they claimed that simple empirical relationships are available in many design codes to relate the height of building to its fundamental period of vibration. 1 By following this, the fundamental period as liner function of height or number of storys for different typologies and situations which was obtained in 2010 by CS Oliveria and M Navarro. 2 However, although the results of the above methods are accepted to be correct, these results may not be sufficiently accurate in some cases, and errors in these methods may sometimes be inevitable.
Recently, ambient vibration testing has been used as an accurate experimental method available for dynamic identification of full-scale structures. Dynamic characteristics such as natural frequency and mode shape can be obtained by ambient vibration caused by operating condition, for example, wind excitation. 3 Examples of recent implementations of ambient vibration testing include investigation of dynamic characteristics of a historical tower in Bari, Italy by Foti et al., 4 a field investigation on a damaged floor slab of a reinforced concrete frame building in Malaysia by Hashim et al., 5 structural safety assessment of bowstring type reinforced concrete arch bridges in Turkey by Türker and Bayraktar, 6 and structural dynamic identification of a damaged and restored masonry vault in Turkey. 7
In this study, the ambient vibration testing has been used to obtain the natural frequency of several existing structures, and then, the results have been evaluated with those reflected by several code provisions and numerical analyses. This way, the ambient vibration tests were carried out on the 40 existing buildings, 22 of which were steel and 18 were concrete buildings. Figures 1 and 2 show two typical steel and concrete buildings in consideration. In addition, for better understanding, the system of structure, the plan, and elevation of two typical buildings are shown in Figure 2(b) and (c). All natural frequencies obtained from the tests were then investigated as compared to those arising from several codes and standards. Also, the natural frequencies of the 20 of the buildings were compared with those obtained from numerical analyses. Moreover, the effect of in-fill walls on the fundamental natural frequency of the buildings was investigated. To this end, the natural frequencies of the two of the buildings were obtained when the steel framing was completed. Regarding as K Guler et al. 8 who studied the evaluation of fundamental vibration periods of Rc (reinforced concrete) buildings, and considered the effects of in-fill walls. In addition, in 2015, PG Asteris et al. 9 vibration who investigated that in-fill walls increase the stiffness and mass of structure leading to significant changes in the fundamental period numerical value. Next, another test was carried out after construction of the in-fill walls, and the natural frequencies of the two buildings were obtained again. Finally, in order to investigate the effect of in-fill walls on the fundamental natural frequency of buildings, the results of the two above tests were compared. Toydemir et al. 10 investigated the dynamic characteristic of four bridges are obtained using finite element modeling based on environmental vibration conditions. These testing demonstrated that the damage occurred in the bridges is small, particularly as regarded to minimum damage limit which represent the minimum damage area under all three earthquakes loading. AC Altunisik et al. 11 determined obtain dynamic characteristics of highway bridges by nondestructutive testing under environmental vibration conditions. El-Borgi et al. 12 presented a method for seismic a valuation of historical structure. Ambient vibration tests had been used on the case study utilizing a number of accelerometers located at several areas. A number of dynamic characteristic parameters are obtained from the record of an instrumented G + 9 stories RC building during Bhuj earthquake, 26 January 2001 in India in the study of Singh et al. 13 Aras 14 applied both ambient and forced vibration surveys to investigate the dynamic properties of a six-story residential building in Istanbul. 15 ME Arslan and A Durmuş 15 studied the in flounce of eternal walls on dynamic behavior of RC structure with low strength, along with numerical modeling, modal testing, and finite-element model. R Ali and T Okabayashi 16 applied the subspace stochastic realization theories (SSR model I and SSR model II) to a real bridge structure for obtaining initial values of dynamic characteristics. Ikeda et al. 17 studied the structures in terms of story levels system identification of real shear building by environmental vibration information and ARX model. Finally, the development of complex computer programs for structural analysis has served to reinforce this belief since forces carried by individual members can be determined with high precision. Unfortunately, precision has been confused with accuracy. Perhaps because most buildings are unique or perhaps because of a basic fear of the truth, the structural engineering and architectural professions have shown little interest in determining how their completed buildings actually perform. This is in contrast with other branches of engineering where prototype performance is an important feedback to the design process.
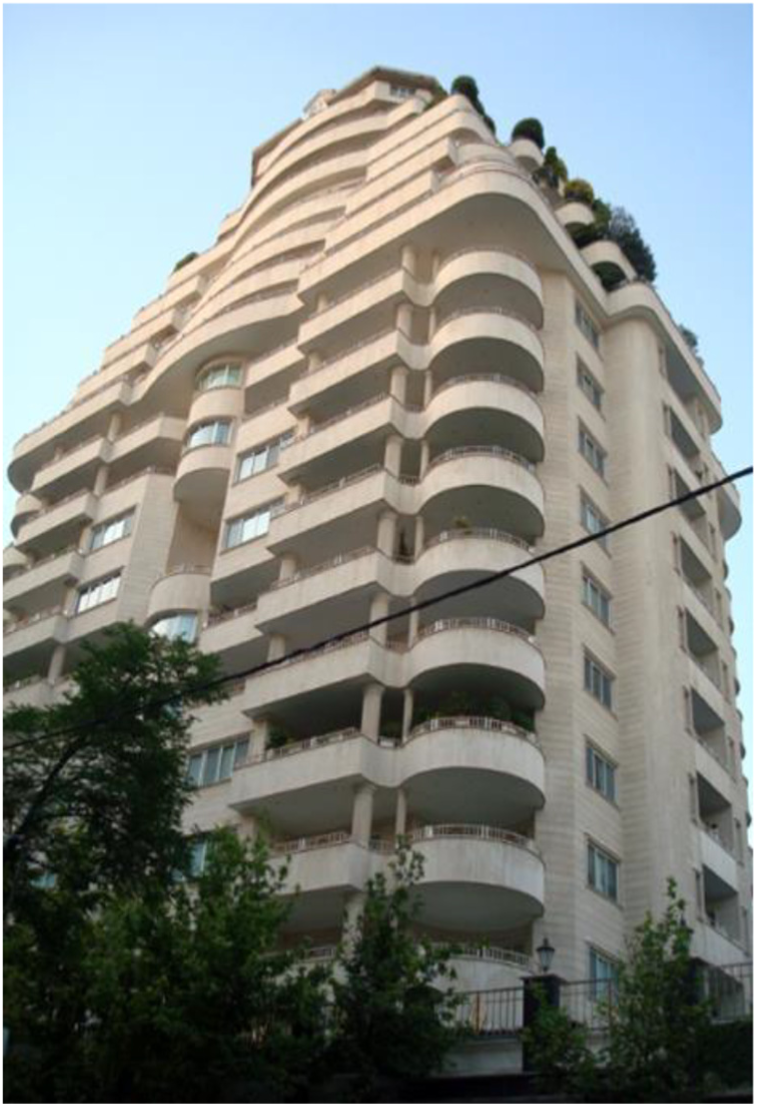
A typical steel building considered in this study (building 1).

(a) A typical concrete building considered in this study (building 2). (b) A typical plan of steel building considered in this study (building 2). (c) A typical elevation of steel building considered in this study (building 2).
In this article, the results of vibration tests on 40 concrete and steel compare with the result obtained from the codes and standards and provide a guideline for future research.
Ambient vibration testing
Environmental vibration test was conducted to determine the natural frequency of the 40 existing concrete and steel buildings considered in this study. Instrumentation and test setup as well as processing of the resulting data are of significance, which will be discussed in this section.
Description of test instruments
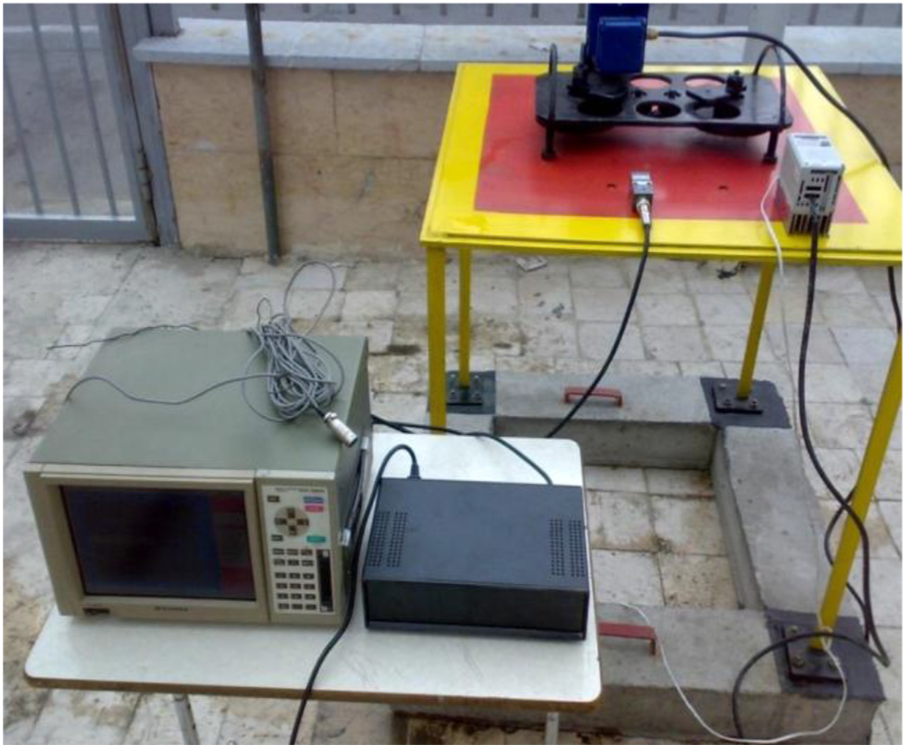
In order to capture the test output information, a one-channel data-logger device with a uniaxial piezoelectric sensor was used (Figure 3). The sensor allowed acceleration responses to be recorded and could detect the movements with frequencies up to 30 kHz. It is necessary to mention, all the measurements are based on the direction marked on the accelerometer. The accelerometer is only sensitive in that direction. Since we installed the accelerometer in both X and Y directions, it measures the accelerometer in both perpendicular directions.

Computer workstation including sensor, data-logger, and computer.
As illustrated in Figure 3, the sensor was connected to the data-logger by two conductor cables for conversion of analog signals to digital form. Also, the data-logger was connected to a computer by one conductor cable for storage of digital data received from the data-logger. The computer was equipped with the Launch-Eplogger software which could store the digital data on a hard disk of the computer in text format. This was also helpful for the on-site inspection of the stored digital data.
Test setup
The tests were conducted at the beginning of spring 2013 when the prevailing wind condition is the most favorable for conducting such ambient vibration tests. At first, the sensor was placed at the nearest point to the stiffness center of the buildings, on the roof along the longitudinal axis (x-axis). Next, the workstation described in previous part was engaged, and the digital data were recorded and stored to be processed later. This was also repeated in the other direction along the transverse axis (y-axis).
It should be noted that all instruments were calibrated prior to final testing. It is important to show calibration of an accelerometer to use for testing of number of building, to make sure that accelerometer work properly. This was done in two different ways; they are a test on an experimental model, and a test on a full-scale structure. The experimental model was a table of 0.8 × 0.8 × 0.8 m with concrete support, as shown in Figure 4. The table was first tested using forced vibration testing, and then, the natural frequency obtained from the test was compared with that obtained from a numerical analysis. The results were equal to 4.20 Hz obtained from the test and 4.12 Hz obtained from the analysis. Obviously, the results show an approximate match, which implies the validity of the function of the instruments.
Experimental model for calibration of the test instruments.
Furthermore, a test was done on a full-scale structure in order to calibrate the instruments more accurately. This way, the office building of the K. N. Toosi University of Technology campus was tested using ambient vibration testing. The results are shown in Table 1. As can be seen in this table, the results of the two tests are perfectly matched. Once again, this can confirm the validity of the function of the instruments.
A comparison study with natural frequency obtained from the environmental and force vibration testing.

Data processing
As previously mentioned, the digital data were stored on a hard disk of the computer in text format. These digital data needed to be processed in order to obtain the natural frequency of the buildings. To do this, the digital information was changed from the time section to the frequency section by the fast Fourier transformation technique. Subsequently, the natural frequency may be determined by observing the frequency at the maximum value of the Fourier amplitude. For instance, the Fourier amplitude related to the office building of the K. N. Toosi University of Technology campus is shown in Figure 5. Furthermore, a brief description of the characteristics of the buildings including types, heights (from the foundation), and lateral resisting systems as well as their natural frequency obtained from the tests are given in Table 2.
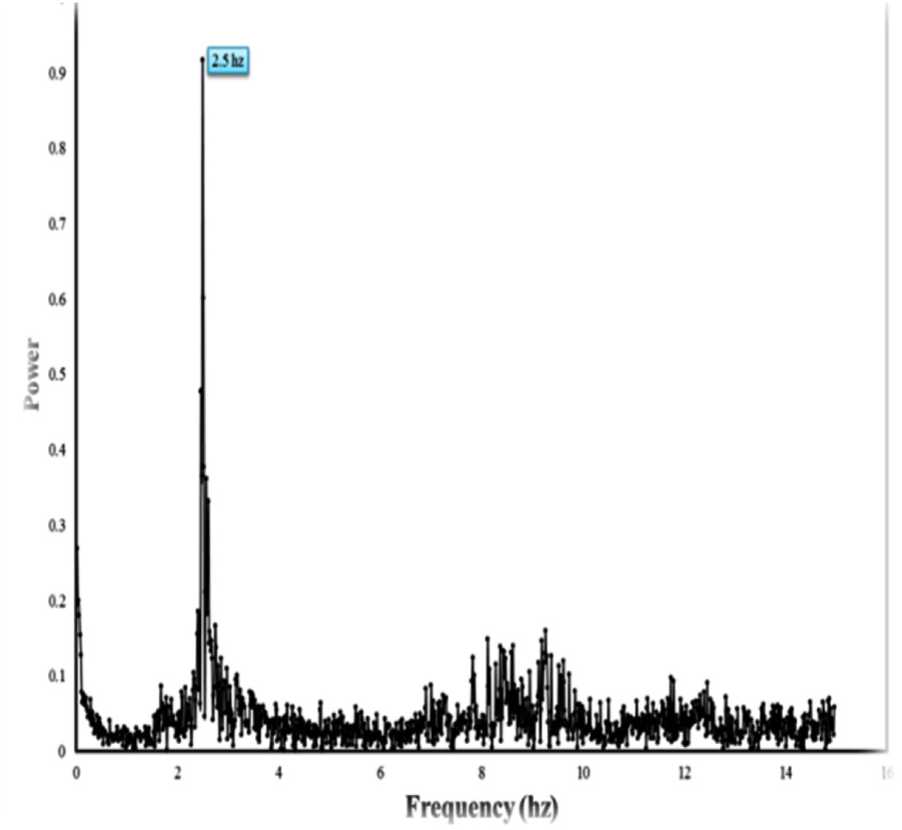
Fourier amplitude related to the office building of the K. N. Toosi University of Technology campus.
A brief descriptions of the characteristics of the buildings and their natural frequency.
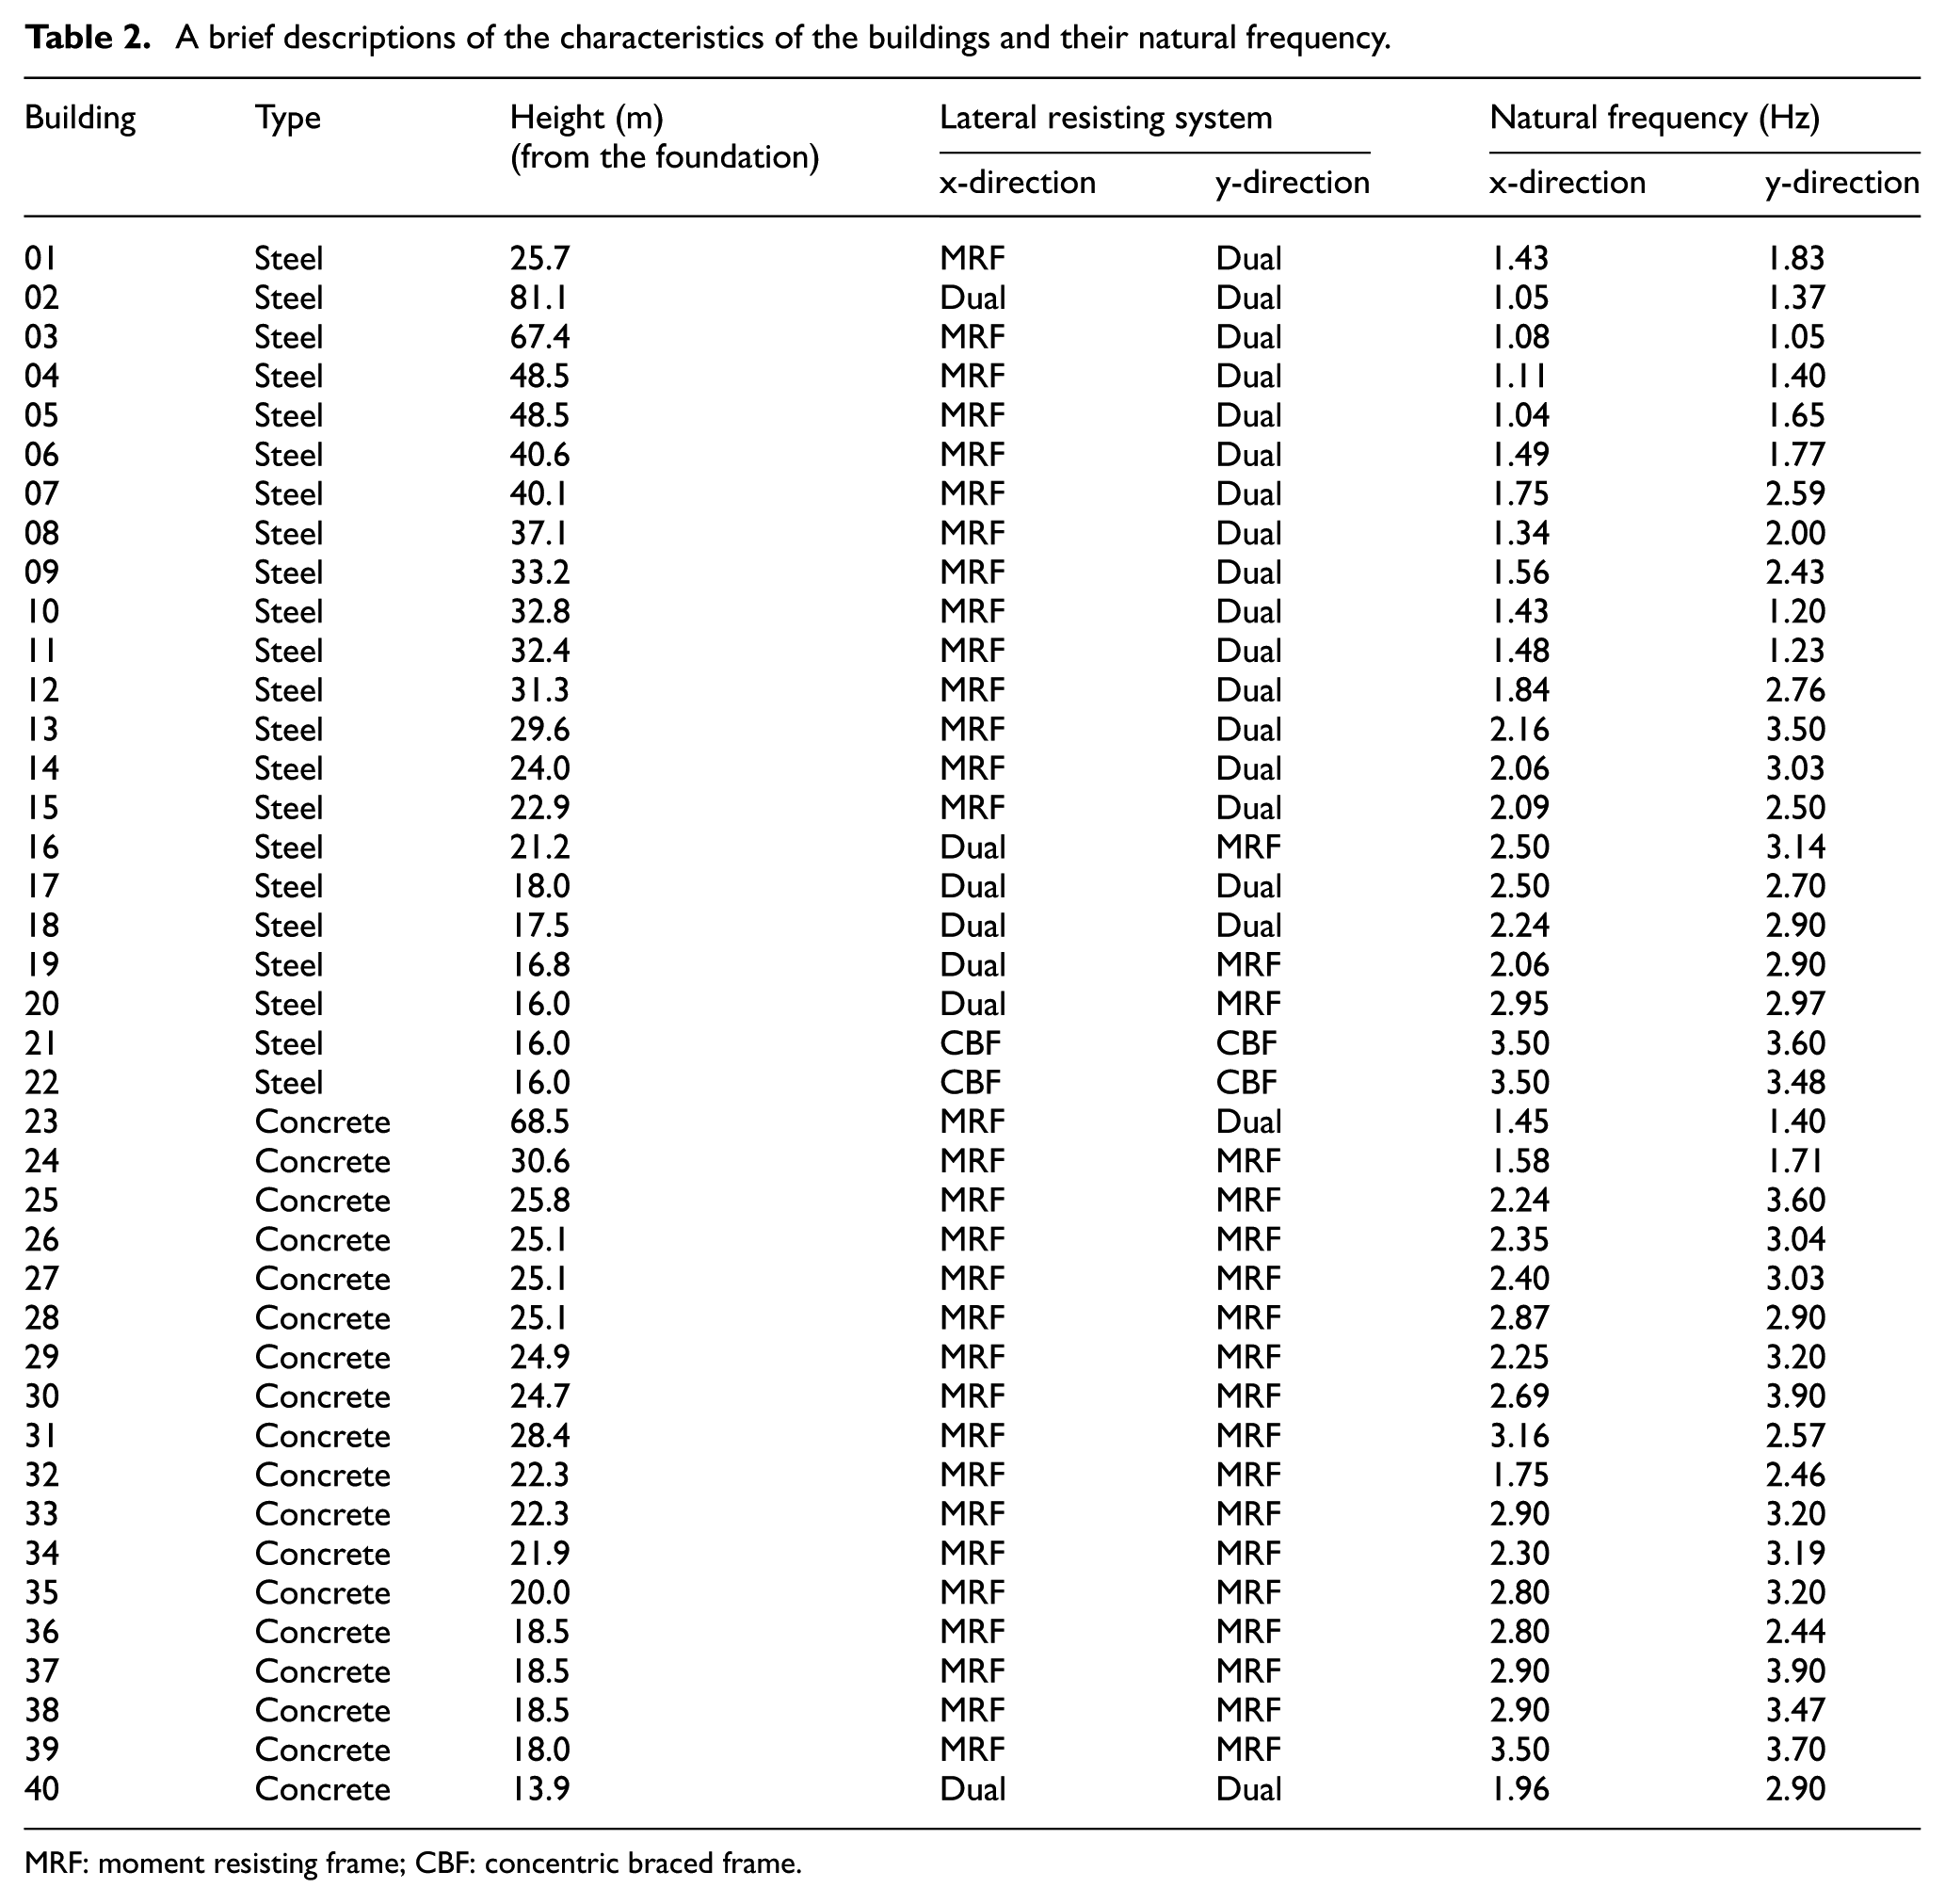
MRF: moment resisting frame; CBF: concentric braced frame.
In Table 2, moment resisting frame, concentric braced frame, and dual represent the type of the lateral resisting systems including moment resisting frame, concentric braced frame, and dual system, respectively. The natural frequencies presented in this table are all related to the state of the buildings where the in-fill walls had been constructed. In addition, the natural frequencies of buildings 1 and 16 were obtained for the state of the two buildings before the construction of the in-fill walls, which are equal to 1.15 and 1.24 Hz in x-direction, and 1.20 and 2.57 Hz in y-direction, respectively.
Finite element modeling and analysis
In order to determine the natural frequency of the building, a numerical model (Finite element modeling) was utilized. To this aim, 20 of the buildings including the concrete and steel ones were modeled and analyzed as full-scale structures.
Properties of materials used in the modeling of structural elements were set for the models based on detailed information of structural drawings… It should be noted that the in-fill walls were not modeled, that means their stiffness was ignored, but their mass was considered in the modeling. Finally, the Response Spectrum Analysis (RSA) was performed according to the Iranian Seismic Code (ISC) 2800, 18 and the natural frequencies were obtained. Table 3 shows the fundamental frequencies of the structures obtained from the numerical analysis.
Fundamental frequency of the buildings obtained from the numerical analyses.

Results and discussion
As presented earlier, the natural frequencies of the buildings were obtained through the ambient vibration tests and the numerical analyses. Considering all the natural frequencies obtained, a comprehensive comparison was made between the fundamental frequencies of the buildings, and those of the numerical analyses, as well as those arising from several codes and standards. This could result in a more realistic insight into the provisions of the codes and standards in consideration, which have been suggested to calculate the natural frequencies. The results are presented herein.
General differences
The first issue investigated in this study was that the differences between the fundamental frequencies obtained from the ambience environmental test and those obtained from code provisions and finite element analyses were examined, and then, the average of the differences was calculated. ISC 2800 18 and ASCE-7-2015 19 are the two codes utilized to this end. Tables 4 and 5 give the natural frequencies obtained from these codes, and Figure 6 shows the average of the differences described above for the four cases of lateral resisting system. It should be noted that the differences are presented as a percentage of the natural frequency obtained from the tests.
Natural frequencies of the buildings obtained from the ISC 2800.

Natural frequencies of the buildings obtained from the ASCE-7-2015.

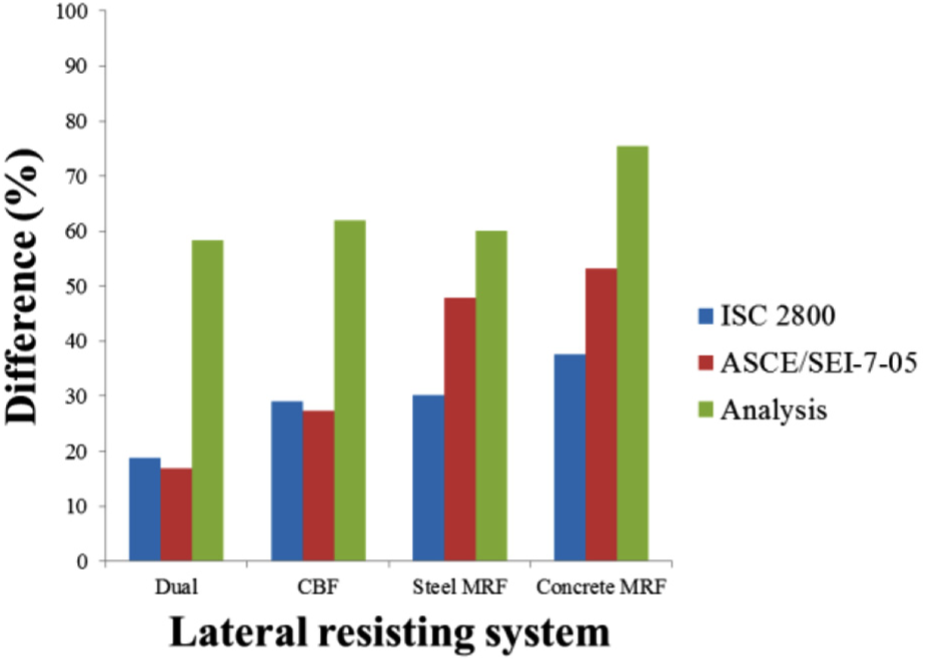
Average of the differences between the fundamental frequencies obtained from the environmental tests and those obtained from code provisions and finite element analyses.
The average differences shown in Figure 6 have got minus values in all cases, that is the natural frequencies obtained from code provisions and numerical analyses are averagely less than those obtained from the tests. Based on Figure 6, three general results could be achieved as follows:
The natural frequencies obtained from the ISC 2800 have, on average, a difference of about 18%–38% with those obtained from the tests. This amount of difference may be due to the fact that the empirical relationships which have been suggested in the ISC 2800 to calculate the natural frequency are not sufficiently accurate and need to be reviewed.
The average difference between the natural frequencies obtained from the ASCE-7-2015 and those obtained from the tests ranges from 16% to 54% for the various lateral resisting systems. Same as before, this can indicate that the empirical relationships of the ASCE-7-2015 suggested to calculate the natural frequencies are also not accurate enough. Furthermore, for the moment resisting frames, the average difference related to the ASCE-7-2015 is more than that related to the ISC 2800. Therefore, this can be suggested that the provisions of the ASCE-7-2015 to calculate the natural frequency of moment resisting frames are more conservative than those of the ISC 2800.
The average differences shown in Figure 6 have got minus values in all cases, that is the natural frequencies obtained from code provisions and numerical analyses are averagely less than those obtained from the tests. Based on Figure 6, three general results could be achieved as follows:
The natural frequencies obtained from the ISC 2800 have, on average, a difference of about 18%–38% with those obtained from the tests. This amount of difference may be due to the fact that the empirical relationships which have been suggested in the ISC 2800 to calculate the natural frequency are not sufficiently accurate and need to be reviewed.
The average difference between the natural frequencies obtained from the and those obtained from the tests ranges from 16% to 54% for the various lateral resisting systems. Same as before, this can indicate that the empirical relationships of the ASCE-7-2015 suggested to calculate the natural frequencies are also not accurate enough. Furthermore, for the moment resisting frames, the average difference related to the ASCE-7-2015 is more than that related to the ISC 2800. Therefore, this can be suggested that the provisions of the ASCE-7-2015 to calculate the natural frequency of moment resisting frames are more conservative than those of the ISC 2800.
There is a significant average difference of about 58%–76% between the natural frequencies obtained from the analyses and those obtained from the tests. As noted earlier, the in-fill walls were not considered in the finite element modeling of the buildings. Therefore, it may be concluded that the major reason of this significant difference is that the in-fill walls were not modeled. This means that buildings get stiffer due to the construction of in-fill walls, and this has a significant effect on the natural frequency of buildings.
A particular provision
According to the ISC 2800, 11 time period of moment resisting frames should be calculated in such a way that the time period of the cases with in-fill walls would be equal to 80% of the time period of the cases without in-fill walls. As already seen, the natural frequencies of buildings 1 and 16 were obtained for both states of the buildings with and without the in-fill walls. Hence, in order to investigate the provision described above, a comparison was made between the time periods related to the two states of the buildings with and without the in-fill walls. This comparison is represented in Table 6.
Time periods of buildings 1 and 16 related to the two states of the buildings with and without the in-fill walls.

The time periods in Table 6 were obtained by dividing the unity number by the natural frequency of the pertinent buildings. As can be seen in this table, the time periods of the buildings 1 and 16 with the in-fill walls are 19.5% and 17.9% less than those of the two buildings without the in-fill walls, respectively. If the minor difference of these values with 20 is neglected, it can be concluded that the mentioned provision is satisfied under the real condition, and it is perfectly an accurate provision.
Conclusion
In the present study, it has been attempted to make a comprehensive examination between the fundamental frequencies obtained from the ambient vibration tests and those obtained from code provisions and finite element analyses. Based on the results provided by the investigations, the four following conclusions may be reached. Primarily, it was concluded that the empirical relationships which have been suggested in the ISC 2800 and the ASCE/SEI-7-10 to calculate the natural frequency of buildings are most probably not accurate enough and need to be reviewed.
Regarding the relatively high differences between the natural frequencies of the moment resisting frames obtained from the ASCE/SEI-7-10 and those obtained from the tests, it was suggested that the provisions of ASCE/SEI-7-10 for calculating the natural frequency of moment resisting frames are more conservative.
The main reason of the big difference between the analytical and experimental frequencies was found in the issue that the in-fill walls were not considered in the finite element modeling of the buildings. Accordingly, it was claimed that buildings generally become stiffer due to the construction of in-fill walls, and this has a significant effect on the natural frequency of buildings.
In the end, some investigations were done in order to verify a particular provision of the ISC 2800, according to which the time period of buildings with in-fill walls should be equal to 80% of the time period of the buildings without in-fill walls. The results could satisfy the mentioned provision under the real condition.
Footnotes
Handling Editor: MA Hariri-Ardebili
Declaration of conflicting interests
The author(s) declared no potential conflicts of interest with respect to the research, authorship, and/or publication of this article.
Funding
The author(s) received no financial support for the research, authorship, and/or publication of this article.