
Abstract
The matching of crack-tip constraint is a key issue for the developing of accurately structure integrity assessment method. For more and more non-standard specimens with different constraint states were used in the scientific research, it is especially significant to establish the matching of constraint between standard specimen and non-standard specimen. In this article, the single edge-notched bend specimens with various constraint states were selected, and the unified constraint parameter Ap under different J-integrals was calculated by finite element analysis. And then, based on the J-A p curves, the matching of crack-tip constraint between different specimens was studied, and the matching specimens were given. In order to confirm the reliability of results, some experiments focused on the matching specimens were performed. The experiment results showed that the matching is valid. For the fracture properties of matching specimens are matching also, it is significant to the accurate assessment of structural integrity.
Introduction
Constraint is the resistance of a structure against plastic deformation. 1 It can be divided into in-plane constraint and out-of-plane constraint. The in-plane constraint is affected by the length of un-cracked ligament, while the out-of-plane constraint is affected by the specimen thickness. It is generally known that the material’s fracture behaviors are affected by the constraint effect, the loss of constraint will cause the increasing fracture resistance. 2
However, in the current integrity assessment methods based on the macro-fracture mechanics, standard specimen for the fracture toughness testing has severely size requirement to make sure a high constraint state.3–8 For the flawed structure involves a low constraint state, the transfer of fracture toughness data from standard specimen to actual cracked components will produce a conservative result. Conversely, for some special cases with higher constraint states than standard specimen, the transfer will result in a non-conservative (unsafe) result. The matching of constraint between structures and specimens is a key point for the developing of accurately structure integrity assessment method.
In order to improve the accuracy of structural integrity assessment, more and more non-standard specimens with different constraint states have been used in the scientific research. But, it is needed to clarify the constraint states of these specimens first, and it is especially significant to establish the matching of crack-tip constraint between standard specimen and non-standard specimen.
A great many of constraint parameters were established to characterize the constraint state, such as T, 9 Q,10,11A2, 12 TZ.13–15 Based on these parameters, the constraint states of different laboratory specimens were studied.16–22 It has been found that the deeply cracked compact tension (CT) specimen, single edge-notched bend (SENB) specimen, and single edge-notched tensile (SENT) specimen are high constraint specimens, and the middle-cracked tension (MT), shallow cracked SENT, and SENB specimen are low constraint specimens.
Furthermore, much attention has been concentrated on the transferability of constraint parameter from laboratory specimens to cracked pipelines.17,23–26 Chiesa et al. 17 found that the constraint state of the pipeline with a/W = 0.75 is correspond to the SENT specimen with a/W = 0.6. Nyhus et al.23,24 pointed out that the geometry constraint of SENT specimen is closer to the pipe than SENB specimen. Xu et al. 25 pointed out that the SENT specimens are the good representation of flawed pipes and can be used in the assessment of pipes. Larrosa and Ainsworth 26 found that it will reduce the excessive conservatism in fracture assessment when the fracture behavior of the test specimen with a similar constraint was used.
However, for specimens with the same loading configuration, such as SENB specimen, CT specimen, study on the matching of constraint between standard and non-standard specimens seems to be ignored. It is probably because that the defined constraint parameters previously only can be used to characterize the in-plane or out-of-plane constraint. For the specimens with same loading configuration but different crack depths and specimen thicknesses, both in-plane and out-of-plane constraints are different. Thus, it is a difficult thing to establish the matching of constraint.
Fortunately, some unified parameters which can characterize both in-plane and out-of-plane constraints have been proposed.27–30 Mostafavi et al.27,28 have defined a new constraint parameter φ which can quantify the both constraints. And then, a modified unified parameter Ap was defined by Yang et al.29,30

where APEEQ is the areas surrounded by the equivalent plastic strain (εp) isolines at crack tip and Aref is the reference area surrounded by the εp isolines in a standard test at fracture. The defined unified parameters provide possibility to establish the matching of constraint between different specimens.
Thus, in this article, different SENB specimens were selected, and the matching of crack-tip constraint between different specimens was systematically studied based on the unified constraint parameter Ap.
Finite element analysis
Material property
A common ferritic low-alloy steel A508 was used. The measured modulus of elasticity (E) of this material at room temperature is 202,410 MPa and Poisson’s ratio (ν) is 0.3. The true stress–strain curve of this material at room temperature is shown in Figure 1.

The true stress–strain curve of the A508 steel.
Specimen geometry
The geometry and loading configuration of the SENB specimens are shown in Figure 2. Four crack depths denoted as a/W = 0.1, 0.3, 0.5, and 0.7 were chosen, and for each crack depth, a set of specimen thicknesses were chosen, as listed in Table 1. The specimen with a/W = 0.5, W = 32 mm, and B = 16 mm (B/W = 0.5) was selected as the standard specimen according to ASTM E1820-08. 31
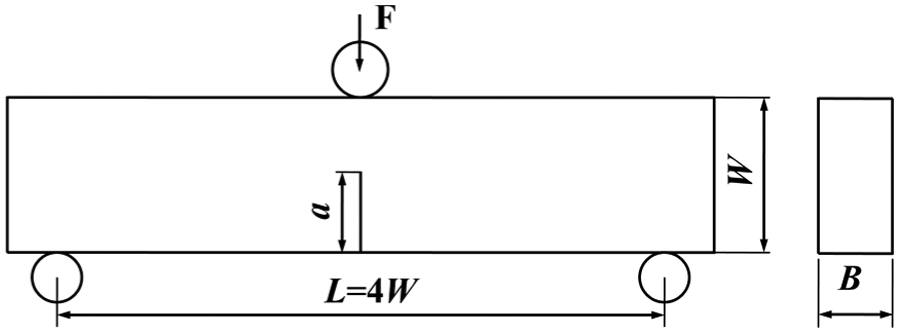
The geometry and loading configuration of the SENB specimens.
The sizes of the SENB specimens with different constraints.

SENB: single edge-notched bend.
Finite element analysis
The software of ABAQUS was selected to calculate the J-integral and the distribution of εp. The three-dimensional finite element models were built and the eight-node isoperimetric elements with reduced integration (C3D8R) were used. The typical meshes of the standard specimen are shown in Figure 3(a).

The typical meshes of the standard specimen (a) and the local meshes at crack tip (b).
Because there are steep stress and strain gradients at the crack tip, a conventional mesh configuration which has a focused ring of elements surrounding the crack front was used with a small initial root radius (2 μm) at the crack tip,29,30 as shown in Figure 3(b). The model in Figure 3(a) has 119,561 nodes and 109,408 elements. The load was applied at the up center of the specimen by prescribing a displacement of 6 mm.
The previous studies have showed that different εp isolines can be used to calculate the Ap under the condition that the εp isoline at the crack tip was not affected by the εp isoline outside of the crack-tip region. For the JIC ≤ 50 KJ/m2, the plastic region size can be selected; for the 50 KJ/m2 < JIC ≤ 1000 KJ/m2, the 0.1 < εp ≤ 0.2 can be selected; for the JIC ≥ 1000 KJ/m2, the 0.2 < εp ≤ 0.3 can be selected. 29 Thus, in this article, the areas surrounded by the εp = 0.2 isoline at the crack tip at different J-integrals were calculated.
Experimental procedure
It is demonstrated that if the constraint states of two specimens are matching, the transfer of fracture properties is possible. 32 Thus, to confirm the results obtained by finite element analysis, some SENB experiments were performed by an Instron screw-driven machine at room temperature. The displacement controlled mode at a cross-head speed of 0.5 mm/min was selected to ensure the quasi-static loading. The load–load line displacement curves were recorded by a computer-aided control system of the machine automatically. And then, the single specimen method with the normalization technique conforming the ASTM E1820-0831 was used to calculate the J-resistance curves, which has been described detailed in Wang et al. 33
Results and discussion
The J-A p curves of different specimens
The J-A p curves of SENB specimens with different constraints were calculated, as shown in Figure 4. For comparison, the J-A p curve of the standard specimen was listed in each figure.
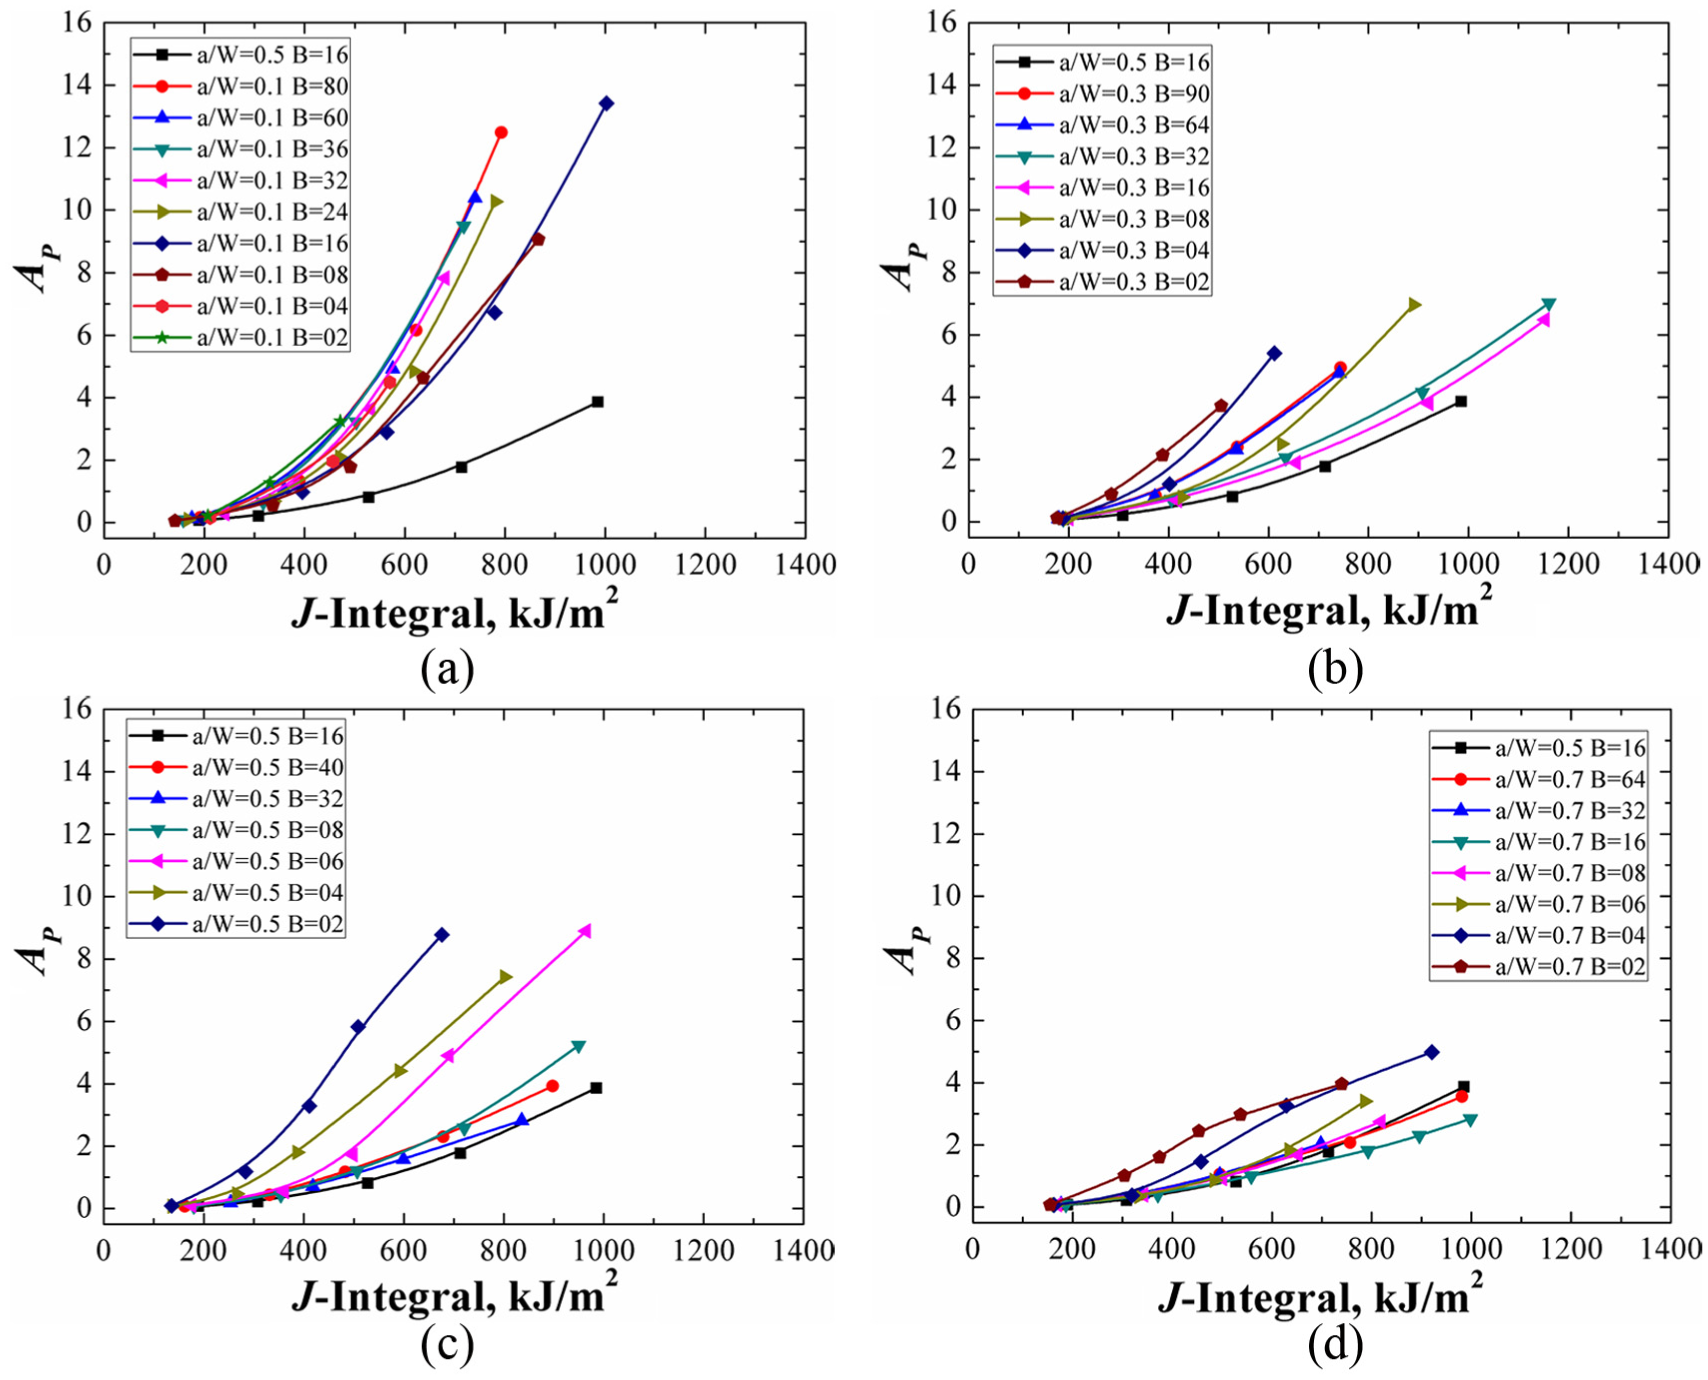
The J-A p curves of different specimens: (a) a/W = 0.1, (b) a/W = 0.3, (c) a/W = 0.5, and (d) a/W = 0.7.
From Figure 4, it can be found that the Ap increases with increasing J-integral. For the specimens with the same crack depth, with increasing specimen thickness, the Ap will decrease first, then increase after a nadir and tend to be stable finally. There exists a minimum. For the constraint is the resistance of structure against plastic deformation, 1 the minimum Ap means the highest constraint state. Thus, the specimen with the highest constraint state can also be found from Figure 4. For the specimens with different crack depths, the specimens with B = 16 mm (B/W = 0.5) have the highest constraint state, it is independent of crack depth.
Similarly, the minimum specimen thickness with the stable constraint state for each crack depth can also be found. For the specimen with a/W = 0.1, 0.3, 0.5, and 0.7, the specimen thickness is 36, 64, 40, and 32 mm respectively. When the specimen thickness is higher than this value, the constraint state will not change.
In addition, the J-A p curve of the standard specimen is the lowest in all the specimens except the specimen with a/W = 0.7, W = 32 mm, and B = 16 mm. The standard specimen has an almost highest constraint state, which showed that the size requirement in the current integrity assessment method is accurately.
Furthermore, the J-A p curves of the specimens with a/W = 0.1 are high, and the J-A p curves of the specimens with a/W = 0.7 are low. Which means that the specimens with a/W = 0.1 are low constraint specimens while the specimens with a/W = 0.7 are high constraint specimens. It can also be found that for the specimens with a/W = 0.1 and 0.3, the constraint state cannot reach the high constraint state of the standard specimen forever, no matter how the specimen thickness changes. It means that the increase of constraint state is limited only relying on the changing of thickness (out-of-plane constraint) at low crack depth (in-plane constraint).
The change of constraint state with J-integral
In Yang et al.,
29
the fracture toughness JIC of the standard specimen under plane strain condition was regarded as the reference toughness Jref, there is a linear relationship between the JIC/Jref and

The J/Jre-
From Figure 5, there is a linear relation between the J/Jref and

The J/Jref-
From Figure 6, for the specimens with long crack depth but low specimen thickness, the J/Jref-
The matching of crack-tip constraint state
Compared all the J-A p curves one by one, it can be found that some specimens’J-A p curve is coincident, which means that the crack-tip constraint states of these specimens are equal. These specimens are grouped by crack depth and listed in Table 2.
The matching of crack-tip constraint.

In Table 2, the constraint states of the specimens in the same row are equal. The corresponding constraint matching specimen can be found according to Table 2. The matching specimens have the same fracture properties.
But, for some specimen, there is a proviso. Because the slope of the J/Jref-

The matching of crack-tip constraint state for some special specimens.
The verification of experiment
To confirm the reliability of the results in Table 2, a set of matching specimens were selected from Table 2 to measure the J-resistance curves by experiments, as shown in Figure 8.
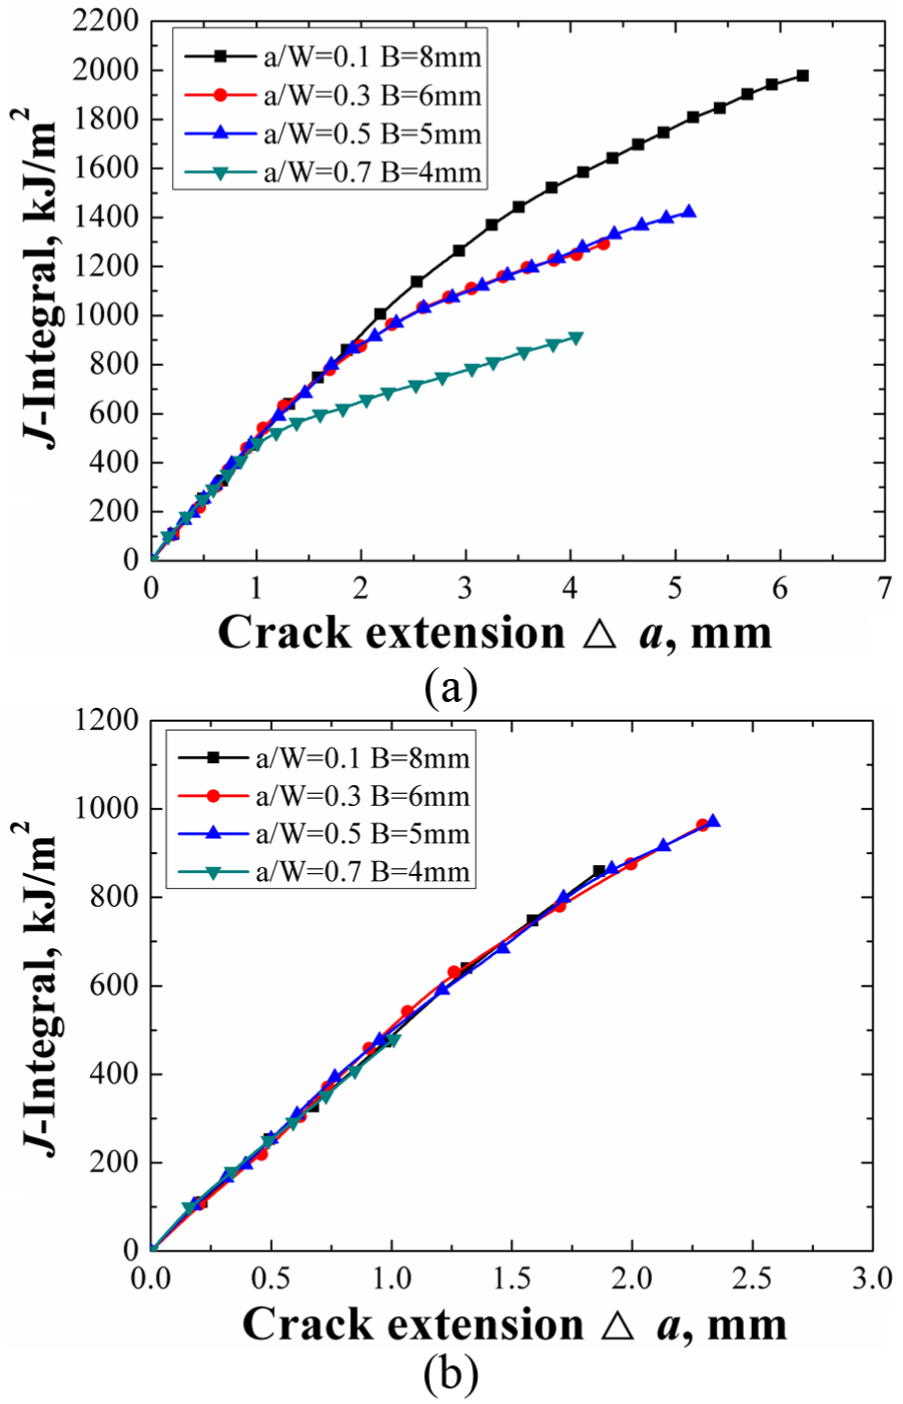
The J-resistance curves obtained by experiments.
It can be found that although the overall trend of J-resistance curves decreases with the increase of crack depth (as shown in Figure 8(a)), but at low J-integral (J < 1000 kJ/m2 for specimens with a/W = 0.1, 0.3, and 0.5; J < 500 kJ/m2 for specimen with a/W = 0.7), the J-resistance curves of the four specimens are coincident, as shown in Figure 8(b). It is coinciding with Figure 7. For the J = 500 and 1000 kJ/m2 are higher enough for the specimen to fracture, the matching still has a real significance.
Conclusion
For the specimens with the same crack depth, the constraint state will increase first, then decrease after a peak, and tend to be stable finally with increasing specimen thickness. The specimens with B = 16 mm (B/W = 0.5) have the highest constraint state; it is independent of crack depth.
For the specimens with long crack depth but low specimen thickness, the J/Jref-
The matching of constraint state between standard specimen and non-standard specimen was established and verified by experiments. For the fracture properties of matching specimens can be transferred each other, it is significant to the accurate assessment of structural integrity.
Footnotes
Handling Editor: Guian Qian
Declaration of conflicting interests
The author(s) declared no potential conflicts of interest with respect to the research, authorship, and/or publication of this article.
Funding
The author(s) disclosed receipt of the following financial support for the research, authorship, and/or publication of this article: This project is supported by National Natural Science Foundation of China (grant no. 51605292).