
Abstract
In this study, to estimate the forming limit curves of a steel DP350 sheet, a combination of the finite element method simulation and experimental methods was adopted using the fracture height of experimental specimens and the corresponding in-plane major/minor strains of the finite element method simulation. Hecker’s punch stretching tests were first performed to measure the fracture height for forming limit curve testing specimens with a different notch radius. The finite element method process was then performed to get in-plane major/minor strains (ε1 and ε2) at various points on specimens with different dimensions and the same fracture height of each corresponding experimental data point. An interpolated curve from the tip of the strain paths was derived using the limit curve (FLC1) of a DP350 steel sheet. The resultant FLC1 will be the input data for a finite element method simulation, in order to predict the formability of the steel DP350 sheet. Finally, experiments for difference specimens of Hecker’s punch stretching tests were performed as a comparison and showed a good agreement between the simulation and experimental results.
Keywords
Introduction
Most practical sheet metal forming processes are generally associated with the rules to various forming modes, such as drawing, plane-strain deformation, and stretching. The formability of sheet metals can be defined as the capacity of a metal sheet to be deformed into a desired shape, without experiencing a fracture or generating an unacceptable failure defect. Accordingly, in order to estimate and improve formability it is more efficient to predict fractures occurring as a result of the simulation process. There is no predominant type of failure associated with the sheet metal forming process; however, the most common types of observable failures include sheet wrinkling, resulting from compressive dominant stresses, and a localized neck that occurs when the stress and strain lead to an extension in the surface area of the sheet with a decrease in thickness. In sheet metal forming processes, the criteria of formability are determined by a localized neck or fracture, occurring on the surface of the sheet metal. The limited deformations of sheet materials are normally estimated using a strain measurement, namely, a forming limit curve (FLC). To determine the FLC, the maximum major principal strains at various minor principal strains will be measured based on the development of localized necking, occurring on the surface of the sheet materials.1,2 Nowadays, FLCs have been used as a simple and effective method to indicate the formability of sheet materials.
An FLC depends on the interaction of various parameters, such as the material behavior, strain path, strain hardening, lubrication, and geometrical factors related to the method of deformation. In the industry, punch and tensile stretching methods are normally performed to test and predict the real automotive forming processes, including the parameters of geometries and technologies. The most commonly used test is the out-of-plane method that utilizes the punch stretching geometry, as suggested by Hecker. 3 The biaxial tests of Ghosh and Hecker 4 for in-plane and out-of-plane deformations have revealed that strain stages received from the bending of a sheet cause an increase in sheet formability. Therefore, the analysis used to obtain an FLC must include the effect of bending strain gradients for sheet materials. Shi and Gerdeen 5 were the first to quantitatively present the difference in the FLC as a result of in-plane and out-of-plane deformations. Also, the strain gradient effect with nonlocal plasticity formulation has been introduced in the formability study of ductile materials containing void damage by Kim et al. 6 Dilmec et al. 7 evaluated ASTM E2218-02 and ISO 12004-2 standards, which are used to determine FLCs with experiments. The study was performed with the ductile material AA5754-O and the moderate brittle material AA2024T4. With the same experimental conditions and methods of strain evaluation, research results show that the ISO 12004-2 standard was more reliable and consistent compared to the ASTM E2218-02. Sheet thickness and anisotropy were studied experimentally using AA2024T4 according the ISO 12004-2 standard. 8 To measure in-plane strain condition, a new method was proposed for grid analysis, known as the interpolation technique. The authors conclude that the effect of anisotropy is insignificant. However, sheet thickness changes the FLC level. Hence, the FLCs of various sheet metals on thickness exhibit differences between them.
However, determining the FLCs of sheet metals is not only expensive but also difficult, as the FLC is estimated by pairs of principal limit strains (major strain ε1 and minor strain ε2), which can be obtained from circle grid marks on the surface of the test specimen during a sheet metal forming process prior to the occurrence of some defects. Here, a circle grid was marked to view the expansion and check the principal major and minor strains after the necking of circles on the specimens, and subsequently using a camera to capture necking or the failure of circles for measurements. Hence, the accuracy of the FLC will depend on various factors. Numerical methods used to accurately predict forming limits provide a powerful tool to determine optimum parameters for a sheet metal forming process.
In this research, to determine the FLC in sheet materials of DP350, a combination of experiments and finite element method (FEM) simulation is used. The fracture heights of various specimens were first measured from experiments of Hecker’s punch stretching tests. FEM simulation procedures were then performed as follows: the flow stress data of the DP350 sheet, which were obtained from a uniaxial tensile test, are used to determine the hardening parameters based on both Voce and Swift’s hardening laws; the better fitting curve was utilized as the input data of the FEM simulation; following this, the FEM modeling of various specimens was simulated with the same experimental conditions to reach the corresponding fracture height, in order to measure the in-plane major–minor strain pairs and the strain paths at the necking positions using FEM deformed shapes. Finally, the obtained FLCs from the FEM measurements were used as the input data to predict the fracture occurrences of other specimens, and the corresponding experiments were carried out to confirm these results.
Experiment and FEM
Properties of tested material
In this study, the DP350 steel sheet material was used. This is generally used for various parts in automobiles for the side outer body, fender, floor panel, and so on. To evaluate the mechanical and forming characteristics of this material, a sheet thickness of 1.181 mm was used, with a nominal tensile speed of 20 mm/min. In order to simulate the tested specimens with high-accuracy results, the constitutive equation for tensile test specimens needs to be correctly predicted to identify the material properties and deformation characteristics. There are many studies that propose the stress–strain curves of sheet metal based on experiments.9–14 Among them, the Swift 15 and Voce 16 equations present the hardening behavior of a DP350 steel sheet, using equations (1) and (2), respectively. The parameters of the Swift and Voce equations for the DP350 material in the 0° direction are shown in Table 1. The stress–strain curves derived from the experiments and predictions are shown in Figure 1. As mentioned in other studies,12–14 true stress–strain curves significantly affect the results of finite element (FE) simulation. Hence, the Swift equations, which showed a better prediction when compared with the experimental data, have been adopted in this study. Tables 2 and 3 show the mechanical properties and chemical composition of the test materials, respectively. The microstructures of DP steel sheets have been explained in more detail in a previous study 17


Parameters of the Swift and Voce equations for the DP350 material in the 0° direction.


True tress–plastic strain curves of DP350 material in the 0° direction.
Chemical composition of the DP350 material.

Mechanical properties of the DP350 material evaluated using the Swift equation for different orientations subjected to rolling direction.

Experimental procedures
For the evaluation of the forming limit diagram with an experimental approach, a round punch was used, along with the upper and lower dies, as shown in Figure 2. The dimensions of the FLC specimens are shown in Figure 3. In order to establish the formability of the DP350 material, the principal surface strains through two dimensions (ε1 and ε2) of the metals should be obtained. This fracture limit diagram (FLD) must include all relative strains between ε1 and ε2 of the forming states from (ε1 = ε2) to (ε1 = –ε2). The FLC classifies the onset of failure and the safe zone of the material, indicating the forming capability. The major and minor strains can be calculated from the conventional grid marking method. A circle grid of 2 mm diameter was etched on the surface of the specimen before the experiment. After the test, deformed circle (ellipse) grids close to the fractured region were measured in the major and minor directions to define the couple logarithmic strains (ε1 and ε2). However, grid etching is not clear on some materials (such as aluminum alloy), and grids using a laser beam can strongly effect material surface imperfections.

Punch stretching test machine.

The dimensions of the FLD specimens.
Punch stretching tests were performed using a hemispherical punch with 102 mm diameter and a draw bead with 150 mm diameter on the sheet, forming a simulator with a double action hydraulic press (blank holder force 30 t and punch force 20 t capacity). The punch forming speed was constantly set at 50 mm/min.
Material imperfections can strongly effect fracture initiation and evolution. However, in the experiment, the MoS2 solid lubrication was applied to the specimen surface to minimize the friction coefficient, such that the fracture always occurs on the top area of the specimen. Following the experiment, the fracture height is measured using a Mitutoyo height gauge (Figure 4).

Fracture height measurement with the Mitutoyo height gauge.
Material anisotropy
As shown in Table 3, the properties of this material are very different for different orientations subjected to rolling direction. Therefore, the anisotropy needs to be described correctly. In this study, the Hill 1948 yield criterion was used. The R value and normalized yield stress calculated using the Hill 1948 yield criterion fitted well with the experimental data for different orientation angles


(a) R value and (b) normalized yield stress calculated using the Hill 1948 yield criterion.
From the above figure, the anisotropy of this material can be expressed well using the Hill 1948 yield criterion. In the ABAQUS/Explicit simulation, the Hill 1948 function is expressed in terms of rectangular Cartesian stress components

where F, G, H, L, M, and N are the constants obtained by tests of the material in different orientations


where
Due to the form of the yield function, these ratios must be positive. If the constants F, G, and H are positive, the yield function is always well defined.
For the case of planar anisotropy, six anisotropic stress ratios are defined as follows


These anisotropic stress ratios were calculated in order to define the yield locus for this material.
FE modeling
In this research, the ABAQUS/Explicit software (version 6.13-1) 18 was used to analyze, predict, and determine the FLC using Hecker’s stretching process. 3 This FEM simulation can present many characteristics of the sheet metal forming process, such as stress–strain distribution, strain paths, and stress triaxiality.
Figure 6 depicts the FEM model for the punch stretching tests of the DP350 steel sheets. The upper and lower dies, punch, and blank holder were assigned as a rigid body, with the blank material assumed as a deformable element. We fixed the die in all the directions. The movement of the punch and blank holder was only in the vertical direction. The blank element was clamped by the concentration force acting on the blank holder. Coulomb’s law of friction was used to model the friction behavior. Parameters µ1 and µ2 are the friction coefficients between the blank and punch, the blank and die, or the blank and blank holder, respectively (µ1 = µ2 = 0, 1).

FEM model for punch stretching test simulation.
Figure 6 shows the FE model for Hecker’s punch stretching tests of the steel DP350 sheets. Here, a reduced 4-node shell element (S4R) was utilized for the blank; the size of the element for the blank section was approximately 1 and 1 mm in length and width, respectively. The die/tool and blank holder sections were assigned as rigid bodies in the analysis.
Combined FEM simulation/experiment and the results
FLC estimation
To predict the FLD of the DP350 steel sheet material, a simulation of Hecker’s press forming process was performed, considering the combination of the corresponding experiments through various specimens’ fracture heights. Figure 7 shows the experimental results, and the fracture height of the specimens is depicted in Figure 8. All of the fractures appeared at or near the top of the specimens. The FEM simulation for each specimen (named P1, P2, P3, and P4) was performed. The specimen height in each simulation was selected to be the same in each experiment. After each simulation, five strain pairs of five elements around the position of the fracture were taken and plotted in the major strain and minor strain graph. Each strain pair was plotted as a point denoted as follows (the order is arranged with declining major strains):
Specimen P1: five points named P1.1, P1.2, P1.3, P1.4, and P1.5 (Figure 9(a));
Specimen P2: five points named P2.1, P2.2, P2.3, P2.4, and P2.5 (Figure 9(b));
Specimen P3: five points named P3.1, P3.2, P3.3, P3.4, and P3.5 (Figure 9(c));
Specimen P4: five points named P4.1, P4.2, P4.3, P4.4, and P4.5 (Figure 9(d)).

Experimental results of specimens P1, P2, P3, and P4.

Fracture height of experimental results.
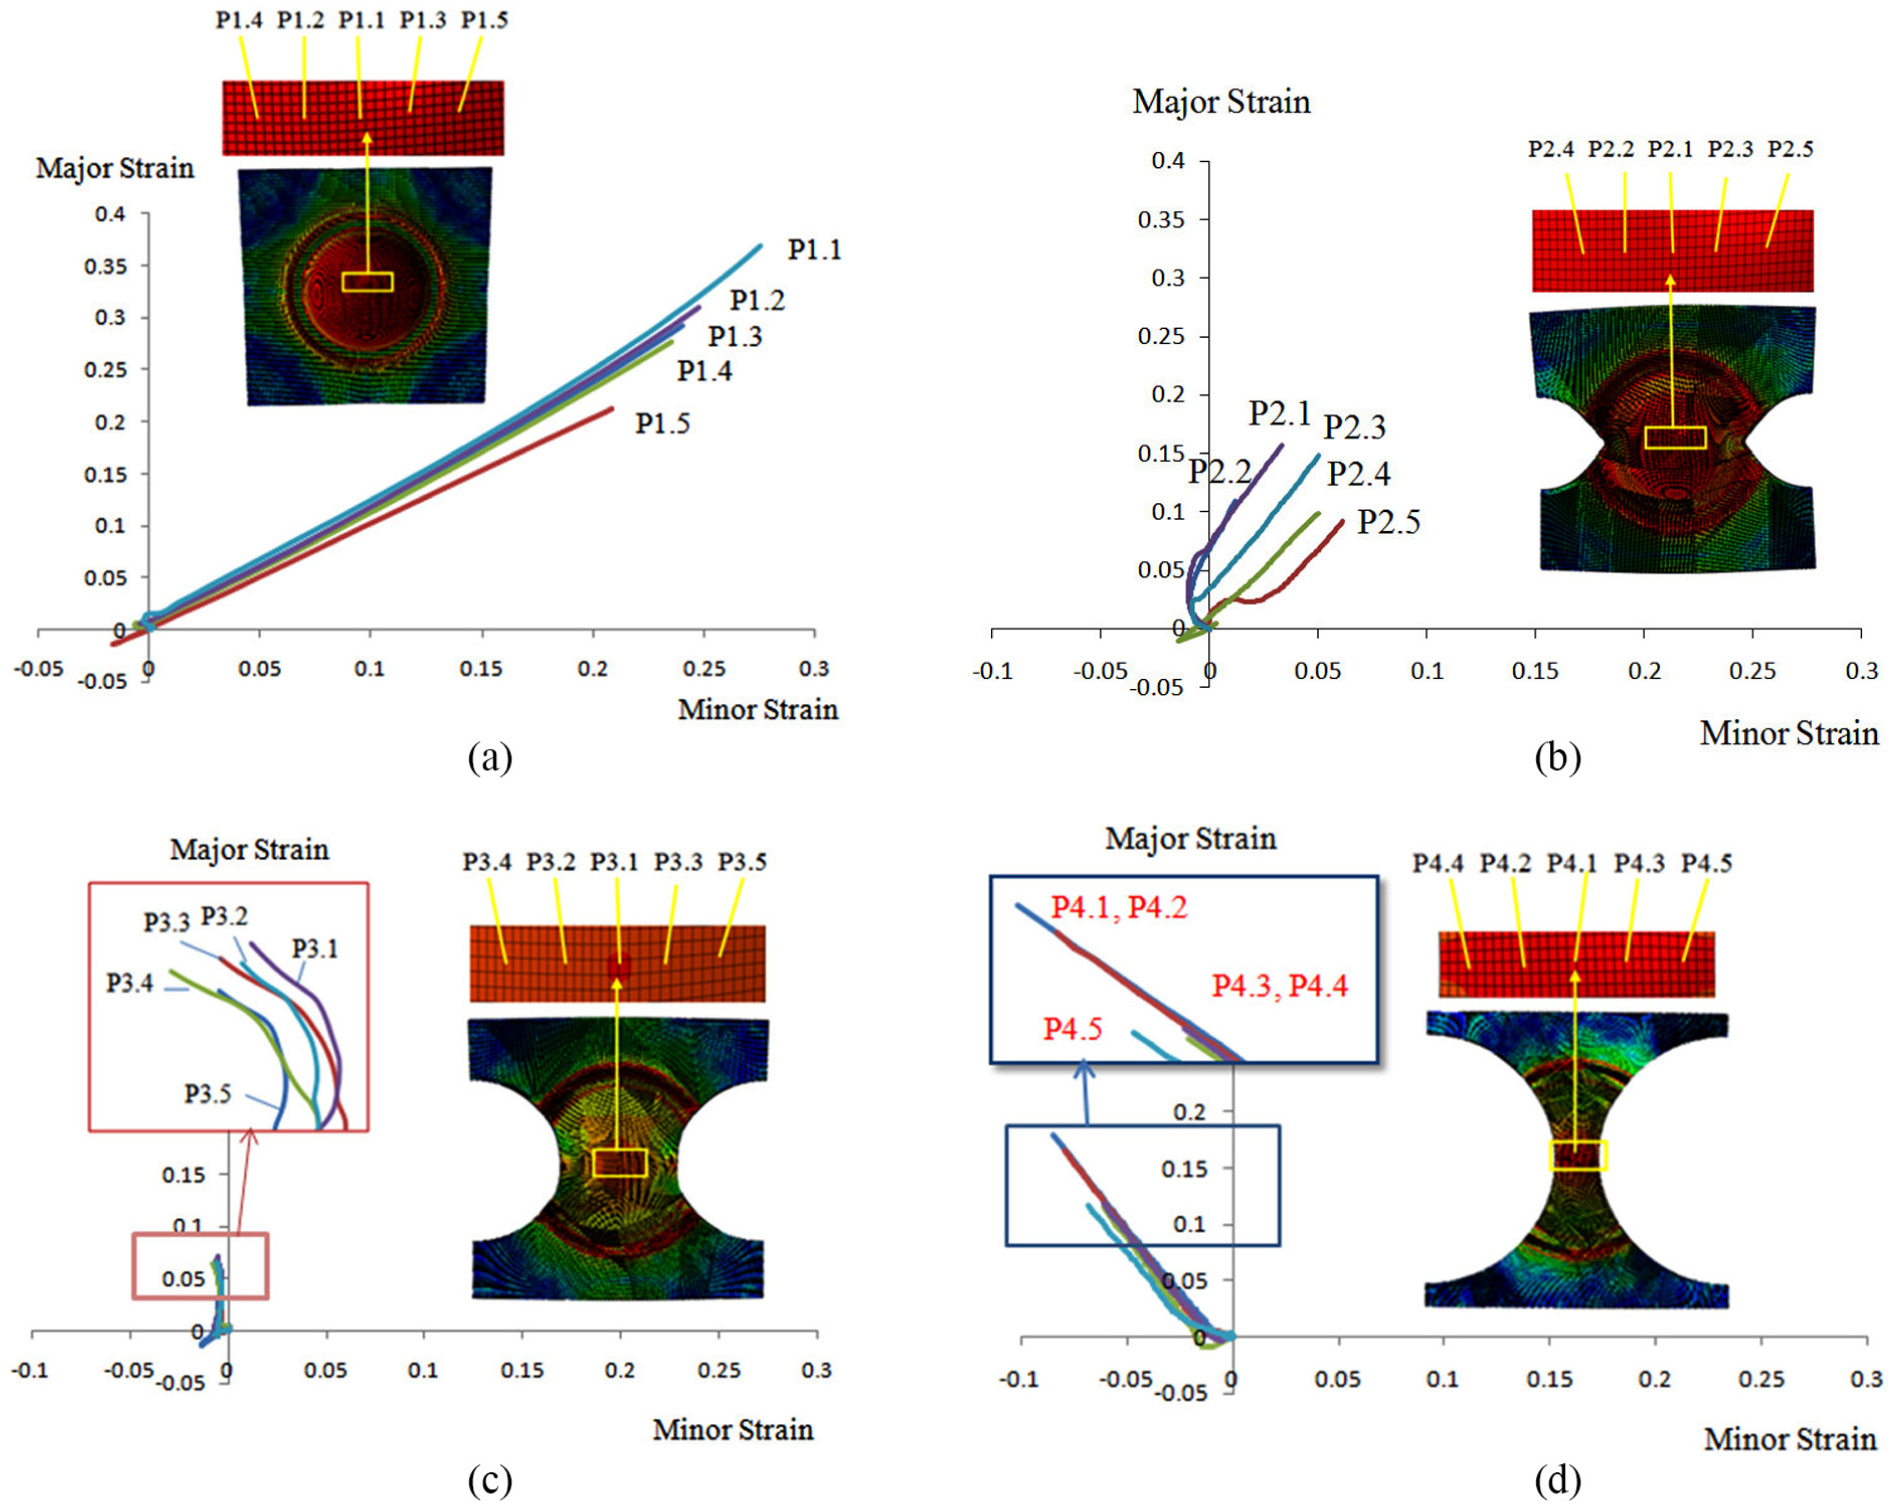
Strain paths of five points in the specimen numbered 1–4: (a) specimen P1, (b) specimen P2, (c) specimen P3, and (d) specimen P4.
To define each point of each specimen as neither a fracture point nor a safe point, the simulation for each specimen was performed again with the fracture limit diagram criterion (FLDCRT) in order to predict the fracture height.
The specimen P1 was simulated first. The fracture criterion was created by connecting the four highest points from each specimen (P1.1, P2.1, P3.1, and P4.1) to produce the trial FLC1.1 (Figure 10). This trial FLC1.1 was used to be the fracture criterion applied to the proceeding simulations for specimen P1.

Forming limit curve FLC1.1 is created by connecting the four highest points P1.1, P2.1, P3.1, and P4.1.
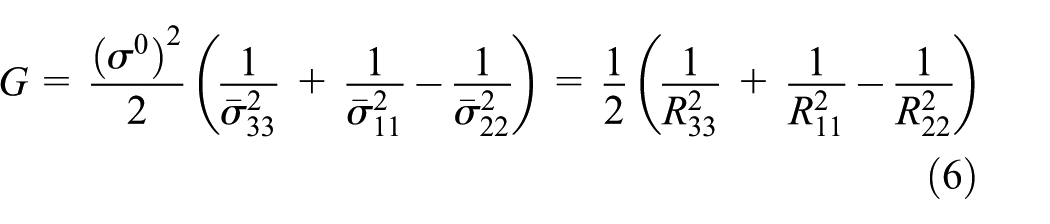
In the simulation, the fracture is considered to occur in one element when the FLC failure criterion in an element, which is defined by the ratio of the simulated major strains
To define the point P1.2 to be neither a fracture point nor a safe point, the trial FLC1.2 was created by connecting four points (P1.2, P2.1, P3.1, P4.1). This FLC1.2 is lower than the FLC1.1 that results from changing the point P1.1 by the point P1.2. The simulation for specimen P1 was performed again with the new trial FLC1.2. In this simulation, the fracture height is higher than the experimental value, and the point P1.2 is a safe point, as the other points P1.3, P1.4, and P1.5.
Following this, the specimen P2 was simulated. The trial FLC 2.1 (performed by connecting the points P1.1, P2.1, P3.1, and P4.1) was used and the result shows that the point P2.1 is a fracture point. The trial FLC2.2 was created (by connecting four points P1.1, P2.2, P3.1, and P4.1), and the simulation shows that the point P2.2 is also a fracture point. The trial FLC2.3 was created by connecting four points (P1.1, P2.3, P3.1, and P4.1). The point P2.3 was predicted as a safe point, as with the points P2.4 and P2.5.
The specimen P3 was simulated in the same way. The trial FLC 3.1 (connecting P1.1, P2.1, P3.1, and P4.1) was used and the result shows that the fracture height is the same as the experimental value. Hence, the point P3.1 is on the FLC.
Finally, the specimen P4 was simulated. The trial FLC 4.1 (P1.1, P2.1, P3.1, and P4.1) was used and the result shows that the point P4.1 is a fracture point. The trial FLC 4.2 (P1.1, P2.1, P3.1, and P4.1) was used and the result shows that the point P4.2 is a fracture point. The trial FLC4.3 was created by connecting four points (P1.1, P2.3, P3.1, and P4.3). The point P4.3 was predicted as a safe point, as with P4.4 and P4.5.
In Figure 11, the symbol (•) denotes a “safe” point and the symbol (*) a “fail” point. The FLC can be obtained as the solid line (boundary curve) by combining the safe and fail data and plotting on the axes of the major–minor strain.

The obtained FLC data.
FLC testing confirmation
To confirm the predicted FLC (in Figure 11), simulations were performed again for all the tested specimens from P1 to P4, respectively. Here, in the simulation, the predicted FLC was used to predict the fracture by FLDCRT criterion. As shown in Figure 12, the fractures of all the simulated specimens occur at the same heights of the corresponding experimental values.

The deformed specimens by simulation.
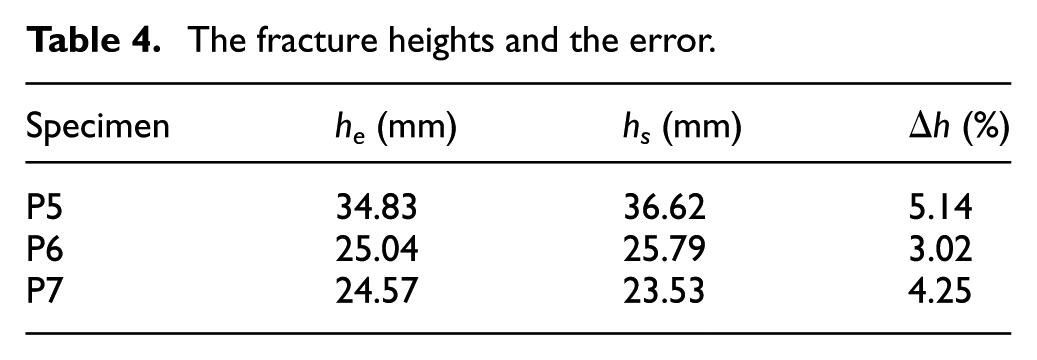
In addition, in order to prove the accuracy of the obtained FLC curve, the other specimens (numbered 5, 6, and 7), as shown in Figures 13 and 14(a), were also simulated and punch stretching tests were performed. When the fracture occurs in the simulation, the fracture heights hs were measured and compared with the experimental value he. Figure 14(a) shows the deformed shapes after experiments, and the corresponding simulations with the evolution of various strain paths at fracture points are depicted in Figure 14(b). To verify the accuracy of the proposed prediction, the error between the simulation and experimental fracture heights were calculated as shown in Table 4 using equation (16)


Specimens for confirmation tests.
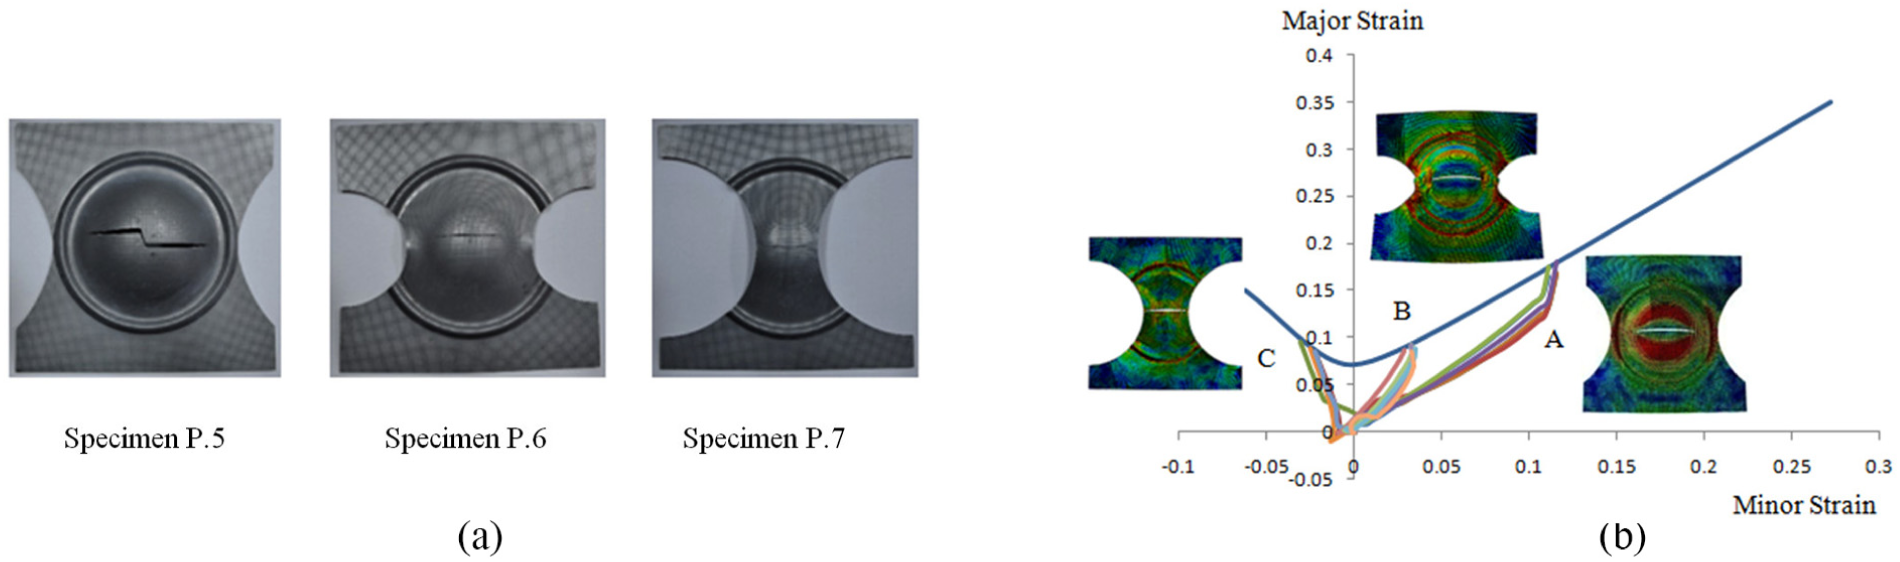
(a) Experimental specimens numbered 5, 6, and 7; (b) strain evolution A, B, and C for the specimens P5, P6, and P7 in the simulation.
The fracture heights and the error.
Conclusion
In this study, a method is proposed to derive FLC data with an improved accuracy by combining Hecker’s punch stretching tests and FE simulations. The predicted FLC was built through three steps: the initial prediction, correction by simulations, and confirmation tests. Results showed that the proposed FLC could predict the fracture position with a maximum error of 5.14% when compared with the experimental values. The process to estimate the proposed FLC for the sheet materials is sophisticated, measurement errors are eliminated, and expensive measuring techniques are not required. For future studies, this proposed method to obtain more accurate FLC curves will be applied to predict failures occurring in complex products of actual industrial forming processes.
Footnotes
Handling Editor: Yi Wang
Author’s note
Van-Cuong Do is now affiliated to Department of Mechanical Engineering, Kyungpook National University, Daegu, Korea.
Declaration of conflicting interests
The author(s) declared no potential conflicts of interest with respect to the research, authorship, and/or publication of this article.
Funding
The author(s) disclosed receipt of the following financial support for the research, authorship, and/or publication of this article: This research was funded by the Vietnam National Foundation for Science and Technology Development (NAFOSTED) under grant number “107.02-2016.01.”