
Abstract
In this study, upset forging experiments were performed on various uneven boundary frictional conditions generated using combinations of dies and specimens with differing surface conditions. Experimental points were established based on the experimental results as a regression using the response surface methodology and three-level full-factorial design of experiments. A regression model was constructed from a second-order model with interactive components by adopting a pointer variable and different qualitative parameters. Furthermore, a general regression model involving both frictional isotropy and anisotropy was constructed to predict the plastic deformation of materials after upset forging. The validity of the general regression model for the deformation of a forged piece was examined by conducting a finite-element analysis using the DEFORM-3D software. The simulation results demonstrate the reliability of the model in predicting the inhomogeneous friction pattern from the observed agreement between the finite-element analysis and experimental results.
Keywords
Introduction
The interface friction between dies and materials is one of the most important factors influencing material deformation in plastic processing. Ring upsetting is often adopted for friction measurement. Male and Cockcroft 1 developed friction calibration curves in which a ring specimen experienced plastic deformation, followed by bulging deformation. Their findings are summarised as follows:
Under a low interface friction, the external and internal diameters of the ring billet shift away from the ring axis during the upsetting process (Mode I of Figure 1).
The external diameter shifts away from the ring axis, while the internal diameter shifts towards it when the interface friction is large (exceeding a certain threshold) during the ring upsetting process (Mode II of Figure 1).

Schematic representation of the upsetting.
Han 2 adopted the finite-element method (FEM) to explore the influence of the material and frictional anisotropy on forged ring deformation. The cross-sectional deformation of the ring material after upset forging can be classified into two types (Figure 2). Isotropic deformation refers to a situation in which both the internal and external diameters of the cross section of the forged ring are constant; thus, the cross section has the form of concentric circles. However, in anisotropic deformation, the cross section of the forged ring has elliptic shapes. Menezes et al. 3 used FEM and divided the friction interface into four unequal zones. They discovered that the uneven friction significantly affected the stress distribution and profiles of the forged pieces. Rao et al. 4 studied deformation behaviours of Al-4Cu-2Mg alloy. Both experimental and theoretical results indicated that stress distribution was more likely to cause non-uniform deformation in the case of high interface friction and low height-to-width ratio of billet. GY Tzou et al. 5 from the compression force and free surfaces of outer and inner diameters shows a good agreement using FEM simulation to explore the plastic behaviours in the rotating compression under constant shear friction. P Christiansen et al. 6 present a combined numerical and experimental methodology for determining the stress–strain curve in the axial compression. Experimental results showed from cylindrical in different lubricants combined with the experimental determination of friction by means of ring compression tests allows compensating the effect of friction in the determination of the material flow curve. C Misirli et al. 7 used FEM simulation to study the character of the bimetallic cylindrical component which has an outer ring and inner solid cylinder throughout open die forging process. The results demonstrated that the flow of metal has inhomogeneity. Kang et al. 8 investigated the variations of frictional sensitivity and linearity of the frictional calibration curve. The appropriate tool design was determined to obtain the maximum frictional sensitivity and the highest linearity of the calibration curve. In recent years, finite-element analysis (FEA) using computational tools has become a major part of the research and development of plastic processing.
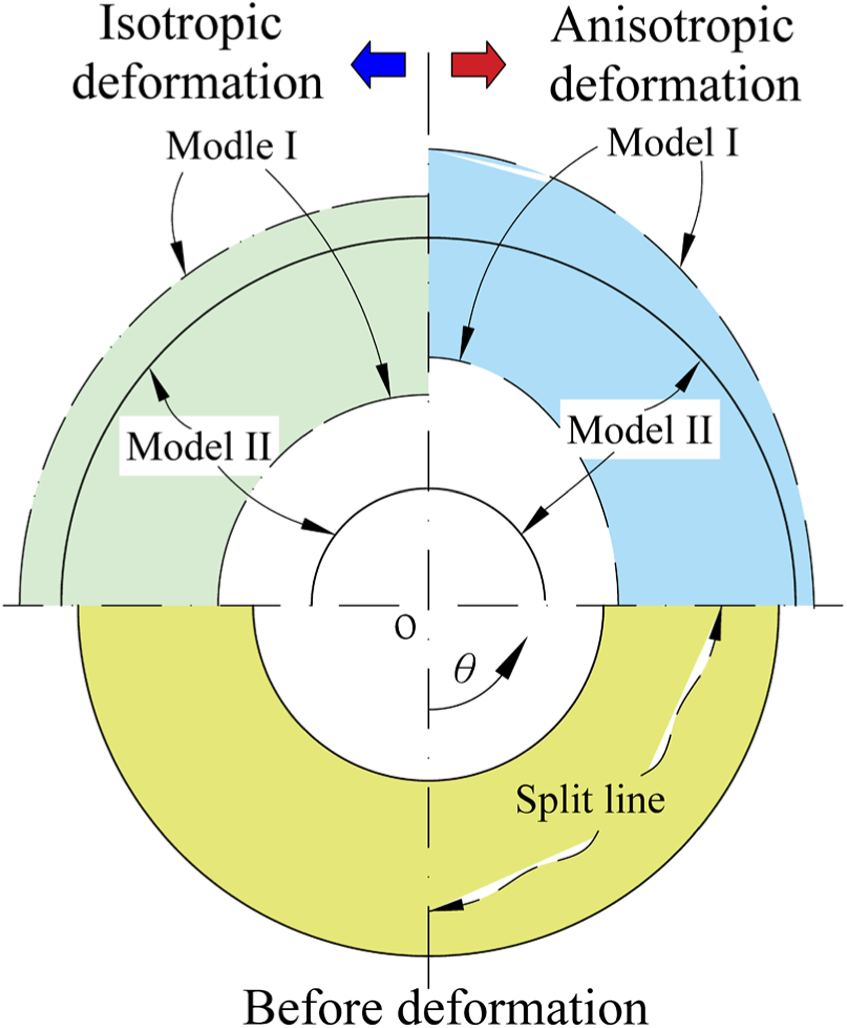
Schematic representation of cross section of the upset-forged ring.
The response surface methodology (RSM) has been used for a long time in design parameter optimisation. According to the optimisation design of preforming billets, RSM has been widely used in metal-forming processes. Regarding the deformation homogeneity in aerospace forgings, Y Yanhui et al. 9 adopted RSM to improve the deformation homogeneity of a typical aero engine disc by optimising the preforming billet based on an FEM simulation. Based on the FEM results, RSM has been used to establish an approximate model to depict the relationship between the responses (deformation homogeneity and die under filling) and the design variables represented by the geometric parameters of the preform shape. Kumar et al. 10 studied vibro-acoustic design optimisation using RSM and performed a structural analysis using FEM. The design parameters of the model can be varied to create various solutions. The best-suited solution will then be adopted for production purposes. Vasundara and Padmanaban 11 predicted the fixture layout and minimised the maximum elastic deformation of the work piece during machining. In this study, a numerical example was considered from the literature to compare the performances of artificial neural network (ANN) and RSM. Camposeco-Negrete 12 used a central composite design (CCD), and the response surface method was employed to obtain a regression model. Moreover, the relationship between the cutting parameters and response variables was analysed. Kumar and Patil 13 stated that an optimised number of connecting bolts can be identified using the detuning principle and RSM optimisation technique. RSM was used for parametric optimisation, while FEA was used to calculate the modal frequency and mode shapes. Torabi et al. 14 applied the Deform-3D FE software to simulate a blade forging process, in which the maximum filling ratio of the final die to the minimum flash volume, the forging force and the strain variance of the final blade were considered as optimisation objectives, and an optimised preforming billet with an extruded elliptical cross section was obtained using RSM and a multi-objective genetic algorithm. Zhu et al. 15 used RSM to optimise the cooperative feed strategy for the radial–axial ring rolling process by combining it with an improved and verified 3D coupled thermo-mechanical finite-element model. RSM was used based on the FEM results to establish a response model to express the relationship between the objective response and design variables. Gao et al. 16 developed RSM models and suggested that increasing the fillet radii of the left and middle ribs is effective in improving the process forming limit during local loading forming of rib–web components.
The above-mentioned studies reported that the anisotropic deformation of a forged piece is mainly caused by billet inhomogeneity and the non-uniform distribution of interface friction. However, relevant existing studies focused on the effect of interface roughness on the lubrication effect, while few studies focused on the phenomena caused by the interface surface topography. Moreover, friction is often assumed to be isotropic in theoretical analysis, thereby producing a certain error in the analysis results in comparison with the experimental data. Considering this fact and based on the design of upset forging, in this study, a friction model that can lead to the anisotropic deformation of materials was developed using the results of actual forging experiments. Experimental points were designed and established using RSM, with the aim of achieving the most efficient results using the least experimental points. Investigations and discussions were conducted to determine the most appropriate friction factor model. Moreover, an integrated regression model involving both isotropic and anisotropic friction was built and applied to analyse the forged-piece deformation in the finite-element software DEFORM. A method that can predict the inhomogeneous deformation of a forged piece under the action of a non-uniform interface friction was devised. With this method, the effect of friction shear stress on the shape forming of a forged piece can be better regulated to enhance the machining accuracy and quality.
Materials and methods
Platen surfaces were machined into morphologies with concentric circles and parallel lines using a lathe and a grinder. The surface roughness of the platen with concentric circles was Ra = 1.5 μm, while that with parallel lines was Ra = 0.3 μm (//) parallel to the line direction and Ra = 0.6 μm (⊥) perpendicular to the line direction.
Specimen specification and preparation
The specimens were manufactured using 6061 aluminium alloy. According to the standard dimensions suggested by Male and Cockcroft, 1 the ring dimensions were 30×15×10 mm, and those of the cylinder were 20×20 mm. The surface roughness was divided into three levels in Figure 3(a) and (b) (i.e. C1, C2 and C3 and L1, L2 and L3, respectively) to realise the diversification of interface friction. Figure 3(a) shows the specimen surfaces in the morphology of the concentric circles, where specimens C1–C3 had different surface roughness values. Figure 3(b) illustrates the specimen surfaces in the morphology of parallel lines, where specimens L1–L3 possessed different surface roughness values parallel and perpendicular to the line direction. The material parameters were k = 211.71 MPa and n = 0.1355. The yield strength and elastic modulus were 64.50 MPa and 66.07 GPa, respectively.

Specimen surface topography: (a) concentric circles and (b) parallel lines. (The scale bar indicates 1 mm.)
Experimental conditions
The experiments used CPC super oil (15 W/40) for interface lubrication. The experimental conditions could be classified into five types (Figure 4) based on the surface morphology combinations of the die and the specimen. Therefore, aside from the interface pair in Figure 4(a) with geometrical isotropy, all combinations from Figure 4(b)–(e) demonstrated a geometrical inhomogeneity feature.

Surface morphology combinations of the die and the specimen: (a) CCC, (b) CHC, (c) HCH, (d) HHH and (e) HVH.
Coding convention
The experimental conditions were expressed using the code convention of ‘upper platen – specimen – lower platen – specimen roughness level’. C represents concentric circles, while H and V represent the parallel lines for both the die and the specimen, respectively. Hence, HVH3 represents a combination of the die and the specimen in the morphology of parallel lines, with the lines on the upper and lower platens parallel to each other and the lines on the dies perpendicular to those on the specimen, with a specimen roughness level of 3.
Inhomogeneous deformation factors
Under lubricating conditions, the experimental results showed that the end faces of the specimens all demonstrate the deformation characteristic of anisotropic extension if the dies with the parallel-line surface pattern were combined with the specimens. The degree of extension increases with height reduction, as shown in Figure 5.

Experimental results of the upset forging: (a) CCC3 (9.2%, 30.2% and 47%), (b) CHC3 (9.8%, 30.6% and 49.2%), (c) HCH3 (9.2%, 32.8% and 49.8%), (d) HHH3 (10.6%, 29.8% and 48%) and (e) HVH3 (10.2%, 29% and 49.8%).
A comparison of the surface morphology and combinations between Figure 4(b)–(e) indicate that the main difference lies in the die surface pattern. Hence, the inhomogeneous deformation of a forged piece is generated under conditions of lubrication on the interface and directional characteristic of the die surface morphology.
RSM
RSM can be used to obtain the regression results of experiments and to determine the effect of each factor in the experiments, including cross effects between complex factors.
Basic principle
In terms of classification, the regression models can be categorised as first-order polynomial models with interactive components and second-order polynomial models.
The general first-order regression polynomial with interactive components is presented as follows

The second-order regression polynomial is

In a regression model, y is a function of
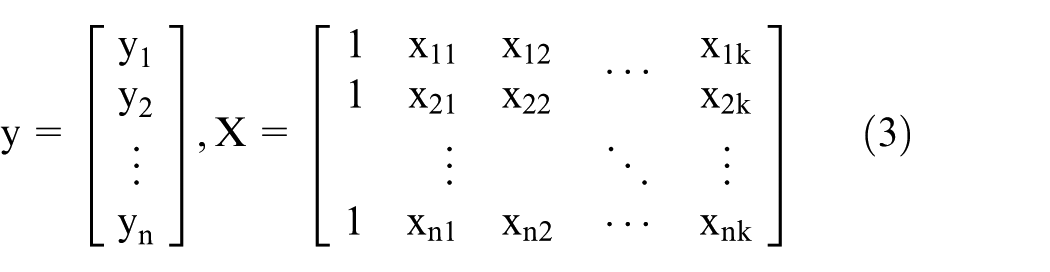

∴
The quadratic sum of the residuals is presented as
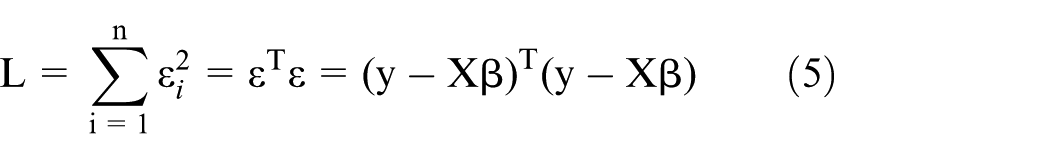
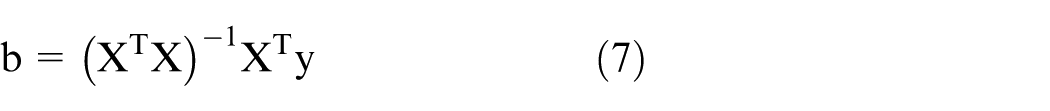
The above equation shows that the quadratic sum of residuals is a function of the regression coefficient. Based on the extreme value theory, we obtain the following equation by differentiating L, letting the differential be 0 and replacing β with the estimation coefficient b

Before adopting the prediction model, we need to examine the obviousness of the regression model, which can be fulfilled by conducting the F-test. The following statistics need to be defined for the F-test


The coefficient of determination

The coefficient of determination has a value between 0 and 1. A larger coefficient of determination indicates a better model. This value would possibly be overestimated for high-complexity models because the coefficient of determination generally increases with the increased model complexity in a directly proportional manner. Therefore, the coefficient of determination is adjusted as

where n is the number of data points and p is the number of model coefficients.
The regression model can be examined using the F-statistic

where n is the number of data points and k is the number of independent variables in the model.
The equation above shows that the F-statistic is equal to the ratio between the explained mean square error
Most of the experimental factors are universally quantitative variables (i.e. quality factors of continuous physical quantities). Some variables, such as the factors of discontinuous physical quantities, are qualitative and called qualitative variables. A pointer variable can be regarded as an on/off switch or a calibrated value of a general quality factor coefficient. Hence, pointer variables have no quadratic component in the regression polynomial; rather, they have a first-order interactive component.
Regression model structure
A model was constructed through the regression method using the experimental results of frictional isotropy and frictional anisotropy. The quality characteristic was defined as the friction factor. The surface patterns of the die and the specimen, specimen surface roughness, measuring angle and specimen reduction were defined as the quality factors.
Among the quality factors, the specimen surface roughness, measuring angle and specimen reduction are continuous variables that can be regressed using natural variables. However, the combination of the surface morphology patterns of the die and the specimen is qualitative, thereby rendering these surface morphology patterns useful. This variable is represented using pointer variables. The pattern combinations (the qualitative factor) have five types, as illustrated in Figure 4 (viz. (a) CCC, (b) CHC, (c) HCH, (d) HHH and (e) HVH) and expressed by the pointer variables X1–X4. X5–X7 denote continuous variables. X5 denotes the measuring angle with a natural variable unit of radian, X6 denotes the specimen surface roughness with a natural variable unit of micrometre and X7 denotes the specimen reduction represented as a percentage from the ratio between the initial and compressed heights.
A general model was built by integrating the qualitative and continuous factors with the help of pointer variables. The general model is expressed as follows

where Y denotes the friction factor. The cross-multiplying components between the pointer variables could be omitted through this coding method.
FEA
The general model established using RSM was analysed in the finite-element software DEFORM-3D to discuss the issues involved in upset forging. This model was then verified using the results of the experiments on the ring and cylinder specimens. Referring to the approach in Menezes et al., 3 the die–specimen interface was divided into multiple friction areas using some finite-element modelling.
Results and discussions
General optimal model
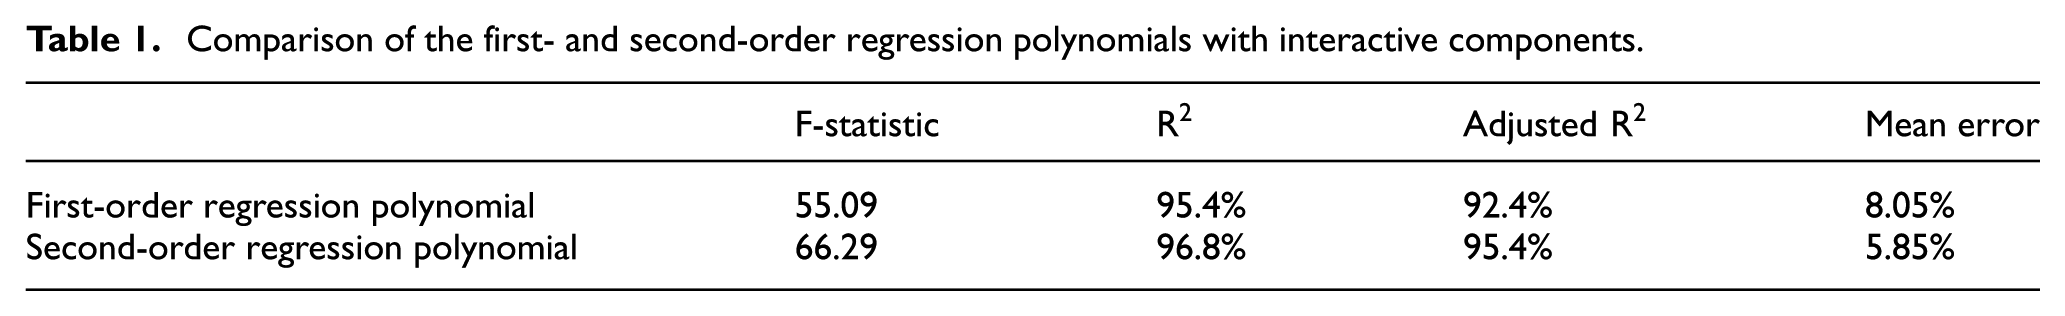
A statistical software program called Minitab was used to calculate a simplified coefficient and remove an unimportant coefficient using equation (16). As shown in Table 1, the second-order structure was superior to the first-order structure in terms of both the obviousness determination using the F-statistic and the values of the determination coefficient. A more simple and obvious model compared to equation (15) was obtained as follows

Comparison of the first- and second-order regression polynomials with interactive components.
Regression model examination and verification
Apart from high accuracy on the modelling points, a good regression model also needs to achieve a certain level of accuracy on the non-modelling points. Hence, examination had to be conducted on a certain number of non-modelling points, named examining points. Points with a reduction of 10%, 30% and 50% were adopted as the modelling points, and those with a reduction of 20% and 40% were adopted as the examining points (Supplementary Table A) for the general optimal model. The results indicated that the total error of the general optimal model and its examining points was 8.91%.
Finite-element theory verification
The forging deformation results were predicted and compared with the experimental results using the experimental data of upsetting (bulged and end-face profiles). The friction factor calculated using the general optimal model (equation (16)) was applied to simulate the forging results of cylinders.
As shown in Figure 6, the results of both experiment and theory showed the anisotropic deformation (ellipticity) of the forged specimen surface caused by the friction inhomogeneity. The anisotropic deformation of material particles flowing inhomogeneously was generated because particles in the friction areas with higher stresses experienced larger flow resistances than the particles in the areas with lower stresses. The results demonstrated that the effect of friction inhomogeneity on the ovalisation of the specimen surface profile simulated in DEFORM-3D was in qualitative agreement with the experimental results.
Comparison of the end-face profile for the friction inhomogeneity between the experimental and theoretical results.
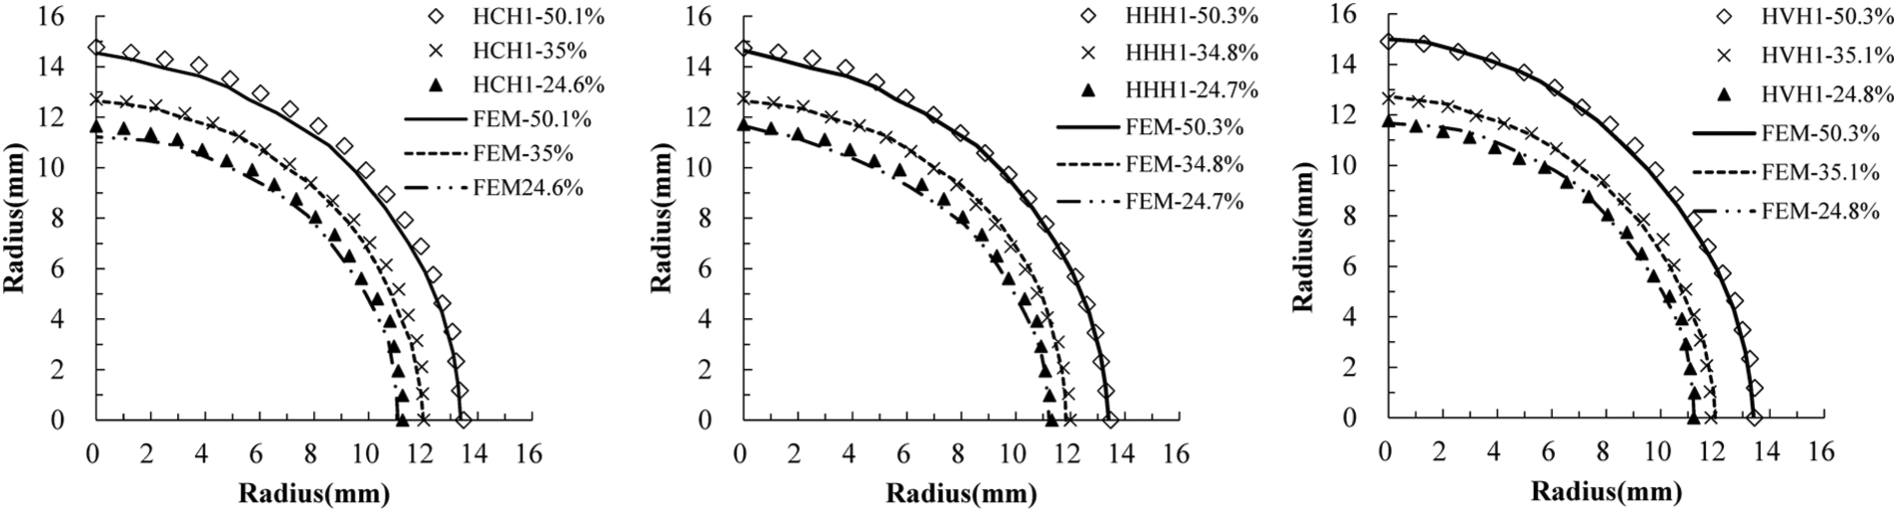
As suggested by previous researchers, the bulged profile1–3 is caused by frictional shear stress. A more significant bulged profile indicates a larger frictional stress. Both experimental and simulation analysis results (Figures 7–9) demonstrated that the bulging phenomenon in the areas with a larger coefficient of friction was more obvious in restricting the plastic flow of material particles. The application of the general optimal model regressed using RSM in the analysis of cylinder forging exhibited good consistency in both the end-face and bulged profiles.

Comparison of the bulged profile between the experimental and theoretical results (HCH1).

Comparison of the bulged profile between the experimental and theoretical results (HHH1).

Comparison of the bulged profile between the experimental and theoretical results (HVH1).
Conclusion
The following conclusions were obtained from the study results:
The general optimal model proposed in this study involves both frictional isotropy and frictional anisotropy. Using qualitative variables and CCD to redesign the experimental points, the model was integrated and expressed using a single equation (equation (16)).
It was proved that the use of more data would not necessarily lead to a more accurate regression model. The model obviousness is directly related to the model structure and design of experiments.
The model proposed in this study comprised second-order polynomials with interactive components. This model was verified to possess optimal obviousness and accuracy by substituting examining points into the model and comparing it with a first-order polynomial model with interactive components. The mean error was 5.85%, as indicated in Table 1.
The general optimal model (equation (16)) was applied in the FEA in DEFORM-3D, and the model was examined in forging experiments. The results indicate a substantial accuracy in predicting the end-face profile of an upset forged piece and the lateral bulging profile.
Supplemental Material
Supplementary_Material__18_Mar_1 – Supplemental material for Application of response surface methodology to establish friction model of upset forging
Supplemental material, Supplementary_Material__18_Mar_1 for Application of response surface methodology to establish friction model of upset forging by Jia-Jyun Hong and Wei-Ching Yeh in Advances in Mechanical Engineering
Footnotes
Handling Editor: Xiao-Jun Yang
Declaration of conflicting interests
The author(s) declared no potential conflicts of interest with respect to the research, authorship and/or publication of this article.
Funding
The author(s) disclosed receipt of the following financial support for the research, authorship and/or publication of this article: This study was supported by the National Science Council, Taiwan, under grant NSC 100-2221-E-008-032.
Supplemental material
Supplementary material for this article is available online.
References
Supplementary Material
Please find the following supplemental material available below.
For Open Access articles published under a Creative Commons License, all supplemental material carries the same license as the article it is associated with.
For non-Open Access articles published, all supplemental material carries a non-exclusive license, and permission requests for re-use of supplemental material or any part of supplemental material shall be sent directly to the copyright owner as specified in the copyright notice associated with the article.