
Abstract
The independent driving ability of the four-wheel independent drive electric vehicles can be used to improve the energy efficiency of the vehicle. The composition and structure of a prototype were introduced in this article and the rapid prototype was applied to design the upper-level control system. Experimental data obtained from the bench tests and the chassis dynamometer tests were employed to generate the torque response performance and power efficiency map of the in-wheel motor. The control logic of the in-wheel motor was obtained based on the least squares method. Besides, a front and rear axle torque distribution method was proposed to reduce the energy consumption of vehicle, and the simulating test of the prototype was conducted based on the in-wheel motor efficiency map. Simulation analysis of vehicle energy consumption in vehicle driving cycle was carried out in ways of rear axle drive, average torque allocation, and optimized torque energy-saving allocation; the results show that the optimized torque energy-saving allocation strategy can decrease the energy consumption up to approximately 0.117 and 0.426 kJ per unit mileage comparing with the rear axle drive and average torque allocation.
Introduction
Compared with an internal combustion engine (ICE)-driven vehicles, new energy vehicles have great advantages in emissions and fuel consumption reduction. Among new energy vehicles, the electric vehicle (EV) with four independent drive in-wheel motors has the following unique features. First, there are no mechanical links between each wheel, which means all wheels can drive independently. Second, the motor installed in the wheel can be controlled independently to implement control strategies such as antilock brake system (ABS), traction control system (TCS), and vehicle stability control (VSC) easily. 1 Third, the energy characterization of each independent in-wheel motor can be used to optimize the vehicle energy performance.
Considering the unique features of the EV with four independent drive in-wheel motors, a lot of research works have been done and most of these research works can be divided into two directions. One of the two research directions is vehicle dynamic control and the other is energy operation optimization. Vehicle yaw rate is an important evaluation index usually chosen to represent the vehicle state,2,3 and Y Hori and colleagues4–6 studied different vehicle yaw rate control stratagems to optimize the traction force distribution and vehicle stability control based on their “UOT Electric March.” Vehicle yaw rate is the higher-level control target, using the hierarchical coordinate control idea; the torque distribution method in lower-level has been proposed.7–12 Considering the driving conditions, the whole vehicle operation energy consumption can be optimized based on the motor efficiency and torque response performance.8,13–17
The torque response, energy efficiency, motor speed of the in-wheel motor, and the control signal from the controller were obtained based on the bench test, which provides the foundational information for the vehicle control and energy efficiency optimization. The analysis of power consumption and energy efficiency was conducted based on the experimental data obtained in chassis dynamometer tests and road tests of a prototyping EV with four independent drive in-wheel motors. The vehicle is developed based on a pure EV with one central motor by the research group. Due to the nonlinearity of the in-wheel motor energy efficiency, a torque distribution method of the front and rear axle is proposed to show the potential for improving the vehicle energy performance.
The remainder of this article is organized as follows. Description of the prototyping vehicle and the upper-level coordinate control system are presented in section “In-wheel motor drive EV.” The torque response, energy efficiency characterization, and control logic of the in-wheel based on bench test data are described in sections “Energy efficiency analysis” and “Vehicle energy optimization.” The algorithm of optimal torque energy-saving allocation is simulated and discussed in Economic Commission for Europe (ECE) urban road driving cycle using MATLAB/Simulink in section “Simulation results and discussions,” and the conclusions are given in section “Conclusion.”
In-wheel motor drive EV
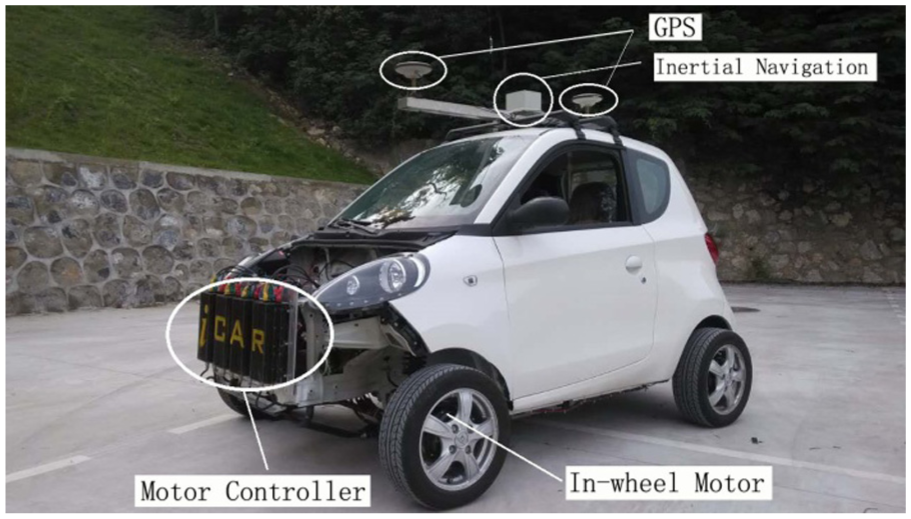
Figure 1 shows the developed prototyping EV transformed from a pure EV with one central motor. Equipped with four customized 3-kW in-wheel motors, each wheel of the vehicle can be actuated independently, as shown in Figure 2. Taking the requirements of power density, compactness, lightweight, and cost into consideration, permanent-magnet brushless direct-current (BLDC) electric motor was chosen to make the in-wheel motors. 13 The basic parameters of the EV and the main components are listed in Table 1.
In-wheel motor drive electric vehicle.

In-wheel motor and wheel speed sensor.
Specifications of the vehicle.

Equipped with four in-wheel motors, the torque of each wheel can be controlled by giving different control signals to the motor controller, respectively. The effective control signal voltage ranges from 1 to 3 V, corresponding to zero to maximal torque values. The rotational speed of each wheel is measured by the hall speed sensor that generates the pulse signal when the teeth go through the sensor probe, as shown in Figure 2. A 72-V lithium-ion battery is chosen to be the only power source of the whole EV and a battery management system (BMS) is installed to monitor the battery states. A DC/DC converter is needed to power other electric equipment in the vehicle by reducing the battery voltage from 72 to 12 V. For analyzing the motor operating condition, a voltage sensor and four current sensors are used to measure the battery voltage and current consumed by the motor controller, respectively. The high-precision global positioning system (GPS) and inertial navigation on the top of the vehicle can record the real-time vehicle trajectory and attitude, as shown in Figure 1, and the structure diagram of the prototyping vehicle is shown in Figure 3.

Structure diagram of the prototype vehicle.
Besides, a rapid prototyping based on MATLAB/Simulink has been used to design the upper-level control system, which works coordinately with the four in-wheel motor controllers and records all the control signals and vehicle states at real time through the high-speed Controller Area Network (CAN) bus, as shown in Figure 4. Sensor signals are received through the analog and frequency input channels, respectively, then the control signals for the motor controllers can be obtained based on the reference model, which outputs through the pulse width modulation (PWM) output channels. But only analog signals can be received by the in-wheel motor controller, so a PWM-to-analog converter is needed to make the rapid prototyping and in-wheel motors work together. The CAN bus is used to send all the signals of the rapid prototyping and vehicle state to a laptop computer.

Control system of the rapid prototyping.
Energy efficiency analysis
Energy efficiency is very important for EVs to optimize the operational energy consumptions and maximize the travel ranges. There are two kinds of energy efficiency worth paying attention to. One is the efficiency of the battery power and motor power, which is mostly determined by the in-wheel motor and controller performance, and the other is that energy efficiency of the battery power and wheel driving power should be considered, which causes the power loss while tire rolling on the road and affects the wheel driving efficiency.
Driving wheel efficiency
The driving wheel efficiency test was conducted on the chassis dynamometer, as shown in Figure 5. Before the test, the rolling inertia and frictional coefficient of the chassis dynamometer were calibrated at different speeds through real road test to analyze the frictional torque loss. The ECE urban driving cycle and constant velocity condition were simulated on the chassis dynamometer. Figure 6 shows the in-wheel motor control signal and vehicle velocity curve during the ECE urban cycle test, and Figure 7 shows the battery current and voltage. The minimum control signal is not zero, which is caused by the initial voltage of the pedal. But the minimum response signal of the in-wheel motor controller is 0.9 V, so there is no vehicle velocity change during 0–0.9 V. Compared with the target vehicle speed, the real vehicle speed can follow very well which means that the vehicle has good dynamic performance. The current in Figure 7 increased sharply during the fast acceleration condition and keeps stable while the vehicle is running at constant speed.

Chassis dynamometer test.

Vehicle speed and in-wheel motor control signal during the simulated road test on a chassis dynamometer.

Battery current and voltage during the simulated road test on a chassis dynamometer.
From Table 2, it can be found that the maximum efficiency is only 67.5% at the speed of 40 km/h, as well as the efficiency dropped to 58.3% at a low speed of 15.2 km/h. The efficiency increased to a maximum value and then started to decrease with the speed increasing, which is attributed to the low motor efficiency at small torque. The torque of each wheel can be controlled independently which is an advantage that can be used to optimize the operational energy consumptions and maximize the travel ranges of the EV.
Driving wheel efficiency at different speeds.

In-wheel motor energy efficiency
In this section, the efficiency of battery power and wheel driving power has been studied. Note that this efficiency contains two parts: the motor efficiency and the tire rolling loss. Tire rolling loss is hard to obtain, but the motor efficiency is much easier.
In this article, the in-wheel motor and the motor controller are treated as one unit, which outputs the motor torque and inputs the control signal. During the in-wheel motor performance bench test, the motor controller control signals were changed from 1.0 to 3.0 V with a 0.2-V step at different motor speeds. The test bench consists of a magnetic powder brake, a speed and torque sensor, and the fixture of the motor, as shown in Figure 8. The magnetic powder brake was used to make resistance torque, and the speed and torque sensor was used to measure the motor torque and speed at different control signals. Besides, Digatron battery test system was used to supply a constant voltage of 72 V.

Test bench of the in-wheel motor.
Figure 9 shows the power of in-wheel motor at different speeds and control signals, and the maximum power value is close to 6 kW. The in-wheel motor power increases with the growth of motor torque but becomes stable gradually. This may be attributed to the power limit function of the motor controller which will actively stabilize the current if the current value gets close to the upper limit value.
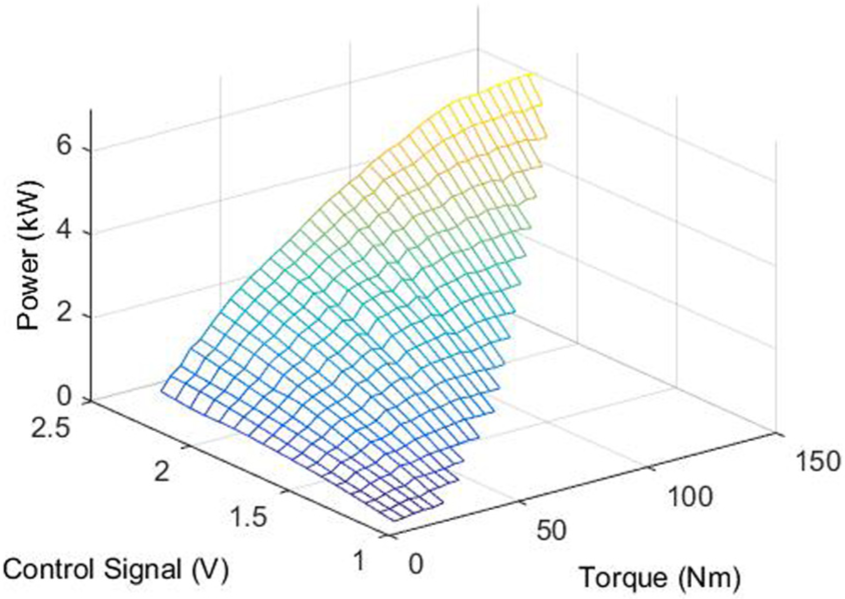
Power of the in-wheel motor.
The ratio of battery power and motor power is the efficiency of the motor, which determines how much of the battery power is transferred to the motor and is mostly determined by the in-wheel motor and controller performance, as shown in Figure 10. The efficiency increases with the torque until it reaches the maximum value. Moreover, at a certain torque, the maximum efficiency reaches 80%. Compared with the driving wheel efficiency in Table 2, the motor efficiency is a little higher due to the wheel power loss.
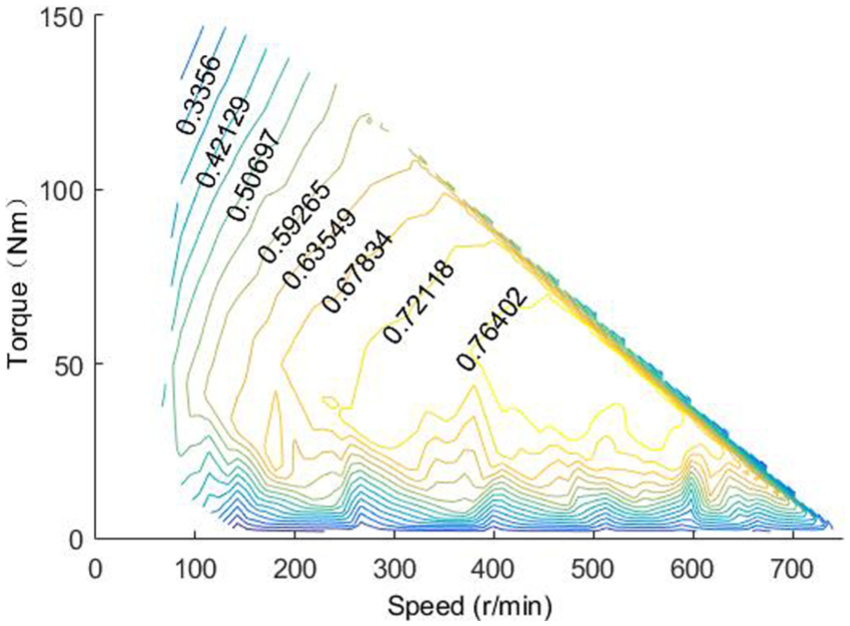
Efficiency MAP of the in-wheel motor.
Vehicle energy optimization
The whole power consumed by the four motors can be expressed as follows

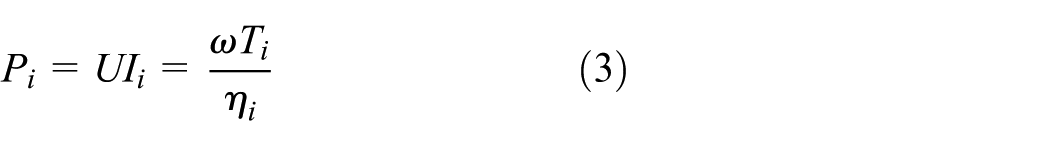
where U is the battery voltage and I is the battery current consumed by each motor controller. According to the driving efficiency definition, the in-wheel motor efficiency in driving condition can be written as follows
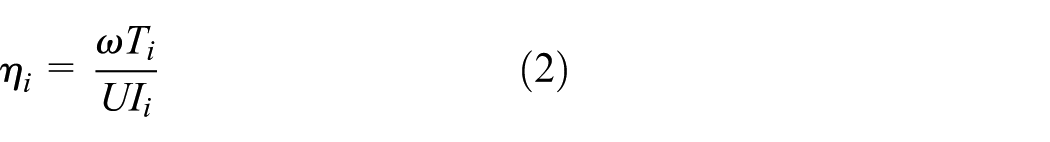
where i indicates fl, fr, rl, rr of each wheel; ω is the wheel speed; and T is the in-wheel motor torque. Thus, battery power consumed by each wheel can be rewritten as follows
where η is the function of motor speed and torque, which can be obtained through experimental date fitting, as shown in Figure 8. The motor torque of each wheel must satisfy the following equation for vehicle driving

where Tx is the total motor torque supplied to reach the target vehicle speed, and Tf and Tr are driving torque of front axle and rear axle, respectively. The energy optimization problem can be converted to torque distribution for minimum power consumption. At the certain vehicle speed, the power consumed by front and rear axles can be expressed as follows

For the minimum power consumption target, the suitable

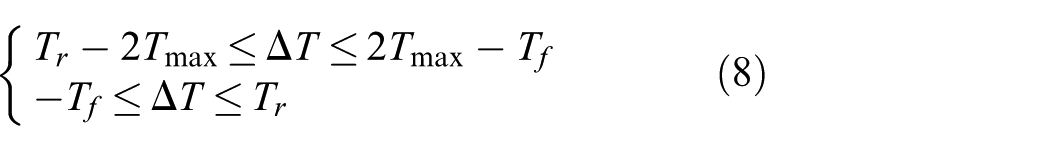
Note the Tmax is the maximal driving torque a motor can provide. So ΔT should be bounded by

At the certain speed, the optimized
Through the in-wheel motor bench test in section “Energy efficiency analysis,” the motor torque at different speeds and control signals can be obtained, as shown in Figure 11. It obviously shows that the motor torque is proportional to the motor speed at the certain control signal.

The torque of the in-wheel motor.
The motor torque response characterization was obtained based on the experimental data applying the least squares method. Assuming that the highest degree of the fitting polynomial is n, the function of motor torque and speed can be expressed as follows

where j is the polynomial order number, Kj is the coefficient, T is the motor torque, and ω is the motor speed. Using equation (9) to fit the motor torque and speed data (ωi, Ti) obtained from the bench test, the error ri between the actual value and the measured value can be expressed as follows

Choosing the error square sum to indicate the fitting precision, the object is to minimize the sum as expressed by
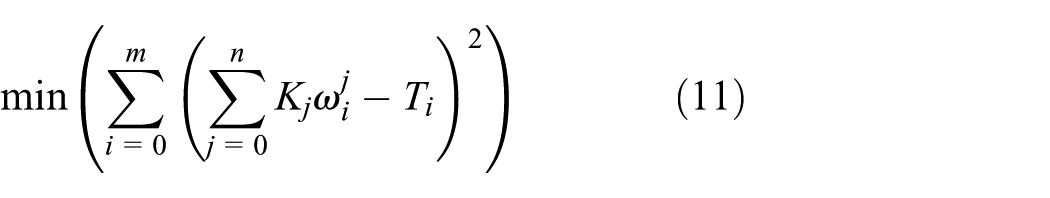
It is easy to find that the motor torque is proportional to the motor speed, as shown in Figure 11, so the linear polynomial is used to fit experimental data as expressed by

The coefficients K1 and K2 in formula (11) are the functions of the control signal. The least squares method was used again and the quadratic polynomial can be obtained as expressed by

where v is the control signal.
Based on the experimental data, the fitting curve of motor torque and motor speed at different control signals is shown in Figure 12.

Motor torque at different speeds and control signals.
Considering the limiting case of driving torque distribution of front and rear axle, which means driving with the only front axle or rear axle, the comparison of power consumption with four-wheel straight driving at the same speed was made. It is found that the power consumption of two-wheel drive is smaller than the four-wheel drive based on the straight-line constant-speed road test, as shown in Figure 13. Figure 13 also shows that the power consumption of two modes is almost the same at the low speed of 10 km/h. That is because that the motor efficiency is low at low speed as the motor efficiency shown in Figure 10. Driving only with the front or rear axle is the limiting case, so the energy-saving result is not quite obvious but it shows the potential energy efficiency improving the probability of the EV.

Power consumption comparison of different driving modes.
Simulation results and discussions
The demanded torque for vehicle running can be calculated by the following travel equation
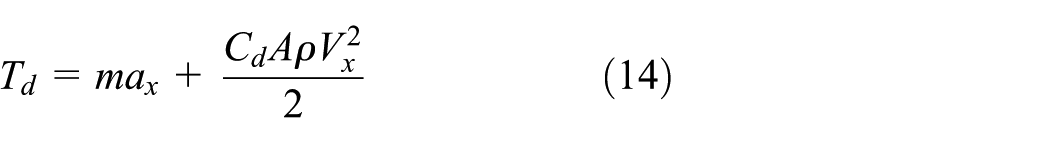
where m is the mass of the whole car, ax is the longitudinal acceleration, A is the vehicle frontal area, ρ is the air density, Cd is the air resistance coefficient, and Vx is vehicle speed. Figure 14 shows the ECE urban road driving cycle. The algorithm of optimal torque energy-saving allocation is simulated in light of ECE urban road driving cycle in MATLAB/Simulink; an analysis is given to embody effect of the algorithm on energy saving.
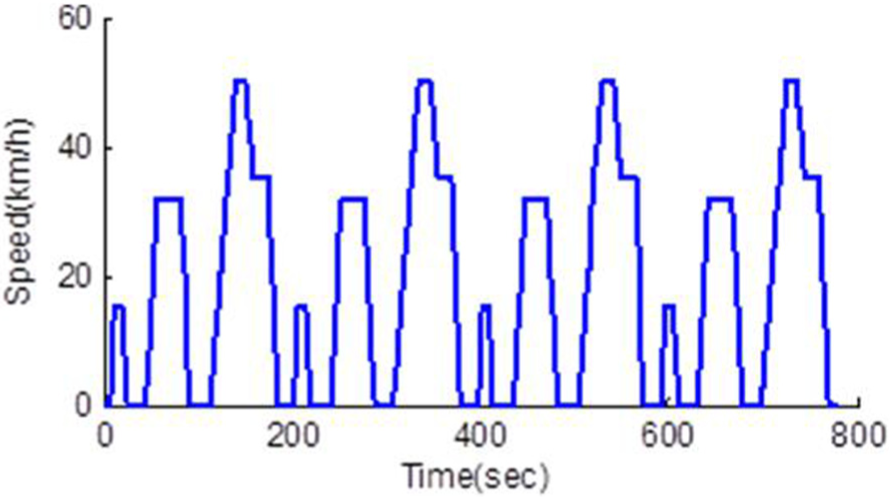
Urban road cycle of ECE.
Figure 15 shows the driving torque for vehicle running in ECE urban road driving cycle. As shown in Figure 15, in medium- and low-speed city driving conditions, because of comparatively minor air resistance, the driving torque for vehicle running is mainly affected by accelerated conditions.

Demand driving torque.
Figure 16 represents variation curves of driving torque in ECE urban road driving cycle, individually using three distribution ways like rear axle drive, four-wheel torque distribution in average, and the optimal torque energy-saving allocation. From Figure 16, when the torque demand is larger than the threshold that could be obtained from the efficiency map of the in-wheel motor, the results of optimal torque energy-saving allocation tend to four-wheel torque distribution in average. The large driving torque of a single motor will be avoided, which leads to low driving efficiency in way of real axle drive. When the torque demand is smaller than the threshold, the results of optimal torque energy-saving allocation tend to rear axle drive. The small demand torque is only allocated to two motors in the rear axle, which avoids the condition that the driving torque of a single motor is too small so that driving efficiency is low in way of four-wheel torque distribution in average. In summary, the algorithm of optimal torque energy-saving allocation can maintain the working point of the driving motor in the high-efficiency area.

Driving torque under three allocation methods.
Figure 17 shows the comparison of the whole vehicle demanded power with the three ways of torque distribution. In Figure 10, optimal allocation energy-saving algorithm has the lowest demanded power. In addition, demanded power of the way of rear axle drive is greater than two other distribution methods obviously during accelerating condition. The main reason is that frequent acceleration conditions in ECE urban road driving cycle often lead the driving torque of rear axle motor to maintain in a larger state; thus, motor driving efficiency is low and energy consumption increases. As shown in Table 3, vehicle energy consumption of these allocation methods is given for ECE urban road driving cycle. It is clear to see that the energy consumption of optimal torque energy-saving allocation has dropped by 0.117 and 0.426 kJ per meter compared with four-wheel torque distribution in average and rear axle drive.

Demanded power under three allocation methods.
Comparative analysis of three allocation methods for energy consumption.

Conclusion
In this article, we proposed the optimal torque energy-saving allocation method for improving the EV operational energy efficiency. A novel control scheme of the front and rear axle torque distribution was investigated. We have analyzed the potential energy efficiency for improving the probability of the EV. The algorithm of optimal torque energy-saving allocation can maintain the working point of the driving motor in the high-efficiency area. Simulation results showed that the energy consumption of optimal torque energy-saving allocation has dropped by 0.117 and 0.426 kJ per meter compared with four-wheel torque distribution in average and rear axle drive.
Footnotes
Handling Editor: Haiping Du
Declaration of conflicting interests
The author(s) declared no potential conflicts of interest with respect to the research, authorship, and/or publication of this article.
Funding
The author(s) disclosed receipt of the following financial support for the research, authorship, and/or publication of this article: This work is supported by the National Natural Science Foundation of China (no. U1664258, no. U1564201), “Six Major Talent Project” of Jiangsu Province (no. 2014-JXQC-004), “333 Project” of Jiangsu Province (no. BRA2016445), and the Primary Research & Development Plan of Jiangsu Province (grant no. BE2017129).