
Abstract
Vibration analysis is an effective way to accurately diagnose bearing faults, because it carries abundant information regarding mechanical health conditions. However, noise interference makes the features, extracted from vibration signals at different time periods, show randomness fluctuation that will reduce the bearing diagnostic accuracy. To solve this problem, this article proposes a noise reduction method in feature level and tries to use it in bearing fault diagnosis with principal component analysis and radial basis function neural network. First, original feature space, including time, frequency, and energy features, is constructed from these obtained vibration signals. Second, compendious feature sets of the considered bearing faults are created by principal component analysis and random statistical average algorithm. In this step, random statistical average is designed to weaken the influence of noise to features and principal component analysis is used to reduce the dimension of features for compendious feature sets. Then, radial basis function neural network, an artificial intelligence tool, is introduced to diagnose bearing faults by compendious feature sets. Finally, experiments on test bench are carried out to verify the reliability and validity of the proposed method. The experimental results show that the proposed method can accurately identify bearing faults.
Keywords
Introduction
Rolling element bearings are commonly employed in rotary machinery, such as motor, mine hoist, and turbine. If a bearing undergoes failure, it will lead to performance deterioration of the overall machine and cause fatal machine breakdowns or disastrous accidents. 1 Based on the statistical analysis of the literature, 2 more than 50% of machinery faults are related to various bearing defects. Therefore, it is very important to design an effective fault diagnosis method for rolling element bearings to reduce unscheduled downtime and economical loss of rotating machinery.
For data-driven fault diagnosis, the first thing is to select appropriate sensors to collect signals for fault diagnosis. Up to now, many signals can be obtained, such as temperature, voice, stress, and strain signals. Even though all these signals can be used for bearing fault diagnosis, vibration signal is the most commonly used because it carries abundant information regarding mechanical health conditions.3–5 After obtaining the vibration signals, the key process is to extract effective features with appropriate signal processing techniques. In the past, many techniques have been introduced to perform signal analysis in the time, frequency, and time–frequency domains. 6 For time-domain signal analysis, statistical indicators of time series, such as crest factor, kurtosis, and root mean square, are calculated to monitor the bearing fault diagnosis.7–9 In this method, if the value of a monitoring statistical indicator exceeds the preset threshold, then the bearing is diagnosed as being under faulty condition. However, it is very difficult to obtain an effective threshold from the time-varying working conditions. For frequency-domain signal analysis, the time-domain signals are transformed into frequency-domain signals by Fourier transform–based signal processing methods,10–13 and then the characteristic frequencies are monitored to detect bearing faults. Theoretically, bearing faults can be diagnosed by analyzing statistical indicators and characteristic frequencies of the collected vibration signals. However, vibration signals usually carry noise and other vibration components, that is, traditional pure time-domain analysis and frequency-domain analysis will be helpless in extracting the overwhelmed remarkable information for fault diagnosis. 14 At the same time, vibration signals are usually non-stationary with noise interference. In order to have a more detailed analysis, time-frequency analysis methods are introduced, such as short-time Fourier transform (STFT),15,16 Wigner–Ville distribution (WVD),17,18 and wavelet transform (WT)–based methods.19,20 The WT is a commonly used signal processing method in bearing fault diagnosis because it has flexible multi-resolution solutions and includes continuous WT, 21 discrete WT, 22 and wavelet packet analysis (WPT). 23 Comparing these time-frequency signal analysis methods, WPT is more suitable to process the non-stationary and non-linear vibration signals because it has better frequency resolution in the whole time-frequency plane than that of the others.
Even vibration signal analysis is a very effective way for bearing fault diagnosis, the environmental noise interference will make the features extracted from these collected vibration signals at different time periods show randomness fluctuation to some degree and this will increase the complexity of fault diagnosis method and lower the efficiency of bearing fault diagnosis. To solve this problem, a new bearing fault diagnosis method using principal component analysis (PCA), random statistical average (RSA) algorithm, and radial basis function (RBF) neural network is proposed for bearing fault diagnosis. First, original feature space, including time, frequency, and energy features, is extracted from these obtained vibration signals. Second, compendious feature sets of the considered bearing faults are constructed by PCA and RSA algorithm. RSA is designed to reduce the influence of noise on features and PCA is used to reduce the dimension of features for compendious feature sets. Then, RBF neural network, an artificial intelligence tool, is introduced to diagnose bearing faults by compendious feature sets. Finally, experiments on test bench are carried out to verify the reliability and validity of the proposed method in this article.
The rest of this article is structured as follows. Section “Feature extraction” introduces a feature extraction method, which includes RSA algorithm and PCA-based compendious feature extraction. The procedure of the method proposed in this article and experimental research are described in sections “Procedure of the proposed method” and “Experimental research,” respectively. The conclusion of this article is made in section “Conclusion.”
Feature extraction
RSA algorithm
The vibration signals of rolling element bearing, affected by environmental noise interference, are non-linear and non-stationary. That is to say, the features extracted at different time periods show randomness fluctuation to some degree even if the bearing is under the same health condition. Figure 1(a) shows a set of original energy features extracted from these random vibration signals by WPT. As shown in this figure, these original features obtained at different time periods are not the same, that is, they fluctuate within a certain range. The fluctuation of the original features, coursed by noise interference, will increase the complexity of the fault diagnosis method and lower the efficiency of bearing fault diagnosis. We assume that noise fluctuates within a certain range, so the features can be regarded as a data set distributing in some range.

Comparative results of (a) original features and (b) statistical average features.
The law of large numbers shows that the real mean of a random event can be used instead the average value of vast experiments. 24 That is to say, the arithmetic average values of original features are more close to the real mean of these original features, so the fluctuation in Figure 1(a) is caused because the feature values are close to the real expectation to varying degrees. Furthermore, the central limit theorem also shows that, for a large number of repeated measurements of a physical quantity, their arithmetic average values are more close to a standard normal distribution. 25 Based on the above analysis, using statistical average features to perform fault diagnosis may be more effective because their fluctuation range is less than that of the original features.
Figure 1(b) shows 100 statistical average features calculated from the original features like those shown in Figure 1(a). Similar to original features, these statistical average features shown in Figure 1(b) also range nearby a certain value. Comparing the values in Figure 1(a) and (b), we can obtain a conclusion that the wave range of the original features is bigger than that of the statistical average features. As each statistical average feature is the arithmetic mean of a set number of original features, it will be more close to the real expectation of features than that of most original features. In order to extract enough features of each bearing working condition, the RSA algorithm, including random data segment construction and statistical average feature extraction, is proposed for bearing fault diagnosis.
Data length selection
In the past, for the feature-based fault diagnosis methods, many segments or subspace sequences are divided from these original vibration signals to extract features. However, how to select the length
Ball pass inner raceway frequency (FBPI),
Ball pass outer raceway frequency (FBPO),
Ball rotational frequency (FB).
When the shaft rotational frequency and bearing structural parameters are available, the above frequencies can be calculated by the formulas shown in the literature.26,27 In order to make the issue more clear, five simulation impulse signals are shown in Figure 2. In this figure,

Five simulation impulse signals.
Based on the above analysis, the length
Random data segment construction
After selecting the length
Calculate the length
Generate a random number
Based on these selected parameters

Repeatedly execute steps (1)–(3)
Statistical average feature extraction
Feature extraction is a very crucial step for bearing fault diagnosis because the used vibration signals are non-stationary and non-linear and it is difficult to realize accurate bearing fault diagnosis. The method proposed in this article extracts traditional features, including time, frequency, and time–frequency features, for bearing fault diagnosis. Time features, based on statistical analysis, mainly reveal the characteristics of vibration signals in the time domain. Similarly, frequency features can express the characteristics of vibration signals in the frequency domain. Different from the time and frequency features, the time–frequency features can show the characteristics of vibrations in both the time and frequency domains. All of the above feature parameters have been widely used in fault diagnosis field. In order to take advantage of these traditional feature parameters, the time, frequency, and time–frequency features are used to diagnose bearing faults, such as maximum value, absolute mean, mean, root mean square, impulse factor, and energy values of wavelet packet nodes, and these used features can be found in the literature.8,9 Therefore, the feature parameters of each random data segment are more than one and they can constitute a vector which is defined as

where
Assume that there are

So the statistical average feature can be calculated by

where
PCA-based compendious feature extraction
PCA is a kind of multivariate statistical analysis technique, and it can obtain a smaller number of principal components based on the limited matrix generated from time sequence. These generated principal components are essentially comprehensive variables of original multidimensional data, which can reflect the main information of the original variables. PCA has been used widely in many fields as it can translate the high-dimensional data into lower dimensional data and remove redundancy between multidimensional variables. Therefore, we can just take an appropriate number of principal components to reduce the dimension of original features and keep enough useful information for bearing fault diagnosis. The main steps of PCA are shown below.
Assume that there is a data matrix

where
Calculate the covariance matrix

Compute the eigenvalues of the matrix
Then the matrix

where

where
Combining RSA algorithm and PCA, the compendious feature extraction method is proposed in this article. First, the vibration signals are processed by WPT technique and RSA algorithm, and the traditional time, frequency, and energy feature values of wavelet packet nodes are extracted. Then, PCA is used to analyze the obtained original features, and the number of singular values to reveal these principal components in the original features is selected by setting the threshold value in formula (8) as 95%. Finally, the selected singular values are used to construct compendious features.
Procedure of the proposed method
By feature extraction, we can obtain the information reflecting bearing fault, but we cannot directly use them to monitor bearing faults with threshold analysis because the appropriate threshold of vibration signals with noise disturbance is hard to select. At the same time, there are many feature parameters which all include fault-related information to varying degrees and views, so it is difficult to perform bearing fault diagnosis by pure manual work. Therefore, artificial intelligence technology has been introduced for fault diagnosis. However, if we use all the traditional time, frequency, and time–frequency features to diagnose bearing fault, the final constructed model will be more complex. Considering feature dimension reduction, noise elimination, and intelligent diagnosis, a new fault diagnosis method based on PCA, RSA algorithm, and RBF neural network is proposed for bearing fault diagnosis, and its procedure is shown as follows:
The acceleration sensor is installed on the top of the bearing house of the simulator, and then the vibration signals of bearings under considered working conditions are collected.
The obtained vibration signals are processed with WPT, fast Fourier transform (FFT), and statistical analysis based on data length selection and random data segment construction regulations described in subsections “Data length selection” and “Random data segment construction,” and then the time, frequency, and time–frequency features were extracted; a total of 40 feature parameters are considered in this article.
Random statistical features are extracted using the statistical average feature extraction method described in subsection “Statistical average feature extraction.”
PCA with the threshold of 0.95 is used to reduce the dimension of the obtained original features, and the processed results are introduced to train and test the RBF neural network.
Experimental research
Experimental setting
In order to verify the effectiveness of the proposed method based on PCA, RBF neural network, and RSA feature extraction method, an experiment was performed on a multifunctional mechanical fault simulator which was manufactured by SpectraQuest, Inc. and is shown in Figure 3. This simulator is a powerful tool for researching the signatures of typical machinery faults without compromising factory production or profits, and it mainly contains an AC motor (3-phase, 1 hp, and 0–6000 rpm variable speed), a variable speed motor controller, a tachometer, a flexible coupling, a shaft, a well-balanced rotor disk with tapped holes in the edge, two rolling element bearings (one normal and another for testing), and so on. The weight of this simulator is only about 150 pounds, so it can fit on a desktop. With modular design, this simulator can provide versatility, operational simplicity, and robustness. As each component is machined to high tolerances and eight rubber isolators are set to reduce the influence of additional vibrations of parts not belonging to this simulator, it can be operated without any significant conflicting vibration. The above-mentioned mechanical parts of this simulator all have several accessories with normal and various faults, respectively. Therefore, this simulator can undertake the role that simulate the typical malfunctions of rotating machinery, such as bearing faults, rotor faults, shaft faults, and coupling faults. Based on the literature, 28 bearing faults are an important factor affecting the normal operation of an equipment, so the proposed method is mainly focused on bearing fault diagnosis. Therefore, except the test bearings, the remaining parts of this bench are all in normal status.

Fault simulator: 1—motor, 2—sensor, 3—shaft, 4—rotor disk, 5—test bearing, 6—outboard bearing housing, 7—normal bearing, 8—inboard bearing housing, 9—coupling, 10—controller.
In consideration of the typical faults of bearing, four health conditions are simulated on this simulator which are normal (S1), inner race fault (S2), ball fault (S3), and outer race fault (S4). These bearing faults were made in an artificial way, which are shown in Figure 4. The diameter and depth of the faults are 2 and 0.5 mm, respectively. Vibration is the necessary result of a bearing failure; however, the more transmission parts the vibration signals of the above bearing faults pass to the sensor, the more serious the attenuation of vibration signals will be. To keep the attenuation of the obtained vibration signals as little as possible, ICP acceleration sensors (AC 240-1D), designed by the Connection Technology Center, Inc. of America, are directly placed on the top of the bearing housing. The used data acquisition equipment is produced by Donghua Testing Technology Co., Ltd, and it has 16 channel data recorders. When these recorders are all working, the max sampling frequency of each is 256 kHz. However, in our experiment, the rotational speed of the bearing was 1800 rpm. In consideration of acquisition costs and Shannon’s theorem, the sampling frequency and sampling time of each bearing working condition are set at 2 kHz and 22 s, respectively.
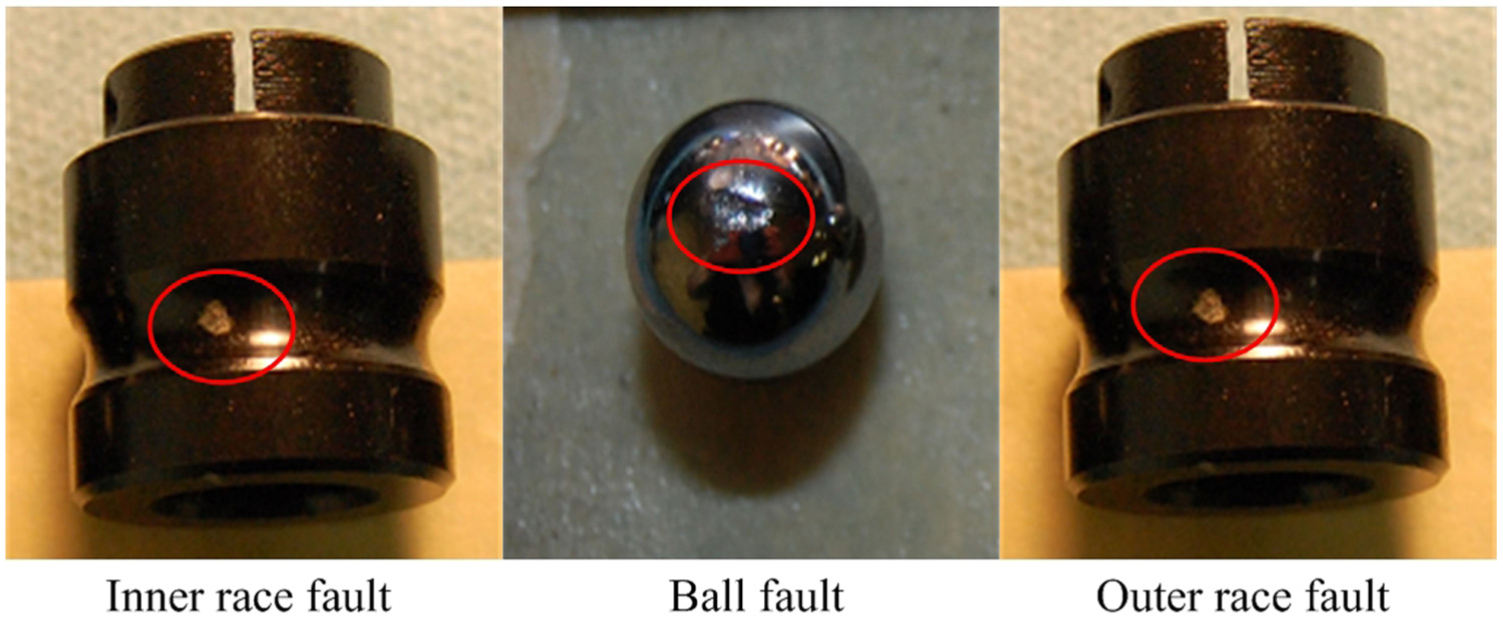
Bearings with different faulty conditions.
Figure 5 shows the waves of the vibration signals collected from the above simulator in the time and frequency domains. A comparative analysis of these waves plotted in Figure 5 reveals that, for the time-domain signals, there are not obvious differences between these vibration signals under various bearing working conditions, except that of ball fault; for the frequency-domain signals also, the differences are not so obvious but they still have some small ones.

Waves of vibration signals in the time and frequency domains.
Experimental result analysis
In the experiments described in this article, 1000 time series with 2000 sampling data points of each bearing working condition are constructed from the collected vibration signals by random data segment construction algorithm, and then 1000 original samples constituted by time, frequency, and time–frequency features are extracted for statistical average feature samples. Based on formula (3),
Condition 1. A total of 100 original feature samples, each including 40 feature parameters, are used to train and test the RBF neural network–based bearing fault diagnosis model.
Condition 2. PCA is used to process the 100 original feature samples with the threshold value
Condition 3. A total of 100 statistical average feature samples are extracted from the original feature samples to train and test the RBF neural network–based bearing fault diagnosis model.
Condition 4. PCA is used to process the 100 statistical average feature samples mentioned in condition 3 and the results are employed to train and test the RBF neural network–based bearing fault diagnosis model.
When constructing the RBF neural network model, the target outputs are coded with “0” and “1,” i.e., “1000”, “0100”, “0010” and “0001” represent the target outputs of bearing working conditions S1, S2, S3 and S4, respectively.
Figure 6 shows the results of four experimental conditions, in which abscissa represents the test sample serial number; ordinate is the amplitude of RBF neural network outputs; the samples with the serial numbers 1–30, 31–60, 61–90, and 91–120 are under the bearing working conditions S1, S2, S3, and S4, respectively; “out1,”“out2,”“out3,” and “out4” are four output values of the RBF neural network model, which form the final digital coding to show the bearing faulty type. Figure 6(a)–(d) shows the test results of conditions 1–4 considered above, respectively. From Figure 6(a), the output values of “out2” of these test samples with the serial numbers 31–60 should all be “1” and the other output values should be “0” or very close to “0” in theory; however, the output values of the test sample with the serious number 34 are −1.8677, −0.2008, 1.0856, and 1.9829, respectively. That is to say, the result of this test sample is not suitable for the real bearing working condition and incorrect diagnosis phenomenon also occurs in these test samples with the serial numbers 55 and 61–90. By the same way, some test samples in Figure 6(b) are also wrongly diagnosed, but its number is less than that of Figure 6(a). Based on the test results in Figure 6(a) and (b), we obtain a conclusion that the original feature sample–based RBF neural network for bearing fault diagnosis cannot obtain a satisfactory effect. By observing the test results in Figure 6(c), it can be seen that the outputs with labels “out1” to “out4” of these test samples with numbers 1–30, 31–60, 61–90, and 91–120 are very close to “1000,”“0100,”“0010,” and “0001,” respectively. When comparing these test results and the defined goal outputs of the RBF neural network model, the bearing working conditions of the test samples with the serial numbers 1–30, 31–60, 61–90, and 91–120 are diagnosed as S1, S2, S3, and S4, respectively, which is in conformity with the actual bearing working conditions. Continuing to analyze Figure 6(d), it can be seen that the outputs of the RBF neural network are more close to “1000,”“0100,”“0010,” and “0001” than those in Figure 6(c), and this means that the diagnosis effect of Figure 6(d) is more perfect than that of Figure 6(c). From Figure 6, we can obtain a conclusion that the proposed method based on PCA, RSA algorithm, and RBF neural network can provide more effective diagnosis results than those of only RBF, PCA, and RBF, or RSA algorithm and RBF.

Test results: (a)–(d) the outputs of RBF neural network under four considered experiments, namely, conditions 1–4.
In practical application, the running time of the fault diagnosis method is also an important indicator of performance evaluation. The methods corresponding to Figure 6(c) and (d) have greater application value than the other two methods in Figure 6(a) and Figure 6(b). Therefore, just the running times of the RBF neural network model in Figure 6(c) and (d) are compared. The training time and test time of the RBF neural network model in Figure 6(c) is 6.5738 and 0.0163 s, and the corresponding times in Figure 6(d) are just 5.0955 and 0.0125 s. It means that the proposed method also has advantage in elapsed time. Therefore, in consideration of the training time, test time, and test accuracy, the proposed method is an effective fault diagnosis method.
Conclusion
Considering the complexity and noise interference of the obtained vibration signals, a vibration signal–based method using PCA, RSA algorithm, and RBF neural network has been proposed to identify and monitor the appearing bearing faults. This article was designed to use the collected vibration signals for bearing fault diagnosis. Usually, the collected vibration signals included noise to some degree as the operating environment of the rolling element bearing is complex. On the other hand, the data length of the vibration signals under a bearing fault is less than that under normal condition. Therefore, the RSA algorithm was proposed to extract enough feature samples which were not so sensitive to noise. Moreover, many feature parameters can be extracted from the vibration signals. Therefore, PCA was introduced to reduce the dimension of features to improve the computing speed when performing bearing fault diagnosis. Comparisons were carried out to verify the reliability and validity of the proposed method, and the experimental results showed that the proposed method can accurately identify the considered bearing faults.
In fact, the mentioned noise interference of the obtained vibration signals can be regarded as noise signals, small range of rotational speed, or load fluctuation of bearings, because a mutation feature will be weakened by calculating its mean value and a large number of relatively stable features. That is to say, as long as the rotational speed or load fluctuation is within a small range, the proposed method can also deal with it. However, in practice, what is the range of limiting changes in rotational speed or load that the method can handle should be revealed or a fault diagnosis method can be presented to deal with the condition of high rotational speed or load fluctuation. These issues will be studied in our further research work.
Footnotes
Handling editor: Alexandar Djordjevich
Declaration of conflicting interests
The author(s) declared no potential conflicts of interest with respect to the research, authorship, and/or publication of this article.
Funding
The author(s) disclosed receipt of the following financial support for the research, authorship, and/or publication of this article: This work was supported by the Fundamental Research Funds for the Central Universities (2017QNA17).