
Abstract
This article is devoted to the structural design of the breechblock mechanism. The impact force between the driven cam and the cartridge is an important factor that affects the gun cartridge extraction speed and breech strength. The impact force is deduced with the theoretical solution, numerical solution, and test method in this article, and the analysis results are verified through experiments. Then, dynamic analysis is carried out for the breechblock based on the obtained results. The stress distribution is obtained using the Automatic Dynamic Analysis of Mechanical Systems software and experiments. The maximum stress of the impact parts exceeds the fatigue limit stress of the material, so the structure optimization should be performed. In this article, the stopper optimization is discussed in detail. To improve the energy absorption characteristics of the stopper, an optimization method is presented. The topology optimization, slot clearance optimization, and shape optimization of the stopper are performed. Moreover, the stopper structure size, strength, stiffness, and the specific energy absorption before and after optimization are compared. The results of the experimental, analytical, and numerical investigations are compared in tables and figures.
Introduction
The breechblock mechanism in naval artillery is used to lock the chamber, fire the primer, and extract the cartridge case. The breechblock mechanism mainly consists of the breechblock, breech, driven cam, driving cam, and limiting position stopper. 1 When the breech crashes into the limiting position stopper at a speed of 3 m/s, the cartridge case will be rapidly pulled out (approximately 6–10 ms),2,3 and the limiting position stopper will absorb part of the energy generated in the impact through elastic–plastic deformation. 4 However, it has been found that the impacts between some parts influence the accuracy of the motion because of their elastic and plastic deformations. 5 One way to decrease the impact is to improve the energy absorption of the major components. Therefore, it is essential to research the dynamic analysis and optimization design of the key parts of the breechblock mechanism.
International scholars have performed extensive research and exploration on gun dynamics since the 1970s. Based on the research database, Newill et al. 6 simulated the performance and strength of the gun virtual prototype, and the optimum results were obtained through experiments. To investigate the factors affecting the firing accuracy, Boresi 7 simulated the firing process of artillery under different working conditions using a spring mass system. Hoyle 8 explored the influence of the structure characteristics of the gun breech on the dynamic response using a specially designed experimental device. Much research has been performed in China on the breechblock mechanism. For example, Tan et al. 9 and Luo et al. 10 have obtained the curve of the impact force versus time through dynamic simulations. However, the results have not been verified through theoretical calculation or experiment. Scholars have considered the optimization design and energy absorption. Yuan et al. 11 optimized the rail gun’s key structure parameters based on the orthogonal test method. Han 12 innovatively designed an artillery gun carriage based on the optimization design. Gao and Xu 13 investigated the effects of the aluminum shell thickness and density of the aluminum foam on the energy absorption properties of the filling structure. Lai 14 studied the influence of thickness, shape, material, induction method, and welding method of the fold-collapse tube on the energy absorption structure for a car body. However, the stopper is optimized to reduce the weight for bearing a structure with a slot. Determining the slot clearance using shape optimization supplemented with size optimization based on the OptiStruct 15 software has rarely been mentioned in the literature.
In this article, the impact force is deduced by the theoretical solution, numerical solution, and test method, and the analysis results are verified through experiments. Then, the dynamics analysis is carried out for the breechblock based on the results obtained above. The stress distribution is obtained using ADAMS 16 software and an experiment. The stopper optimization is discussed in detail here. To improve the energy absorption characteristics of the stopper, a new design process is presented.
Operational principle of the naval gun breechblock
Figure 1 shows the structure of the breechblock. In the structure, part 5 is fixed, while parts 1, 2, 3, and 4 move to-and-fro together with the gun body. Part 3 and part 4 can rotate around their axes. When parts 1, 2, 3, and 4 move to part 5, part 4 remains in contact with part 5 and rotates anticlockwise. Part 3, the end of which contacts with part 2, is pushed by part 4 to rapidly rotate clockwise. Part 2 is pulled out by part 3 from part 1. The velocity of parts 1, 2, 3, and 4 can reach 3 m/s, approximately 6–10 ms, which is bound to impact.
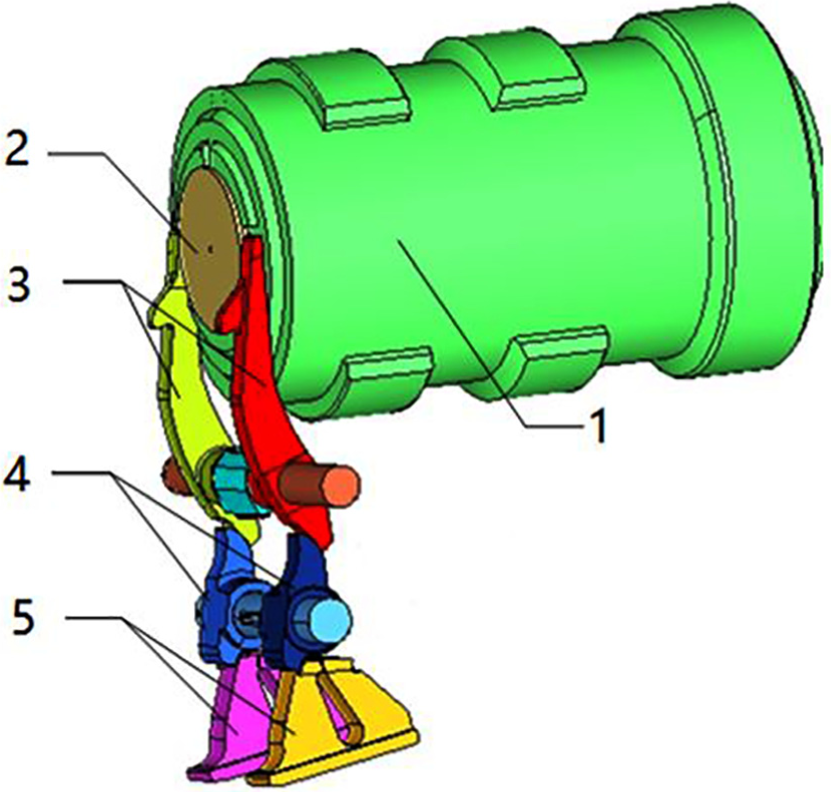
Structure of the breechblock.
Analysis on the impact force of the driven cam
Experiment of the impact force
The purpose of the experiment is to test that the cartridge case is pulled out reliably by the driven cam when gunpowder ignites in the bore. The instantaneous pressure can reach 429.4 MPa when the gunpowder explodes. The impact force between the tip of the driven cam and the lug of the cartridge influences the extraction process.
The impact force refers to the resistance of a cartridge case when it is drawn out. In the extraction process, the impact force is changed from the initial static friction force to the dynamic friction force, and then the cartridge case is drawn out. To measure the impact force more precisely, similar working conditions to the gun are simulated. The experimental principle is shown in Figure 2. Based on the experimental prototype for the launch test, the driven cam was demolished so that this gun would not generate extraction action after operation. Then, an extraction device was installed in the experimental prototype with a pressure gauge. The end of the device was fixed with the cartridge case, and the other end was installed on the screw nut. The screw nut was connected with the base and was fixed. During the test, the gunpowder exploded in the bore, and the warhead was discharged at high speed. Then, the handle was turned and the cartridge was drawn out at a fixed speed through screw transmission to simulate the process of cartridge extraction. In the process, the friction force can be measured between the cartridge and the tube through the pressure gauge, namely, by the impact force. The curve of the impact force can be obtained, as shown in Figure 3.

The experimental schematic to test the import force.

Curve of the impact force in the experiment.
As can be observed in Figure 3, the impact force increases rapidly after the cartridge case is drawn out and reaches a maximum at approximately 1.8 ms at approximately 20.83 kN. After reaching the peak, the impact force decreases rapidly to zero and then stabilizes.
Theoretical analysis of the impact force
Stage I: P (pressure in the bore) from 0 to the pressure touching the bore wall
In the beginning, the cartridge has only elastic deformation because of the small pressure in the bore. The radial pressure

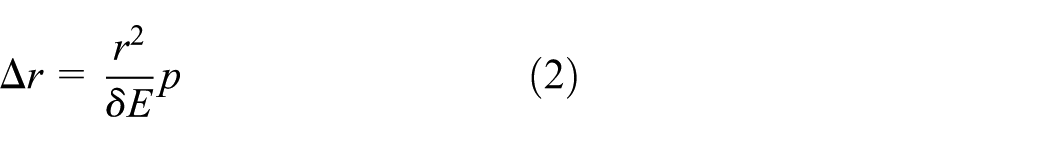
where
When the initial clearance between the cartridge and barrel is greater than the elastic limit displacement, plastic deformation will appear in the cartridge. The instantaneous tangential stress


where
Stage II: P from the pressure touching the barrel to its maximum value
After the cartridge touches the barrel, they are under the pressure

where
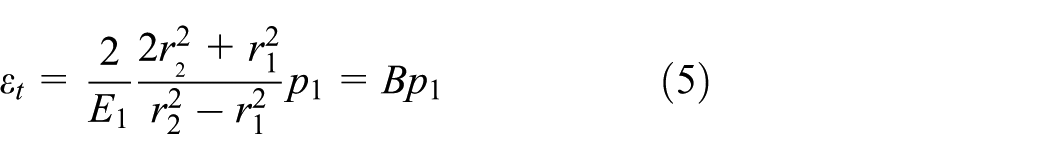
The strain and radial displacement of the cartridge are

where
Therefore, the maximum pressure between the cartridge and the barrel is

The maximum radial displacement of the barrel inner surface is

Based on the principle of deflection consistency, the maximum radial displacement of the cartridge is

Stage III: P from the maximum value reducing gradually to 0
With the decline of the pressure in the bore, the cartridge rebounds to its initial position at first, but the barrel will still rebound, leading to the cartridge being compressed. The interference fit will occur between the cartridge and the barrel. At this time, the radial pressure

where
The results are listed separately according to the four time points, as shown in Table 1.
The calculation results for the breechblock.

Calculate the impact force
The formula to calculate the shell pulling force can be approximated as 18

where
The maximum value of the impact force was calculated to be 20.354 kN.
Finite element analysis model of the breechblock
First, all parts of the breechblock were built in a three-dimensional model, including assembling the positional relation of the breechblock system at the driving cam and the stopper collision moment. The base was primarily used to fix the stopper. To simplify the calculation, the base was left out, and the stopper was fixed with ENCASTRE in CAE. The half of the model was used to perform the analysis and calculation because the structure and payload of breechblock were symmetric. Figure 4 shows the finite element analysis (FEA) model, which contains 45,793 elements and 57,055 nodes. The minimum element size was 2.5 mm.
FEA model of the breechblock.
Then, the simulation model was imported into ADAMS, and a constraint condition was added. The stopper was fixed to the ground so that it would not move during the simulation. The model revolved between the two cams and the shaft, and a fixing pair was formed between the two cam shafts and the gun body. The cartridge case and the gun body were connected with the breech and the ground, respectively, through the translation joint, so they could move directly. The two cams connected with cam joint; the connection mode was assumed to be CURVE TO CURVE.
There were several contacts in this model, such as between the driven cam and the cartridge case, between the driving cam and the driven cam, between the driving cam and the stopper, and so on. In this article, universal contacts were employed in the model, penalty function friction algorithms were selected, and the contacts were defined as hard contacts between the contact surfaces. In addition, a tie constraint was set between the driven cam and its shaft to restrict the relative movement between the two contact surfaces, as well as between the driving cam and its shaft.
With the velocity test of a medium caliber naval gun, the to-and-fro velocities can be obtained. Table 2 shows the velocity of the gun body moving to the stopper again. The preset initial speed of shell system is 3.000 m/s.
Testing velocity data of the firing mechanism.
Numerical analysis of the impact force
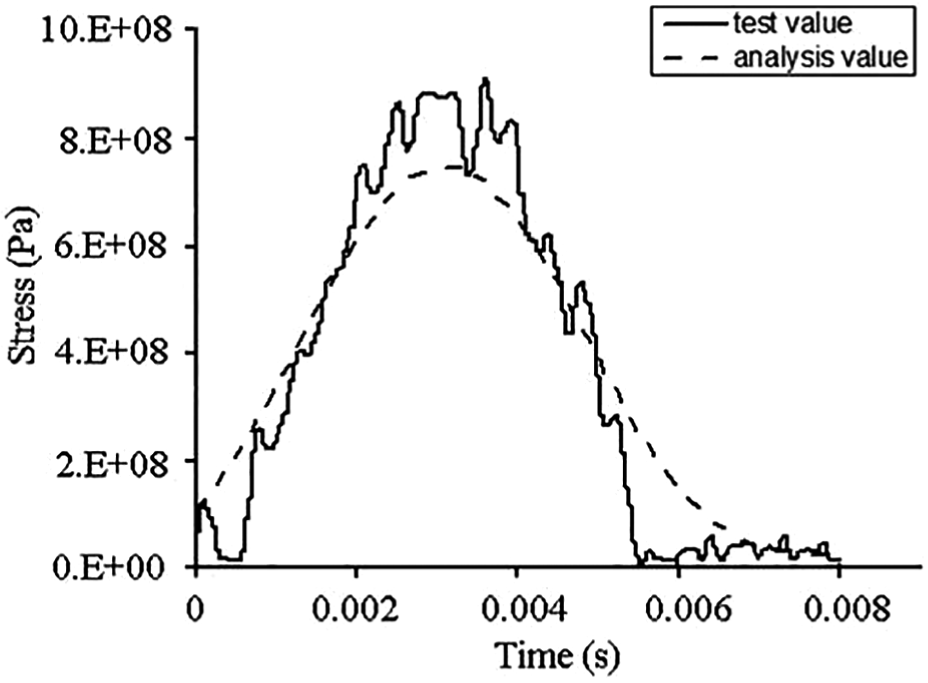
Because the gunpowder explosion cannot be simulated in ADAMS, this article uses a spline fitting function to calculate the four resistance points of the pumping shell. Then, a force is loaded to the model through the AKISPL function, and the approximate curve of the impact force is obtained, as shown in Figure 5.
Curve of the impact force in numerical analysis.
The simulation results show that the impact force increases rapidly after 0.014 s and fell to approximately 2.75 kN after 0.016 s, with the maximum value reaching 22.346 kN. The experimental maximum value of the impact force is 20.83 kN, the analytical value is 20.354 kN, and the error is only 2.34%. The numerical results are higher than the experimental results of 7.28%.
Dynamic analysis of the breechblock
Stress analysis of the breechblock
By loading the cartridge speed and presetting the initial velocity of the system components, the stress distribution of the components can be obtained at each moment in the extraction process. In the results of the extraction process simulation, the stresses at the three contact points are relatively large, as shown in Figure 6. In the collision process, the driving cam contacts the stopper at first; then the driving cam contacts the driven cam and the tip of driven cam contacts the cartridge; the three contacts are instantaneous. Figure 6(a) shows the collision of the driving cam and the stopper with a stress at the contact point of 704 MPa. After contacting the stopper, the driving cam revolves around the driving cam shaft and contacts the driven cam, which makes enlarges the stress distribution of the driven cam, as shown in Figure 6(b). Then, the driven cam impacts the cartridge and increases the contact stress, as shown in Figure 6(c).

Stress contour of the breechblock: (a) the collision of the driving cam and the stopper, (b) the collision of the driving cam and the driven cam, and (c) the collision of the driven cam and the cartridge.
The three impact points are where the stress is concentrated during the shell extraction process, which is consistent with the actual process. The maximum stress of the impact points is 1436 MPa, which exceeds the fatigue limit stress of the material of 960 MPa. Therefore, the structure optimization should be performed. The structural optimization of the driving cam and the driven cam will be discussed in another paper, where the structure optimization of the stopper is discussed in detail.
Stress analysis of the stopper
The right arm of the stopper is directly impacted in the extraction process, and the stress contour of the stopper is shown in Figure 7. The results show that the maximum stress is 747.767 MPa, which is on the upper side of the right arm. The maximum displacement is 0.903 mm and less than the clearance between the right arm and the left arm (clearance of 1.5 mm). The energy absorbed by the stopper is 16.12 J. The impact energy absorption caused by the collision cannot be improved, which will vibrate the breech. If this occurs, then the next shell cannot be put into the gun barrel, which will influence the smooth operation of the entire system. Therefore, it is necessary to research these phenomena to avoid such situations.

Stress contour of the stopper.
Stress experiment of the stopper
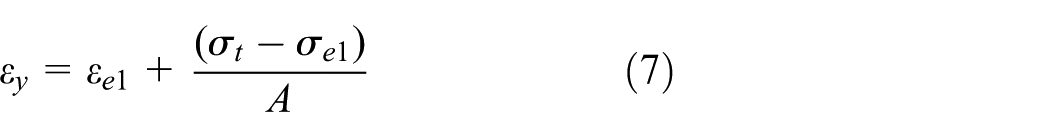
To verify the validity of the dynamic analysis, the stress test for the stopper is performed. During the test, a force equal to the impact force is applied to the impacted part of the stopper where a strain rosette was attached. When the component was deformed, the resistance strains were changed accordingly. Using the resistance strain gauge, the change in the resistance value can be obtained and converted to analog electrical signals, which were proportional to the strain. The data can be processed by the computer, and the stress or strain can be obtained, which is demonstrated in the following form

and

where E is Young’s modulus,
Stress test performed on the stopper.
Experimental results from the stress test.
Optimization design of stopper
Topology optimization
The material of the stopper is 35CrMoVA, with an elastic modulus of 210 GPa, a Poisson’s ratio of 0.3, a density of 7.9 g/cm3, a yield limit of 960 MPa, and a pulsating fatigue limit of 540 MPa. Because the transmission ratio between the stopper and the driving cam cannot be changed, the outline size of the stopper remains the same. The solid isotropic material penalization (SIMP) is used to build the topology model. The model for the topology optimization is
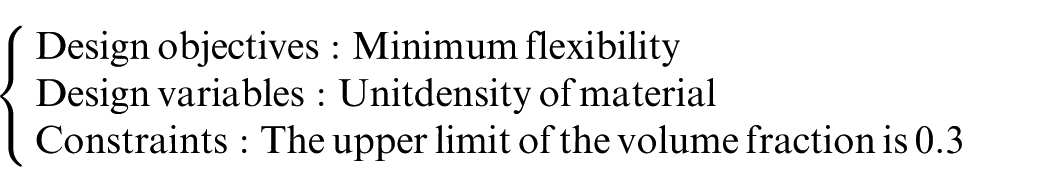
The unit density has consecutive values between 0 and 1. If the unit density is 1 or close to 1, the material at the unit is required. If the unit density is 0 or close to 0, the material at the unit is unimportant and can be removed. The results of the topology optimization are shown in Figure 10.

Results of the topology optimization for the stopper.
As shown in Figure 10, the thickness of material on the right side is greater than the left side because of the loading. For the slotting and shape optimization, the shape of the model is partially adjusted, as shown in Figure 11.

Model of the stopper after rounding.
Optimization of slot clearance
There is a slot on the top of stopper, which provides a cushion to protect against shock. In this article, the slot width is optimized based on the topology optimization.
First, the top of the stopper was cut off from the middle. Then, a forced displacement was applied at the position of the collision to simulate the impact force. The stress–displacement curve of the stopper was obtained, as shown in Figure 12. The stopper was affected by the bending cyclic stress. The pulsating fatigue limit of the stopper material was 540 MPa, but its allowable value was 486 MPa. To satisfy the fatigue strength of the stopper, the slot clearance was equal to the displacement, and the corresponding stress was equal to the allowable value. As shown in Figure 12, the displacement is 0.305 mm. Therefore, the clearance of the slot is 0.3 mm. The finite element model of the stopper with a slot clearance of 0.3 mm is shown in Figure 13. To keep the structure stable and absorb more energy, the shape of the stopper needs further optimization.
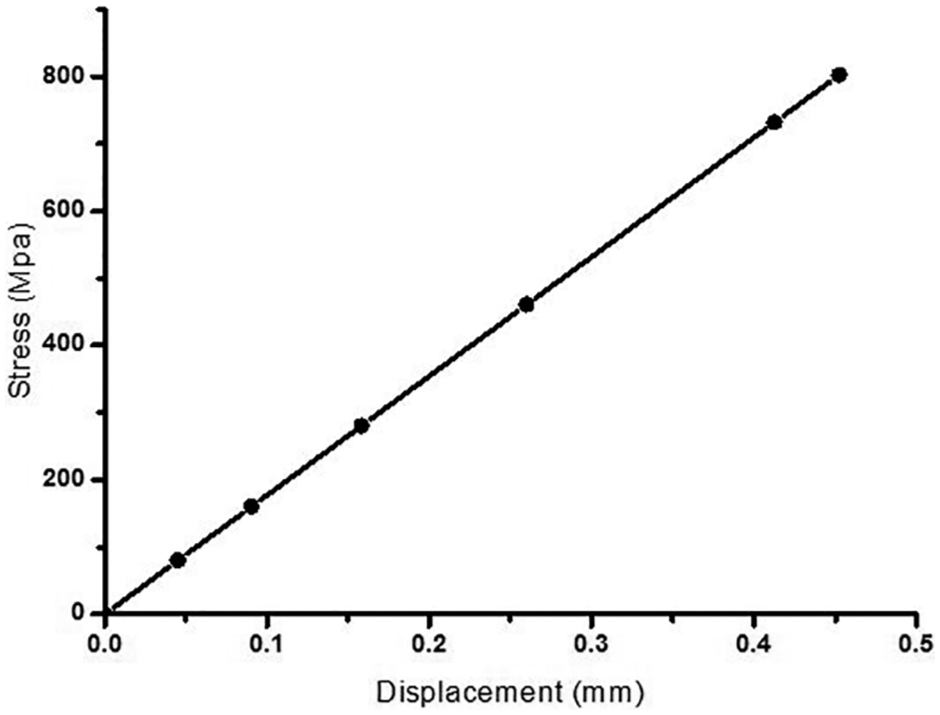
Curve of the stress–displacement for the stopper.

Finite element model of the stopper.
Shape optimization
The shape optimization model of the stopper was built in HyperWorks. 19 Five shape variables were optimized, which include the radius of curvature R, the height of the slot h, the thickness of the stiffened plate given by m, the thickness of stiffened plate given by n, as shown in Figure 14, and the width of the stopper B. The constraint during the shape optimization model of the stopper is that the maximum Von Mises stress is less than the yield strength of 960 MPa. The design goal is to minimize the volume.

Scheme diagram of stopper shape optimization.
Optimization results and analysis
Analysis of the optimization results
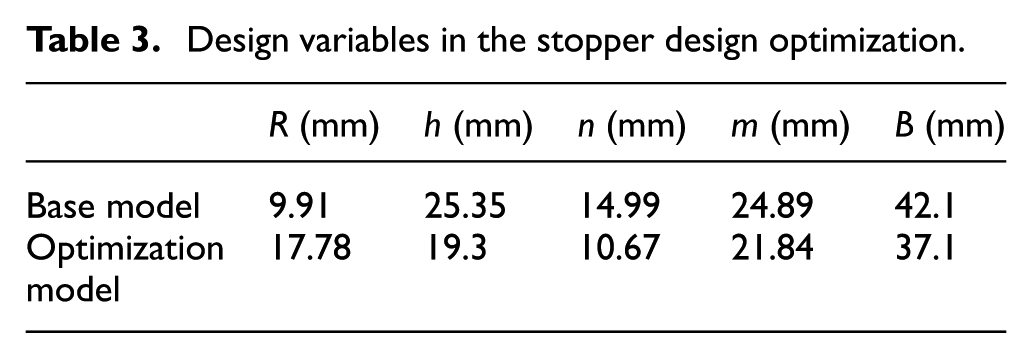
After optimization, the weight of the stopper was reduced from 4.63 to 3.2 kg. The deformation nephogram of the shape variable is shown in Figure 15. Changes to the shape variables are shown in Figure 16. The solid line represents the original model, and the dotted line represents the optimization model. The structure size of the stopper after optimization is shown in Table 3.

The deformation nephogram of the shape variables.

Shape of the stopper: (a) curvature radius R,(b) height of slot h, (c) thickness of the stiffened plate n, and(d) thickness of the stiffened plate m.
Design variables in the stopper design optimization.
To study the mechanical properties of the stopper after optimization, the dynamic analysis of the optimized model was performed. The stress contour of the stopper is shown in Figure 17. The maximum stress of stopper is 818.28 MPa, which is 9.4% more than that of the original model, but lower than the yield strength of the material. The maximum displacement is 0.802 mm, which is 11.18% less than that of the original model.

Stress contour of the stopper after the shape optimization.
Analysis of the characteristic of energy absorption
In the study of the impact performance of the stopper, the common evaluation indexes are the total energy absorbed, the specific energy absorption (SEA), and others. The total energy absorption is the collision energy absorbed by the stopper during the entire collision

where p is the collision force, s is the deformation, and δmax is the maximum deformation displacement. The energy absorption of the unit mass of the element is called the SEA. In the design of a lightweight stopper, the SEA can be large enough for the component. The formula is expressed as

where E is the total energy absorption and m is the mass of the component.
Through the dynamics analysis, the maximum total energy absorption of the original model was 116.84 J, and the maximum total energy absorption of the optimized model was 144.03 J. The mass of the optimized model was 3.2 kg, which is 30.89% less than the original structure. The curves of the SEA before and after the optimization of the stopper are shown in Figure 18. From Figure 18, it is seen that the SEA can be improved by 19.77 J/kg after the optimization. The overall trend is consistent with the original model. Time pulling out the cartridge is approximately 6 ms. Before 3.5 ms, the SEA increases rapidly with time. The deformation of the stopper reaches a maximum value at 3.5 ms. At this point, the kinetic energy of the collision has been completely transformed into the elastic and plastic deformation energy of the structure. Due to the release of elastic energy, the component is in a state of resilience, the impact force begins to decline rapidly, and the increased speed of the SEA can be gradually reduced until the breech and the stopper are separated.

Curves of the specific energy absorption versus time.
The performance parameters of the stopper before and after optimization are listed in Table 4. Comparing the topology optimization with the slot clearance optimization, the SEA is found to increase by 2.2 times in slot clearance optimization. This shows that slotting in the middle of the stopper can improve its ability to absorb energy.
Performance parameters of stopper before and after optimization.

SEA: specific energy absorption.
Conclusion
In the present work, the results of the experimental, analytical, and numerical studies on the impact force are presented. The stress and deformation of the cartridge and gun bore are calculated with the theoretical analysis. To obtain the impact force curve, a dynamic model for the breechblock extractor is built in ADAMS, and the maximum value reaches 22.346 kN. The experimental maximum value of the impact force is 20.83 kN, the analytical value is 20.354 kN, and the error is only 2.34%. The numerical results are higher than the experimental results of 7.28%.
The dynamics analysis is carried out for the breechblock based on the results obtained above. The maximum stress of the impact parts is 1436 MPa, which exceeds fatigue limit stress of the material, so that the structure optimization should be performed. The stress distribution of the stopper is obtained using ADAMS and experiment, which is less than the yield limit. The optimization of the stopper is focused on the impact absorbing shock.
It can be concluded from the optimization results that the slot can play a cushioning role when it is subjected to the impact force. This gives the important result that the slot clearance is 0.3 mm. After the shape optimization, compared with the original model, the mass of the stopper is reduced by 30.89%. The maximum stress is 818.28 MPa, which is only 9.4% larger than that of the original model, and it is lower than the yield strength of the material. The maximum displacement is 0.802 mm, which is 11.8% less than that of the original model. The total energy absorption of the stopper is improved by 23.3%. The results show that this optimization design method is verified to improve the total energy absorption of stopper. This can provide a reference for the structural design of other mechanical components subjected to impact loading.
Footnotes
Handling Editor: Filippo Berto
Declaration of conflicting interests
The author(s) declared no potential conflicts of interest with respect to the research, authorship, and/or publication of this article.
Funding
The author(s) disclosed receipt of the following financial support for the research, authorship, and/or publication of this article: This work is partially supported by Ship Technology Research Foundation of China (no. 14J4.3.2).