
Abstract
Crash boxes are vital components in automotive safety systems, designed to absorb impact energy during collisions and protect vehicle occupants. Thin-walled structures with intricate geometries are commonly employed in crash box designs due to their lightweight nature and high energy absorption efficiency. Among these, concave structures have demonstrated superior crashworthiness compared to conventional thin-walled configurations. In this study, a crash box featuring a concave structure is designed and manufactured with consideration of practical manufacturing constraints. Its crushing behaviour is investigated under both quasi-static and dynamic loading conditions. The performance of the proposed design is benchmarked against a commercially available crash box. Results show that while both designs achieve comparable total energy absorption, the proposed crash box exhibits twice the specific energy absorption, indicating a significantly lighter structure. Furthermore, the influence of impact initiators is examined, highlighting their critical role in enhancing crash box performance.
Introduction
With the advancement of modern society, autonomous vehicles have become indispensable modes of transportation, resulting in a significant increase in the demand and production of various vehicle types. Passenger safety is of utmost importance during crash incidents. Consequently, vehicle structural design focuses primarily on protecting occupants and absorbing impact energy. As shown in Figure 1, crash boxes are located between the front rail and the bumper beam, serving to convert kinetic energy into strain energy while preventing excessive force transfer to the passenger compartment. As such, the study of crash boxes has become critical to the development of safer vehicles.1–5
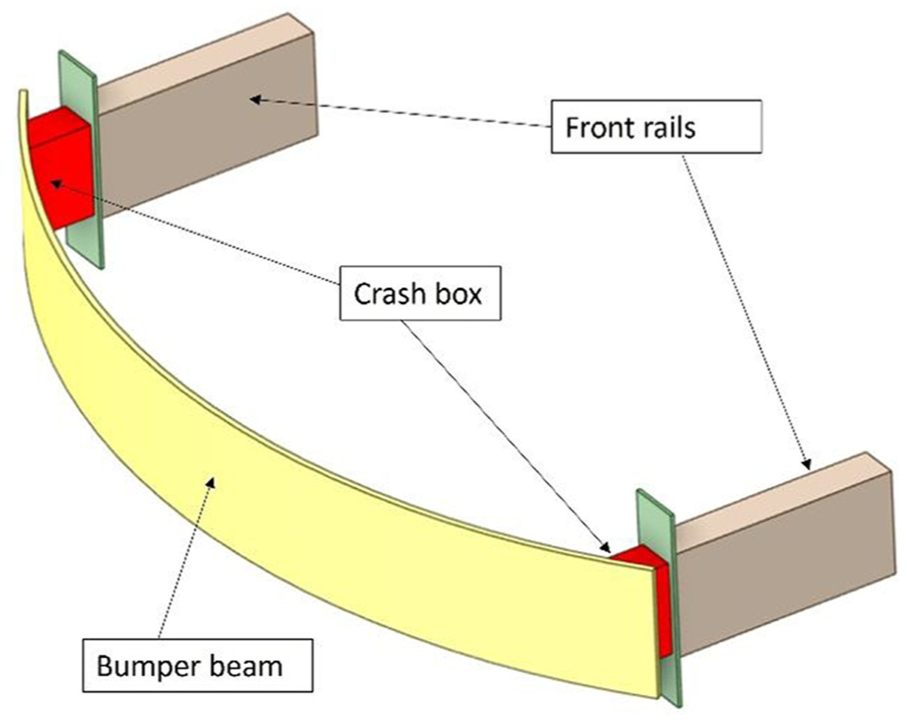
The scheme of the crash box which is located between bumper beam and front rails.
Among the various energy-absorbing structures used in the automotive industry, thin-walled (TW) structures are particularly competitive due to their excellent energy dissipation capabilities and ease of manufacturing. The concept of TW structures involves beams with various cross-sectional shapes. Common configurations include circular,6–8 triangular, 6 square,6,9–11 polygonal,12,13 and multi-cell geometries.14–17 These traditional TW structures, mostly exhibiting convex geometries, have been thoroughly investigated through theoretical analysis, numerical simulation, and experimental testing.9,13,18 Furthermore, studies also focus on the use of composite materials in the fabrication of TW structures and investigate whether variations in composite configurations influence crash performance.19–21
The crashworthiness of TW structures with different cross-sections has been evaluated based on metrics such as energy absorption, force–displacement responses, and peak forces during deformation. Previous studies have shown that cross-sectional geometry significantly influences energy absorption characteristics. For instance, the crashworthiness of convex polygonal structures improves as the number of edges increases 22 ; however, once the number of edges exceeds 11, the crush strength tends to reach a saturation point. 23 Further studies on convex TW tubes by Duarte et al. demonstrated that energy absorption can be enhanced by filling structures with lightweight materials such as closed-cell metallic foams 24 or advanced pore morphology foam elements. 25
To further enhance the crashworthiness of TW structures used in crash boxes, concave geometries have recently been proposed. Tang et al. 26 demonstrated that concave structures exhibit superior crashworthiness compared to convex structures. Building on this, Sun et al. 27 further explored concave TW structures and concluded that their geometric parameters significantly affect energy absorption performance. More recently, an innovative evolutionary design method was introduced for concave structures, achieving greater energy absorption and structural stability than conventional approaches. 28
Several studies have examined the role of impact initiators in enhancing the energy absorption performance of crash boxes. Nasution et al. investigated various crash box designs that combined frusta-shaped sections with three different cross-sectional geometries: square, hexagonal, and circular. Circular holes were introduced as impact initiators. 29 However, their study lacked a detailed analysis of how these initiators influenced energy absorption. In a separate study, Hussain et al. compared slot-based and front-end impact initiators and found that the effectiveness of such initiators depends on the cross-sectional geometry of the crash box. In certain configurations, the presence of an initiator improved energy absorption, while in others, it reduced performance compared to designs without initiators. 30 Notably, both studies Nasution et al. 29 and Hussain et al. 30 did not consider the manufacturing constraints associated with introducing impact initiators into crash box structures. Addressing this gap, Kulkarni et al. proposed a novel approach involving thermo-mechanical impact initiators, which were introduced at discrete locations in a conventional aluminium square crash box to enhance crashworthiness. This method, implemented through friction stir processing, achieved a 24% reduction in peak force. 31 However, it requires materials with high heat resistance and increased wall thickness, which runs counter to lightweighting initiative. With the growing maturity of 3D printing technology, it is now feasible to automatically fabricate metal crash boxes with high precision. However, limited research has addressed the design of crash boxes specifically for metal 3D printing, especially when considering real-world manufacturing constraints. Moreover, few studies have conducted direct comparisons between crash boxes based on TW structures and commercial crash box models.
The purpose of this study is to design a novel crash box using metal 3D printing, with consideration given to manufacturing constraints. The key innovation in this paper is the integration of additive manufacturing constraints, particularly printability, directly into the design process. This approach ensures that the crashbox design is not only structurally efficient but also readily manufacturable using 3D printing technologies. The design features lattice metamaterials made of concave thin-walled (TW) structures, supporting the lightweighting strategy while being optimized for energy absorption. A notable element is the inclusion of a geometrically simple yet functionally effective impact initiator. This feature is specifically tailored to be printable without the need for excessive support structures. The crash box is benchmarked against a commercially available counterpart to assess its practical viability. This work also addresses key limitations in current research, particularly the lack of focus on industrial manufacturability. This work also addresses several key limitations identified in existing crash box research. Previous studies have examined the design of 3D-printed crash boxes.32,33 However, these designs often involve complex geometries, and the impact of manufacturing quality has not been fully addressed. Furthermore, their performance has not been compared with commercial crash boxes, which reduces the relevance to real-world applications. In this research, a relatively simple geometry has been adopted for crash box design to offer greater assurance of 3D printing quality and enable a more practical performance assessment. It is important to note that the findings are based on laboratory-scale experiments and do not yet reflect the feasibility of large-scale industrial production.
The remainder of this paper is structured as follows: Section “Design concept of crash box” discusses the design concepts of concave tubes, the crash box models, and associated impact initiators. Section “Validation of the finite element method” presents the validation of the numerical method, including simulation reliability and mesh convergence analysis. Section “Comparison between LMS2 and a commercial crash box” compares the proposed crash box with a commercial model under quasi-static and dynamic analyses. Section “Effect of impact initiator with different locations” investigates the influence of different impact initiator positions on crash box performance, and Section “Effect of different number of unit cells” evaluates the effect of varying the number of concave tube elements on the overall crashworthiness of the crash box.
Design concept of crash box
Design of crash box
This section introduces the design concept of the proposed crash box. The design is inspired by the concave structure reported by Tang et al., 26 which demonstrated excellent energy absorption performance. Their study showed that Evolution Approach II outperforms Evolution Approach I proposed in earlier work. 26 Based on these findings, Concave Tube Structure 3 (CTS3) from Chen et al. 28 is adopted in this study to develop a lightweight crash box using lattice metamaterials. Specifically, three identical CTS3 units are connected to form a Lattice Metamaterial Structure (LMS1), which results in an overall triangular thin-walled tube configuration, as illustrated in Figure 2(a). This design not only leverages the energy absorption benefits of lattice metamaterials but also considers the need to reduce manufacturing complexity for metal 3D printing. Since the crash box is designed for metal 3D printing, a wall thickness of 0.5–0.6 mm is considered the practical lower limit achievable with this manufacturing method.34,35 This range is selected not only to meet the technical constraints of additive manufacturing, but also to support lightweighting initiative. Despite the lower bound thickness, research has shown that crash boxes designed with thin walls in this range can still demonstrate a measurable level of energy absorption effectiveness. 36 Additionally, the symmetric geometry of LMS1 promotes uniform load distribution and enhances structural stability during impact. The impact initiator is a specially designed component integrated into the crash box, functioning as a trigger to guide controlled deformation from the very onset of a collision. Its primary role is to ensure predictable energy absorption by directing the collapse behaviour under impact, while also serving as a mechanical weak point to reduce the initial peak force. In this case, the impact initiators take the form of triangular grooves located on the thin-walled structure, which is similar with the horizontal slits impact initiators in Kösedağ. 19 This design is chosen because the horizontal slits configuration exhibits a lower peak force, which is crucial for crash box collisions.
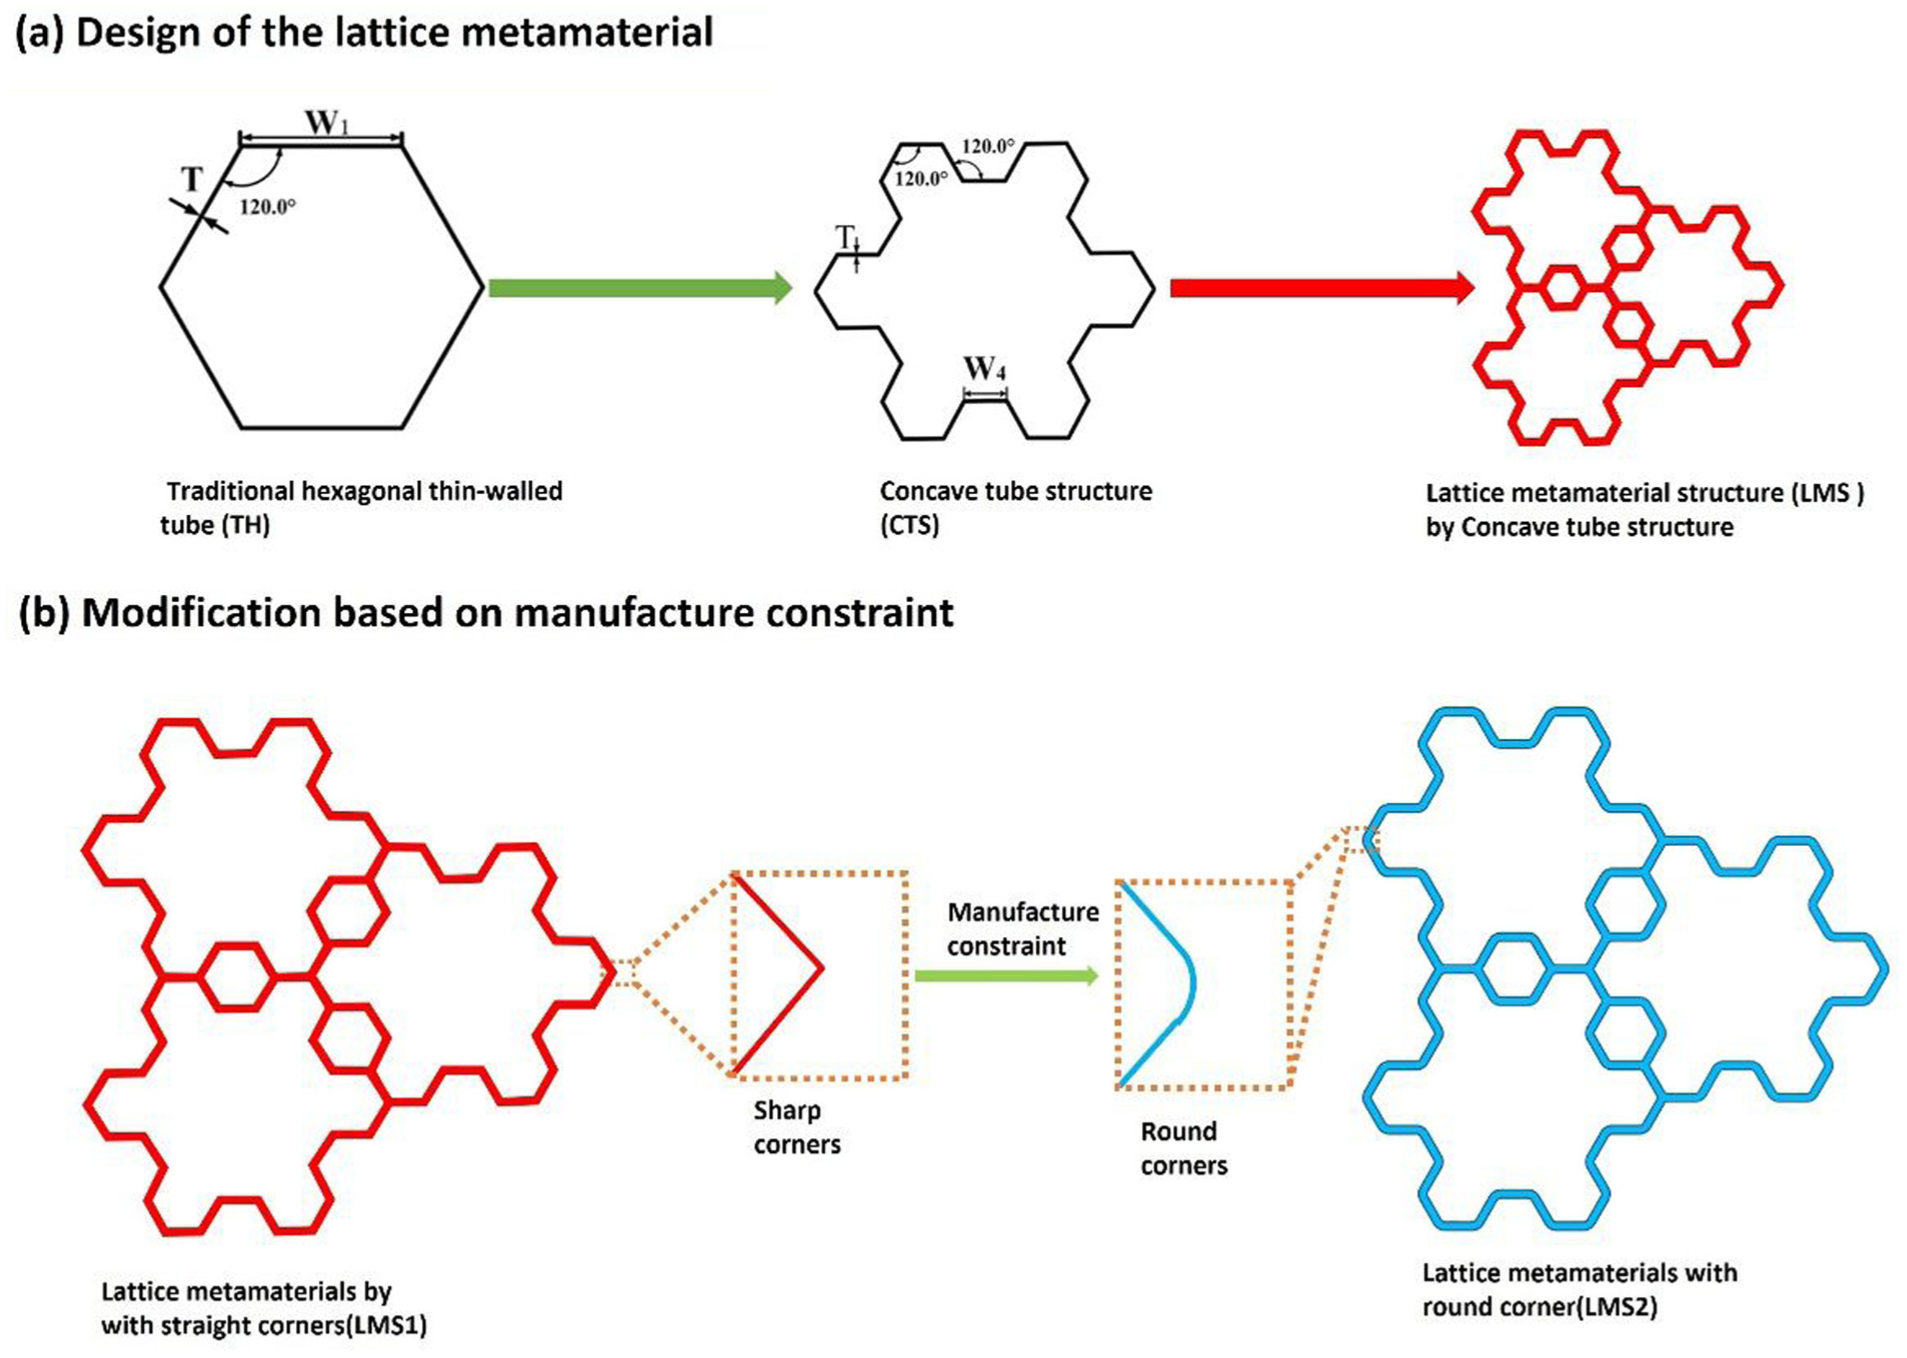
(a) The flow chart of how to design the LMS1 and (b) the modification on LMS1 based on 3D printing manufacture constraint.
Energy absorption characteristics of crash box
One of the primary objectives of this study is to design a crash box that is compatible with metal 3D printing processes. To minimize deformation and enhance the quality of printed specimens—particularly by reducing the formation of cracks and microvoids—all sharp corners in the initial lattice metamaterial structure (LMS1) have been redesigned with rounded corners, resulting in an updated structure referred to as LMS2,37,38 as shown in Figure 2(b). The radius of these rounded corners is set to 2 mm, with corresponding internal angles of 60°.
The crashworthiness of a crash box is typically evaluated using a set of key performance indicators. In this study, the initial peak crushing force (IPF), energy absorption (EA), specific energy absorption (SEA), and effective stroke length (
The initial peak crush force is the maximum peak force which is obtained for the first time from the initial stage of crushing. The effective stroke length 39 is the effective crush displacement when the deformation efficiency f(x) reaches a maximum, defined as follow:
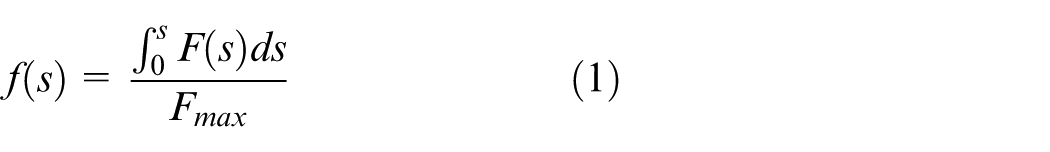
where s is the axial crushing distance, F is the axial crushing force, and F max denotes the maximum crush force in the interval [0, s].
The energy absorption is defined as the total energy absorbed during the effective stroke length, and it can be quantified as the area under the force–displacement curve, expressed as follows:
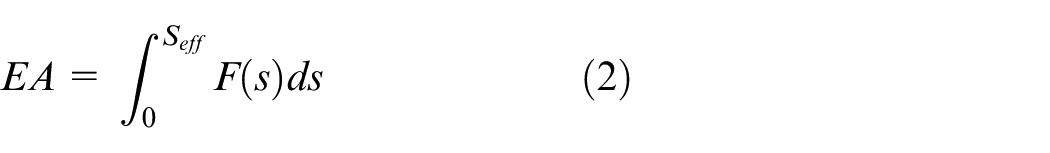
And specific energy absorption is defined as the ratio of the energy absorption EA to the mass of the structure m:
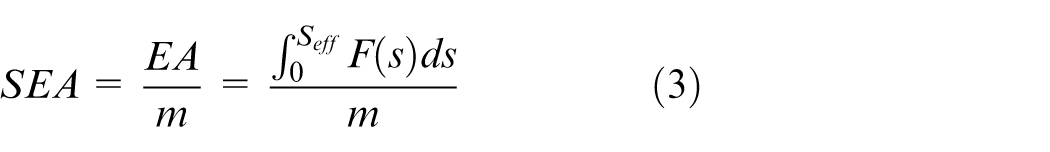
where m is the mass of the crash box. Mass plays an important role in crash performance, as a lightweight crash box contributes to improved fuel efficiency and reduced overall vehicle weight. Consequently, it is essential to design crash boxes with high specific energy absorption to ensure both safety and efficiency.
Validation of the finite element method
Reliability of numerical analysis
In this study, the finite element method (FEM) using LS-DYNA within ANSYS is employed to conduct the numerical analysis of LMS2. To ensure the reliability of this approach for crash box analysis, this FEM is validated by reproducing the simulation of CTS3 28 and comparing the numerical results with both their original simulation and experimental data. For the CTS3 model, the mesh element size is set to 1 mm, resulting in a total of 393,332 elements. All other parameters remain consistent with the original study. As shown in Figure 3, the three force-displacement curves exhibit good agreement, confirming the accuracy of the numerical approach. The crumpling happens from the top with layer by layer to form the progressive buckling mode. The minor deviations observed among the three results may be attributed to differences in numerical software and modelling techniques. Based on this validation, the reliability of this FEM is confirmed, making it suitable for the subsequent simulations and analyses in this study.
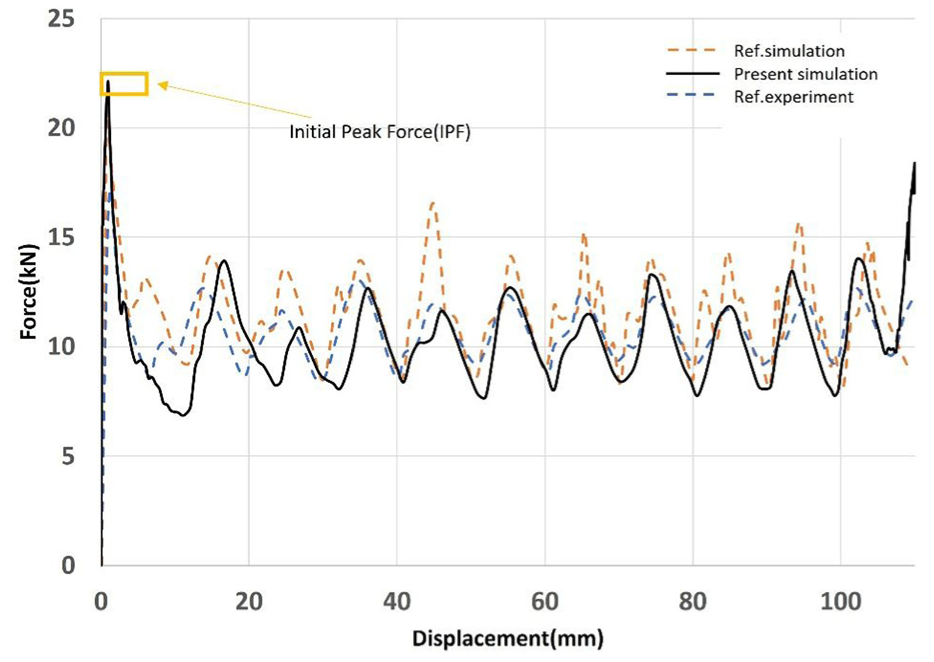
Comparison of load-displacement curves between the method and numerical and experimental methods from Duarte et al. 25
Mesh convergence analysis
As is well known, mesh size plays a crucial role in the precision of numerical simulations. Therefore, it is essential to determine an appropriate mesh size and element count to achieve accurate results while maintaining computational efficiency.
The geometric parameters of LMS2 are defined as follows: all edges of LMS2 have an equal length of 9 mm, the thickness of LMS2 is 0.5 mm and the tube has a total height of 150 mm. These impact initiators have a depth of 0.3 mm and are positioned 10 mm from the top. They are distributed along the surfaces, with one placed on every other surface. For this study, the commonly used aluminium alloy for 3D printing, AlSi10Mg, is selected as the crash box material. Its characteristic properties are as follows: the density ρ = 2700 kg/m3, Young’s modulus E = 69 GPa, Poisson’s ratio ν = 0.33, the yield stress = 250 MPa. The true stress-plastic strain curve of the material is plotted in Figure 4(c) from Rabori and Fallah. 40 at room temperature.
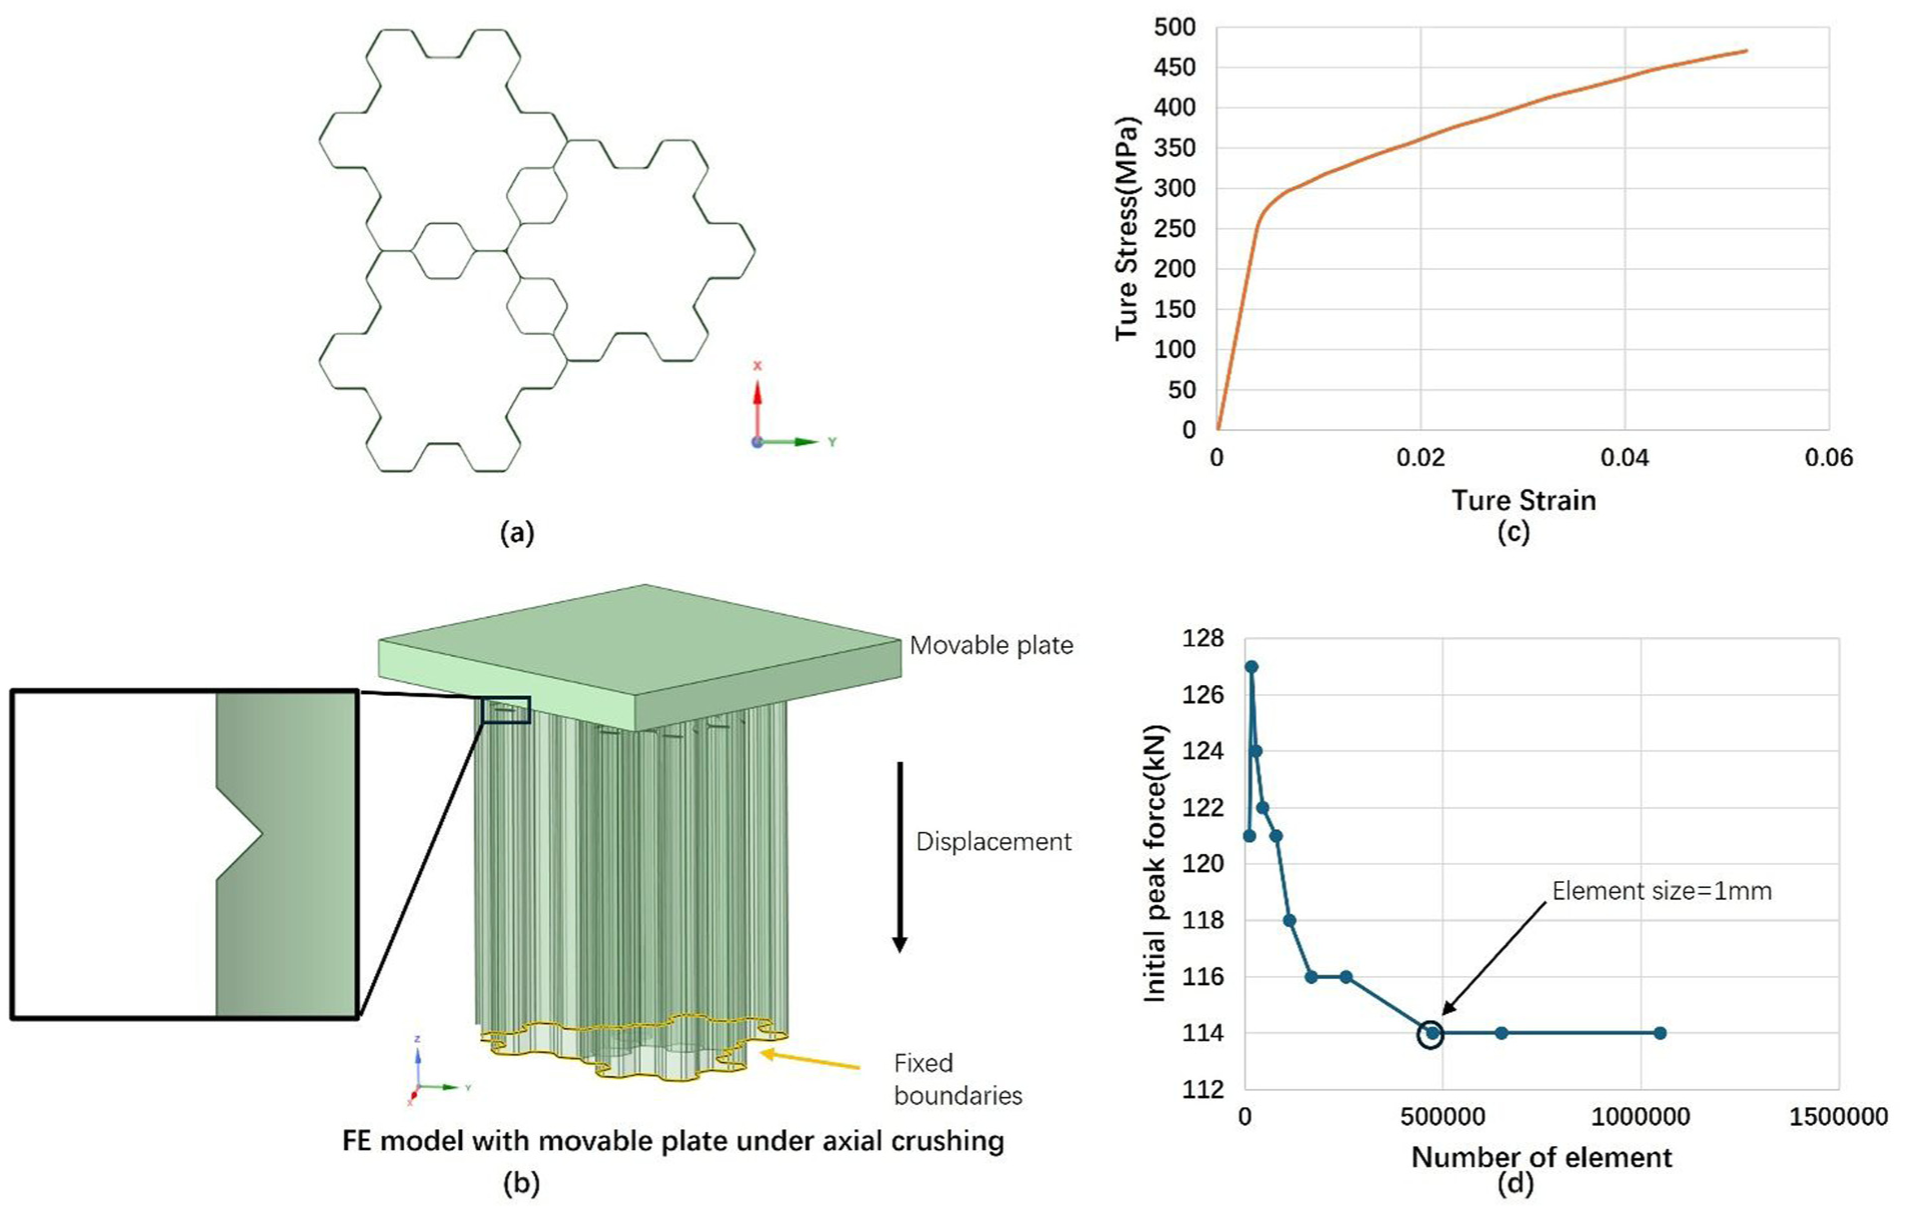
(a) Cross-section of LMS2, (b) the 3D-view of LMS2, (c) true stress-strain curve of AlSi10Mg, and (d) mesh convergence analysis of LMS2 with different mesh size.
Among this model, the crash box is placed under a moving rigid plate, and the top plate only moves along the axial direction. The top view of LMS2 is shown in Figure 4(a). The mass of the moving rigid plate is set to 560 kg. Fix support is adopted at bottom boundaries that all directions are restricted, as illustrated in Figure 4(b). Figure 4(b) also illustrates the shape of the impact initiator. As shown in the side view, the initiators are characterized by triangular grooves. The friction coefficient of all bodies in the connection is set as 0.1, while the contact between the top plate and the specimen is defined as bonded.
A quasi-static analysis is performed to determine IPF at different mesh sizes. To satisfy the requirement of quasi-static analysis, smooth step displacement curve is employed by applying loads gradually to make sure the deformation is very slowly, and the inertia force can be ignored. The advantage of this smooth step definition method is to complete the simulation in the shortest time. The method from Abaqus [Abaqus/CAE User’s Guide 6.14] is utilized to automatically generate the smoothest load amplitude. And the equation between load amplitude A and time t is presented as follow:
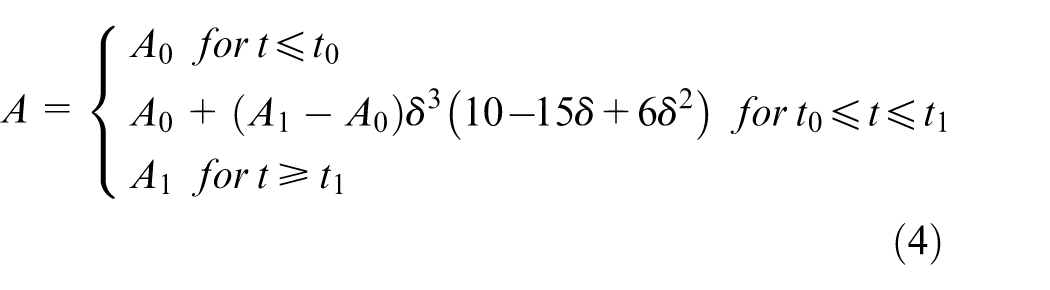
where δ = (t − t0)/(t1 − t0). Here t0 is the beginning time, which is normally set as 0 s and t1 is the end time, set as 0.02 s. A0 is the beginning amplitude, set as 0 and A1 is the load amplitude at end time, set as 100 mm.
Figure 4(d) illustrates the relationship between the number of elements and IPF. When the number of mesh elements exceeds 400,000, the IPF begins to converge and the change of IPF can be ignored when the element size is smaller than 1 mm. Therefore, to balance accuracy and computational efficiency, a mesh size of 1 mm is selected for the subsequent analysis. After the numerical results are obtained, it is necessary to make sure the process is quasi-static. Hence the ratio of kinetic energy to internal energy is further calculated. The analysis confirms that this ratio remains sufficiently low (below 5%) for the majority of the simulation, validating the quasi-static conditions.
Comparison between LMS2 and a commercial crash box
Comparison under quasi-static analysis
To evaluate the crashworthiness of LMS2 in the field of commercial automotive applications, a commercial crash box with similar dimensions, as shown in Figure 5(a), is utilized for comparison. The parameters for the quasi-static analysis of the LMS2 with a thickness of 0.5 mm have been described in the previous section. Additionally, LMS2 is further examined with two different thicknesses for all surfaces, 0.5 and 0.6 mm, referred to as LMS2-0.5 and LMS2-0.6 mm, respectively. This analysis investigates how thickness influences the crash box’s performance during quasi-static testing. For comparison, the commercial crash box is selected from a commercial vehicle and is made of aluminium alloy 6063, the most commonly used material for crash box manufacturing. 41 The thickness of the commercial crash box is 4 mm, and its mass is 440 g.
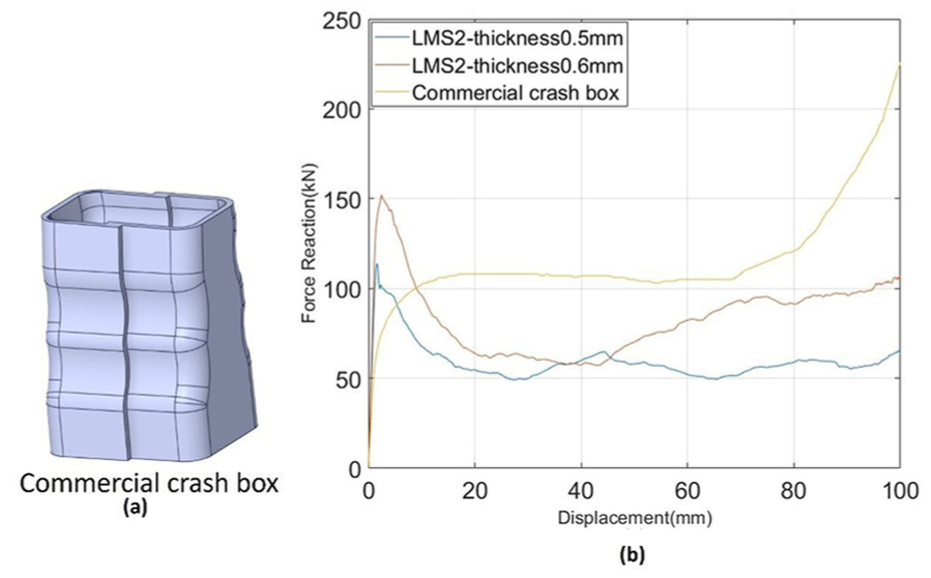
(a) The model of crash box from commercial crash box and (b) the quasi-static analysis of the force with displacement.
Figure 5(b) presents the force-displacement curves of two LMS2 crash boxes and a commercial crash box within a crushing displacement of 100 mm. The energy absorption of LMS2-0.5 and LMS2-0.6 mm is 5.9 and 8.3 kJ, respectively, while the commercial crash box absorbs 8.51 kJ.
As observed in Figure 5(b), both force-displacement of LMS2 curves rise rapidly to their IPF before quickly decreasing. LMS2-0.6 mm exhibits higher force-displacement values than LMS2-0.5 mm, indicating that it absorbs more energy. However, LMS2-0.6 mm also has a higher IPF, suggesting that LMS2-0.5 mm begins absorbing energy more easily and earlier. In contrast, the force-displacement curve of the commercial crash box rises sharply to its IPF and remains relatively stable. Unlike the LMS2 tubes, the commercial crash box undergoes a third stage of crushing—the densification stage—where the load increases significantly, and the crash box cannot absorb energy anymore. Under quasi-static analysis, the effective stroke length of the commercial crash box is 80.8 mm.
Figure 6 illustrates the deformation modes of each crash box at five different crushing displacements during quasi-static analysis. The LMS2 tubes are 150 mm in height, as shown by the distance between the green dashed lines and the black solid lines in Figure 6. The crushing process of the LMS2 tubes can be divided into two stages. In the first stage, when the external load is first applied, the structure mainly undergoes elastic deformation. At the end of this stage, the first fold forms and the crushing mechanism begins to operate, signalling the transition to the second stage. Figure 6 presents that when displacement is 25 mm, both LMS2 crash boxes have already begun to fold, indicating that the process has entered the second stage. The second stage involves progressive crushing, during which kinetic energy is dissipated through deformation, reducing the impact forces transmitted to occupants. Since the effective stroke length of both LMS2 tubes exceeds 100 mm, the final densification stage is not observed in Figure 6(a) and (b). Both LMS2 crash boxes exhibit similar deformation modes at these crushing displacements. For the LMS2 crash boxes, the initial crushing occurs near the top, and deformation propagates progressively from top to bottom.
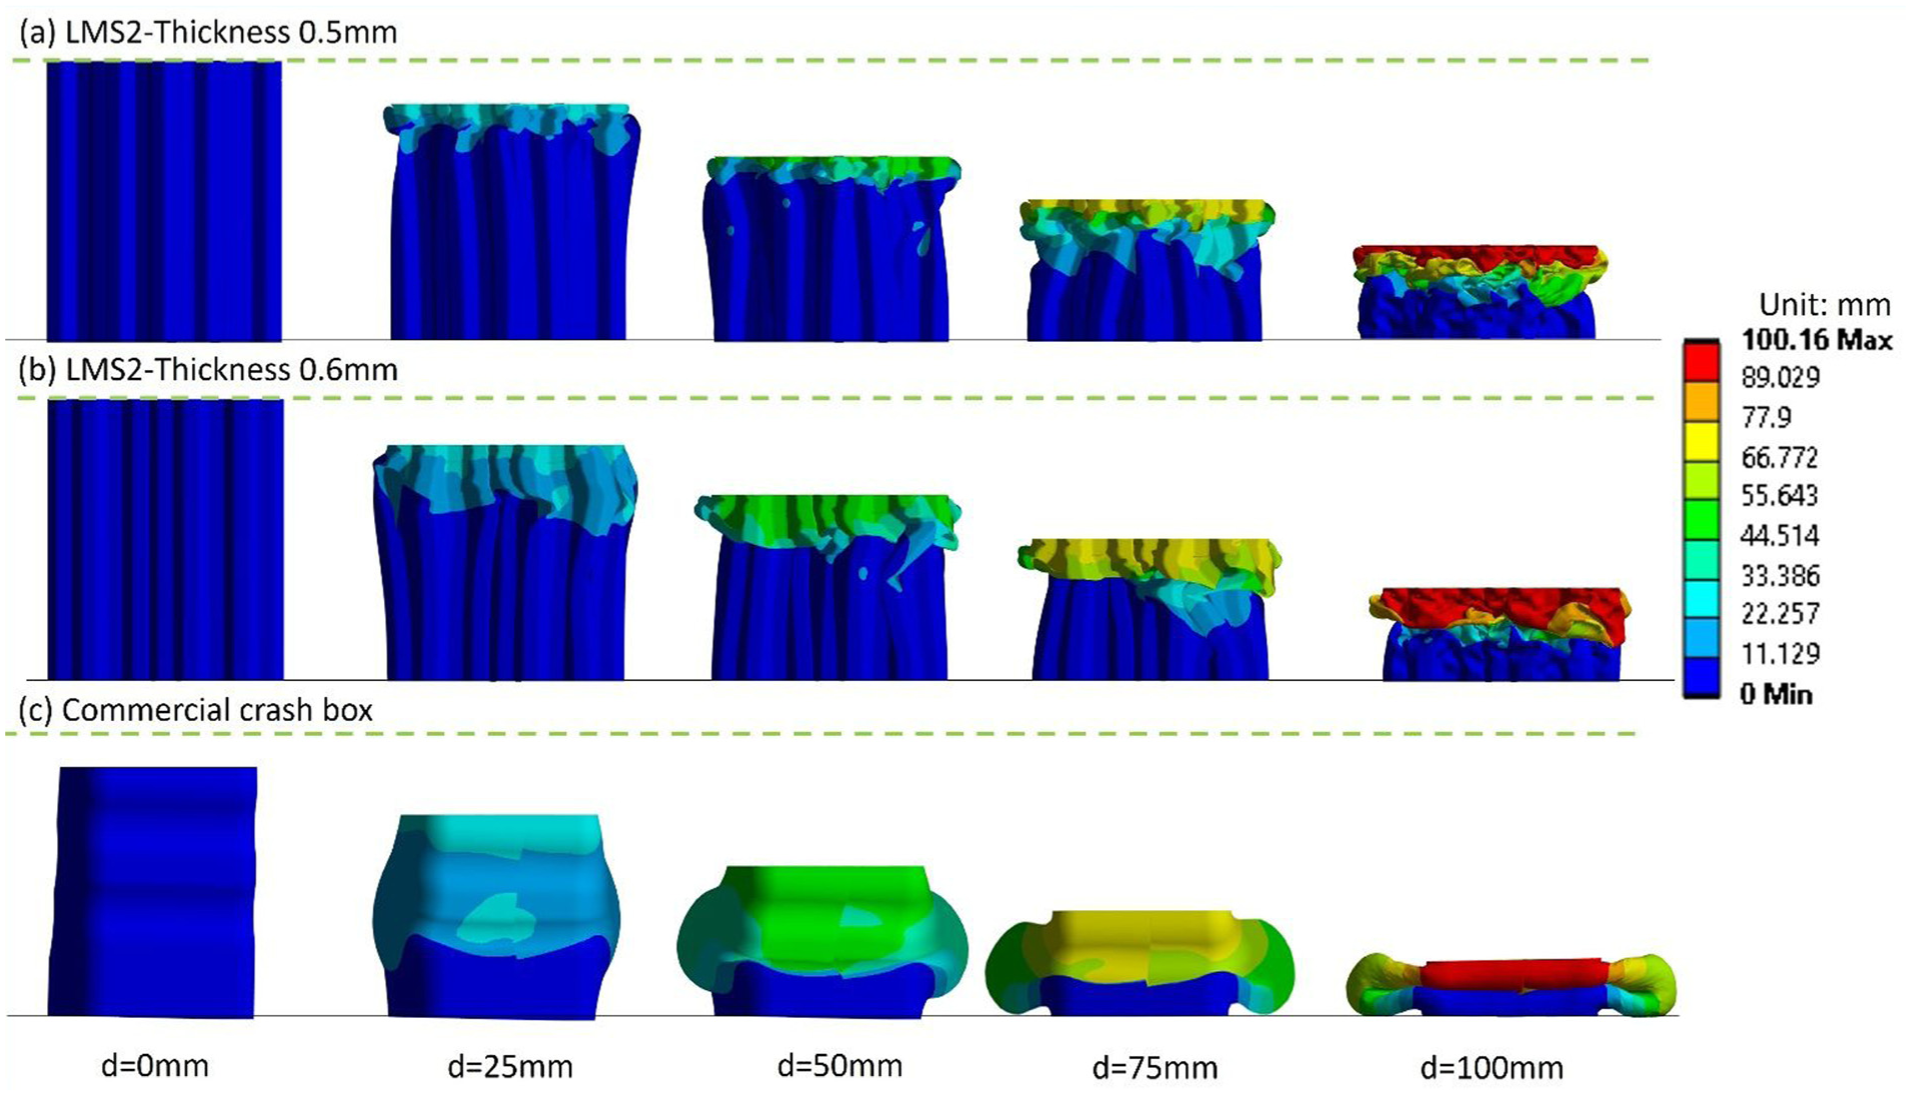
The deformation results of the LMS2 with different thickness: (a) 0.5 mm, (b) 0.6 mm, and (c) commercial crash box at different displacements. When d = 25 mm, all crash boxes exhibit progressive folding, indicating entry into the second stage of crushing. Between 25 and 100 mm, both LMS2 crash boxes remain in the second stage and continue to absorb energy. In contrast, the commercial crash box remains in the second stage only up to 80.8 mm and reaches the third (densification) stage when displacement is 100 mm.
At the displacement of 100 mm, the entire length of both LMS2 crash boxes is nearly adopted in the crushing process. This suggests that 100 mm is close to the effective stroke length, meaning the crash box will fail to absorb energy if keep compress both LMS2 crash boxes. Figure 6(c) presents the deformation mode of the commercial crash box. Unlike the LMS2 tubes, the initial crush position in the commercial crash box occurs near the middle. The folding wavelength of the commercial crash box is much larger, and only a single folding layer forms throughout the collision. Additionally, the commercial crash box enters the densification stage at 80.8 mm crushing displacement.
Comparison under different loading rates
Furthermore, to better explore the energy absorption and SEA of these crash boxes under quasi-static and dynamic conditions, the crash performance of LMS2-0.5, LMS2-0.6, LMS2-0.7, LMS2-0.8, LMS2-0.9 mm and the commercial crash box is investigated at loading velocities of 5, 10, 60, 70, 80, 90, 95, and 100 m/s. Even though 100 m/s exceeds typical real-world driving speeds, it still represents an extreme velocity that a vehicle can potentially achieve. 42 Therefore, conducting simulations at such high speeds (95 and 100 m/s) provides valuable insights into the structural stability, failure mechanisms, and energy absorption saturation of the crash box. This approach allows us to verify whether the design remains reliable under extreme loading conditions, which is a critical aspect of crashworthiness research.
Figure 7 presents the force-displacement curves of the six crash boxes (LMS2-0.5, LMS2-0.6, LMS2-0.7, LMS2-0.8, LMS2-0.9 mm, and the commercial crash box) under different loading rates, while Figure 8 illustrates their energy absorption and SEA under quasi-static conditions (5 and 10 m/s) and dynamic conditions (60, 70, 80, 90, 95, and 100 m/s).
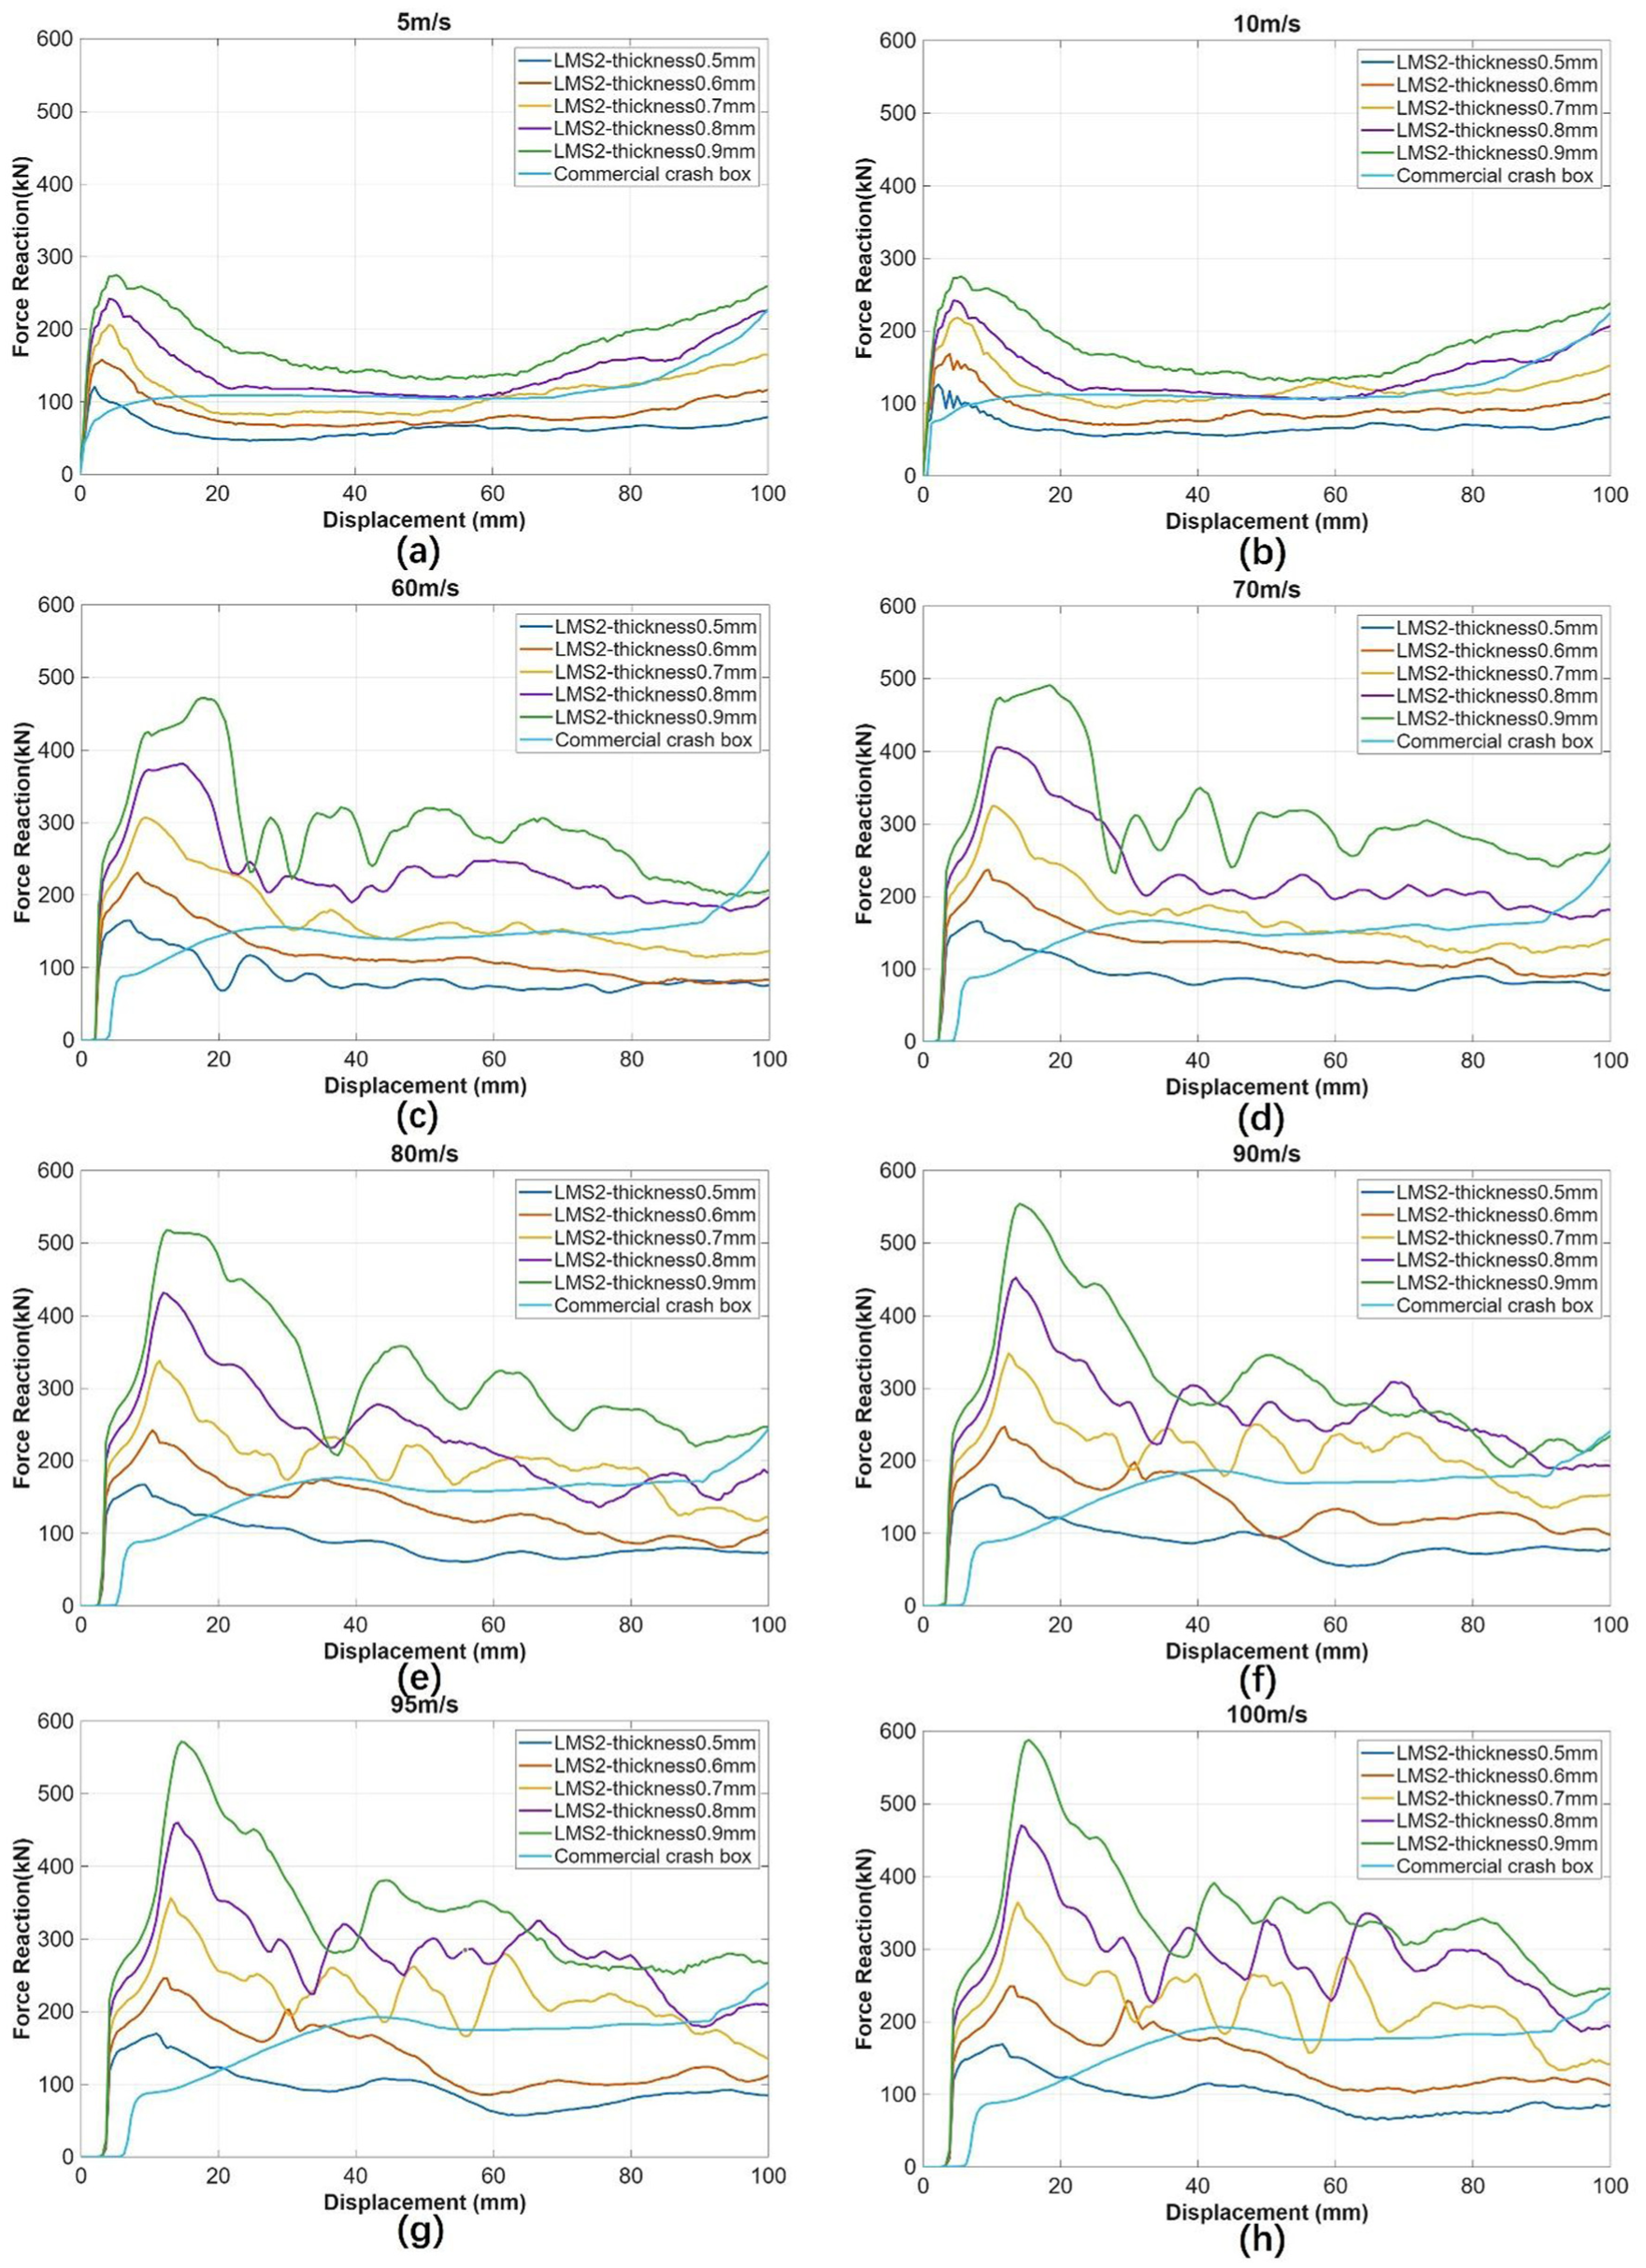
Comparisons of load-displacement curves between six crash boxes under load different velocity: (a) 5 m/s, (b) 10 m/s,(c) 60 m/s, (d) 70 m/s, (e) 80 m/s, (f) 90 m/s, (g) 95 m/s, and (h) 100 m/s.
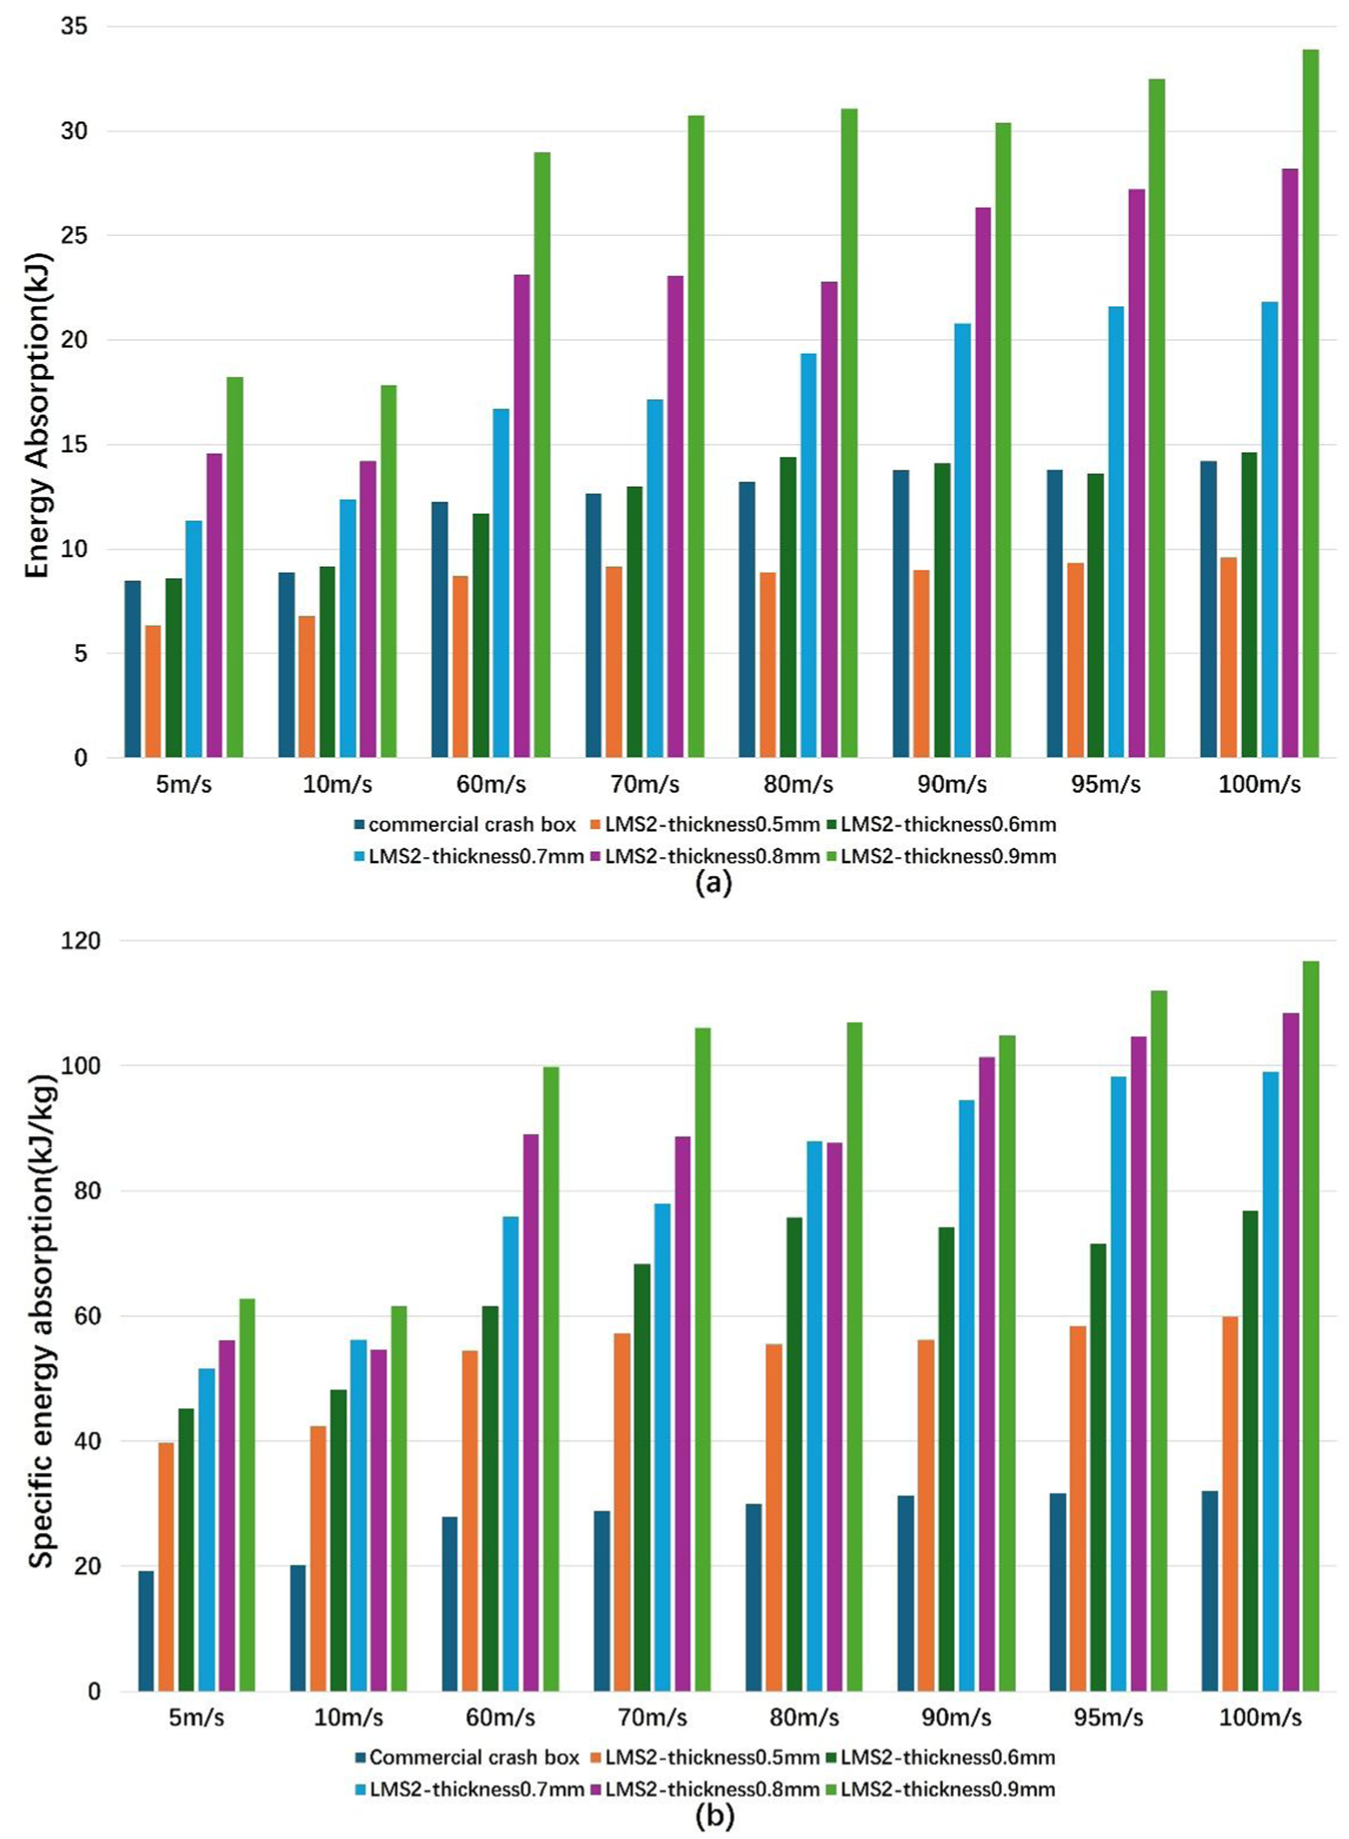
Comparison of (a) energy absorption and (b) specific energy absorption between the two LMS2 crash boxes and the commercial crash box.
Figure 7(a) and (b) show the load-displacement curves of the six crash boxes at low loading rates. The corresponding curves at 5 and 10 m/s exhibit similar trends. For the LMS2 crash boxes, the force-displacement curves rise sharply to IPF and then drop rapidly to start absorbing energy until reaching a displacement of 100 mm. LMS2-0.9 mm exhibits higher loads and a higher IPF compared to other thickness. In contrast, the commercial crash box curve rises to IPF and remains relatively stable. The final stage of the crushing process is observed in the commercial crash box, as the load increases significantly beyond a displacement of 80 mm. The effective stroke length of the commercial crash box is 79.8 mm at 5 m/s and 81.6 mm at 10 m/s.
Figure 7(c) and (d) illustrate the force-displacement responses of the six crash boxes under high-speed impact conditions at 60–100 m/s, respectively. These results correspond to the dynamic analysis of the structures. Overall, the forces experienced by all six crash boxes under high-speed loading are noticeably higher than those observed under low-speed conditions, as shown in Figure 7(a) and (b), particularly at the initial peak force (IPF).
For both LMS-0.5 and LMS-0.6 mm crash boxes, the force-displacement curves show a rapid rise in force up to approximately 250 kN. Once the IPF is reached, the force response transitions into an oscillatory decline until the displacement reaches around 60 mm. Notably, LMS-0.6 mm exhibits higher IPF and reaction forces compared to LMS-0.5 mm, indicating enhanced energy absorption due to increased wall thickness.
Moreover, the force-displacement behaviours at 95 and 100 m/s are similar across all crash box designs. This consistency suggests that the structures have reached a saturation point in energy absorption performance within this velocity range. It also confirms the stability and robustness of the crashbox designs under high-speed impact, demonstrating their ability to maintain reliable performance.
For the commercial crash box, IPF occurs later in the crushing process compared to low-speed loading conditions. Additionally, the effective stroke lengths are longer than those observed in the quasi-static analysis, with values of 92.0 mm at 95 m/s and 92.4 mm at 100 m/s.
For the LMS2 crash boxes, the reaction force of LMS2-0.6 mm is consistently higher than that of LMS2-0.5 mm. Moreover, both LMS2 tubes exhibit higher IPFs compared to the commercial crash box. IPFs occur later than in the quasi-static analysis, and neither has yet reached the third stage of the crushing process.
From Figure 7, the energy absorption characteristics of the crash boxes are not clearly visible. Therefore, Figure 8 presents the energy absorption and SEA for a more detailed comparison.
Figure 8(a) illustrates the energy absorption of LMS2-0.5, LMS2-0.6, LMS2-0.7, LMS2-0.8, LMS2-0.9 mm, and the commercial crash box under eight different loading rates. The dark blue bars represent the commercial crash box, while the orange and dark green bars correspond to LMS2-0.5 and LMS2-0.6 mm, and the light blue, purple, and light green bars correspond to LMS2-0.7, LMS2-0.8, and LMS2-0.9 mm, respectively. The energy absorption of the commercial crash box is higher than that of LMS2-0.5 mm and comparable to LMS2-0.6 mm across all loading velocities, but the energy absorption of the commercial crash box is lower than those of LMS2-0.7, LMS2-0.8, and LMS2-0.9 mm. In low-speed conditions, the highest energy absorption is 18.22 kJ for LMS2-0.9 mm at 5 m/s, while the lowest is 6.34 kJ for LMS2-0.5 mm at 5 m/s. Under high-speed conditions, LMS2-0.9 mm reaches a maximum energy absorption of 33.87 kJ at 100 m/s, while the lowest value is 8.71 kJ for LMS2-0.5 mm at 60 m/s. Overall, the energy absorption of all crash boxes increases as the loading speed increases. Furthermore, within the impact velocity range of 60–100 m/s, the energy absorption of the commercial crash box varies from 12.26 to 14.2 kJ. In comparison, the energy absorption of LMS2 with a 0.5 mm thickness ranges from 8.72 to 9.58 kJ, while that of LMS2 with a 0.9 mm thickness ranges from 28.97 to 33.87 kJ. The trend of LMS2 with five thickness between 60 and 100 m/s is similar. As the impact velocity increases, the energy absorption capacity rises slightly but already approaches a plateau. Therefore, between 60 and 100 m/s, the increase becomes negligible, indicating that the structure has reached its energy absorption saturation. Moreover, the analysis is limited to 100 m/s, as this represents the extreme impact velocity and the maximum speed attainable by the vehicle.
Furthermore, the mass of each crash box is taken into consideration, and SEA is plotted in Figure 8(b). The dark blue, orange, and dark green bars represent the SEA of the commercial crash box, LMS2-0.5, and LMS2-0.6 mm, respectively. And the light blue, orange, and light green bars represent the SEA of the LMS2-0.7, LMS2-0.8, and LMS2-0.9 mm, respectively. Since LMS2 is a thin-walled, lightweight structure, its SEA is at least twice that of the commercial crash box at all loading velocities. Under low-speed conditions, the highest SEA is 62.8 kJ/kg for LMS2-0.9 mm at 5 m/s, while the lowest is 19.2 kJ/kg for the commercial crash box at 5 m/s. Under high-speed conditions, the maximum SEA reaches 116.8 kJ/kg for LMS2-0.9 mm at 100 m/s, while the minimum is 27.9 kJ/kg for the commercial crash box at 60 m/s. Figure 8(b) indicates that the SEA increases with loading speed for all crash boxes. The energy absorption, SEA, and IPF are all influenced by the loading rate. Additionally, under all loading conditions, the two LMS2 crash boxes exhibit two crushing stages, whereas the commercial crash box undergoes three stages. Moreover, LMS-0.6 mm structure offers comparable energy absorption capabilities to the commercial crash box and is twice light than that of commercial crash box.
Effect of impact initiator with different locations
In this section, the effect of impact initiator location on the crash performance of LMS2 is explored. Typically, when the failure mechanism of a crash box involves progressive folding, the impact initiators are positioned about half the folding wavelength below the top of the crash box to guide the fold and reduce IPF. However, in the case of LMS2, the folding process is not periodic or regular. Therefore, it is necessary to determine the optimal position for the impact initiators in LMS2. To investigate this, a preliminary method is designed to evaluate the energy absorption capability of −0.6 mm with different impact initiators. Impact initiators are placed at varying heights, from 10to 140 mm, in 10 mm increments below the top of the LMS2 tube. Figure 9(a) to (c) present the LMS2-0.6 mm with impact initiators located at 10, 50, and 100 mm, respectively. These tubes are tested under both quasi-static analysis (with a smooth step amplitude curve) and dynamic analysis (with a loading rate of 100 m/s).
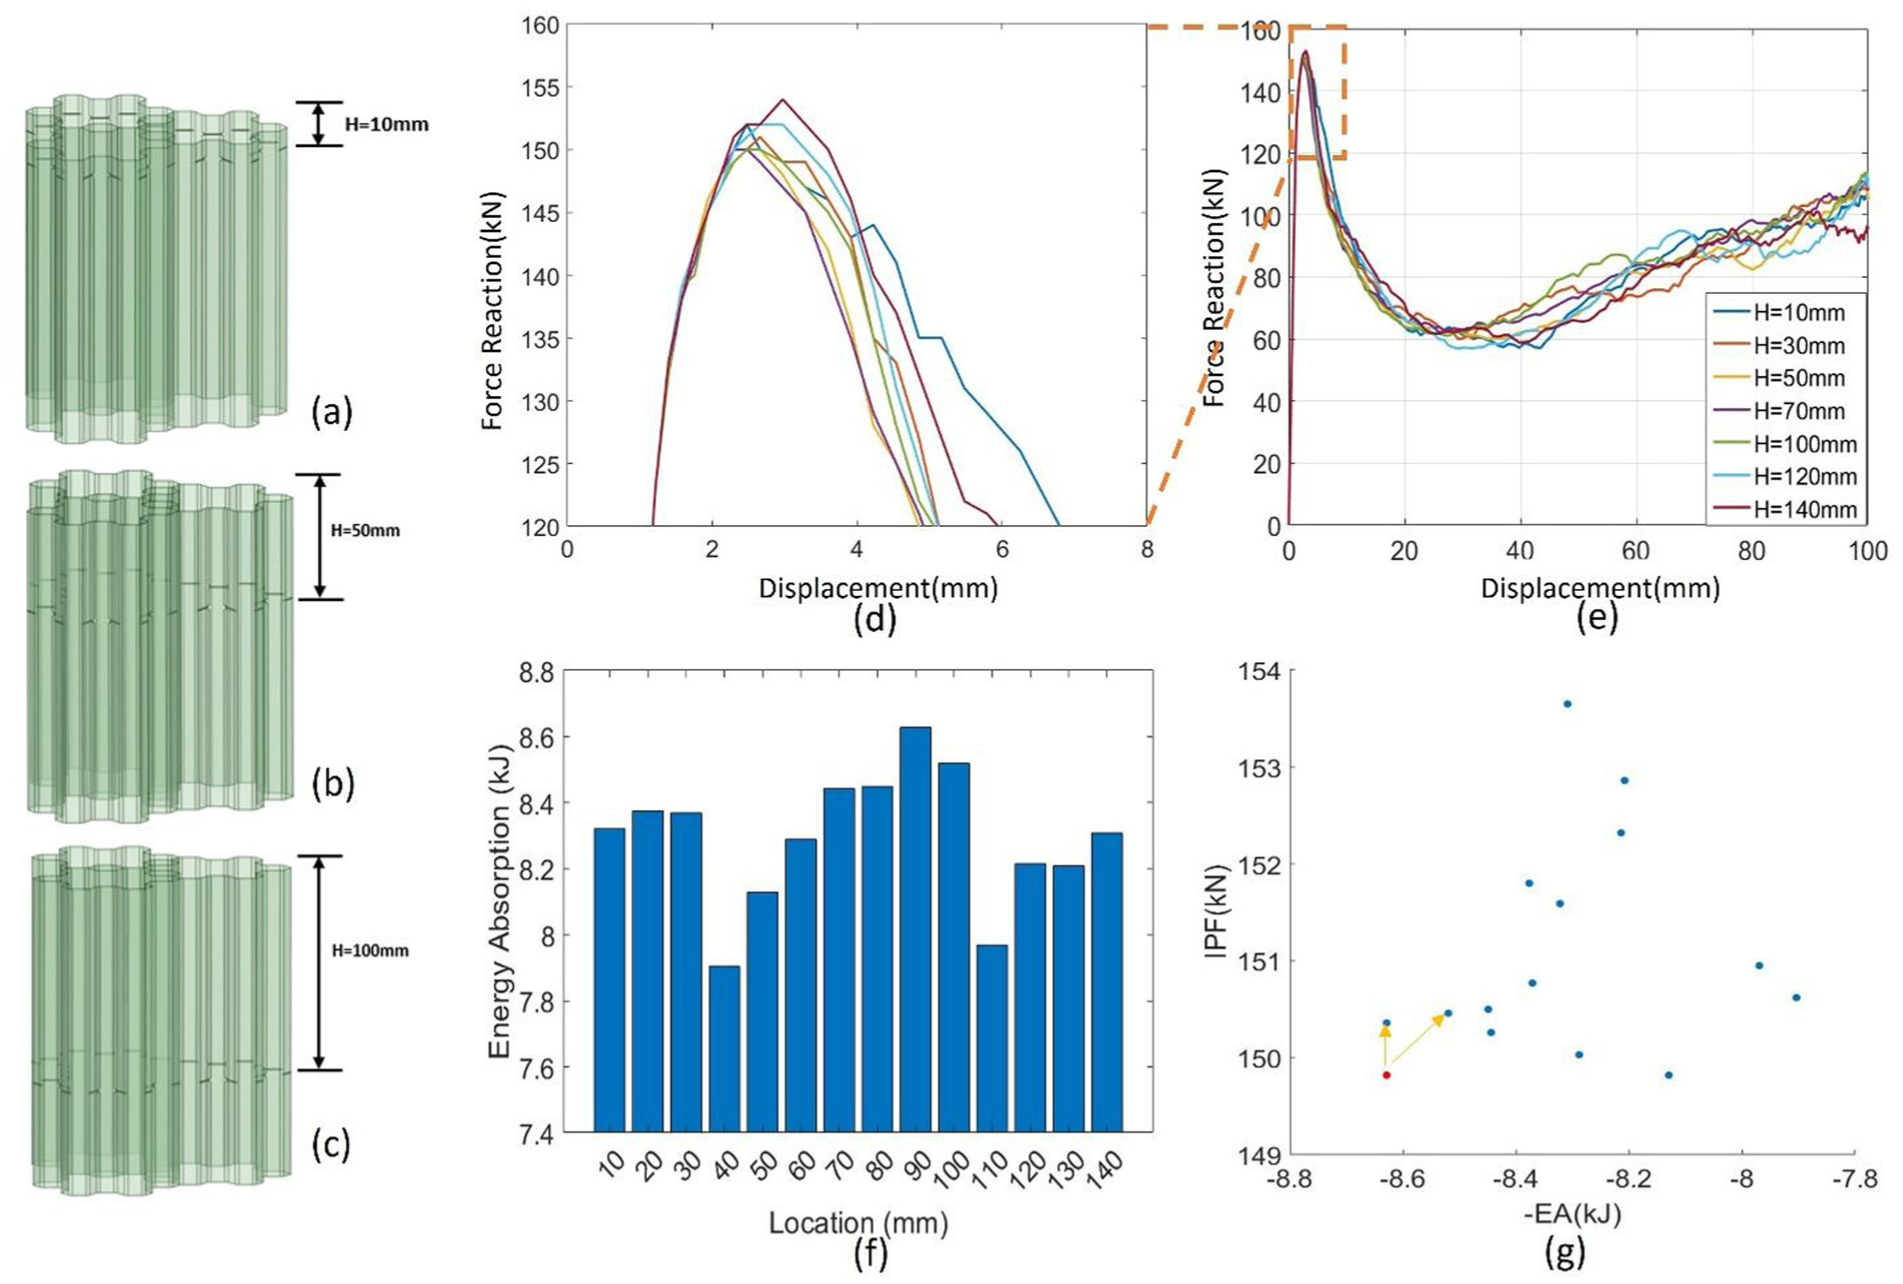
The scheme of LMS2 with different impact initiators at (a) 10 mm, (b) 50 mm, (c) 100 mm, (d) magnified zone of IPF in (e): (e) the load-displacement responses of LMS2 with different impact initiators under quasi-static analysis, (f) the energy absorption of LMS2 with different impact initiators under quasi-static analysis, and (g) the preliminary method to determinate the best position for impact initiators.
Figure 9(e) illustrates the load-displacement curves for half number of crash boxes. Figure 9(d) zooms in on the zone of IPF in Figure 9(e), making the IPF of each model clearer for comparison. Figure 9(f) presents a comparison of energy absorption for all the tubes. As shown in Figure 9(d), the LMS2 model with impact initiators placed at 70 mm exhibits the lowest IPF. Overall, the trends of all curves under quasi-static analysis are similar. The comparison of energy absorption in Figure 9(f) reveals that, as the height of the impact initiators increases, the change in energy absorption becomes unpredictable. Since both energy absorption and IPF must be considered to determine the best position for the impact initiators in LMS2, Figure 9(g) is used to help identify the optimal choice. In Figure 9(g), 14 blue dots represent 14 crash boxes with different impact initiator positions. The y-coordinates of the blue dots indicate their respective IPFs. As a general rule, the smaller IPF, the better the crash box performance. Therefore, the goal is to minimize the IPF among the dots. The x-coordinates of the blue dots represent their respective negative energy absorption(-EA) values. A crash box aims for higher energy absorption, so the goal is to achieve a minimum negative EA for LMS2. The red point represents the “ideal” crash box but does not exist in the simulations. Its x-coordinate corresponds to the minimum-EA value among all the crash boxes, and its y-coordinate corresponds to the minimum IPF value. The red point would indicate the model with the lowest IPF and the highest energy absorption. While this ideal point does not exist, it serves as a reference for selecting the best impact initiators for LMS2 by calculating the distance between the red point and the blue points. The model whose blue dot is closest to the red point is considered to have the best impact initiators for LMS2 under quasi-static analysis. Based on this approach, impact initiators placed at 90 mm are determined to be the best for LMS2-0.6 mm.
All the simulations are repeated under dynamic analysis to identify the optimal trigger position for LMS2-0.6 mm. Figure 10 presents LMS2-0.6 mm with different impact initiators under dynamic analysis. Figure 10(b) shows the load-displacement diagram for half of the structures, and Figure 10(a) magnifies the zone of IPF for (b).
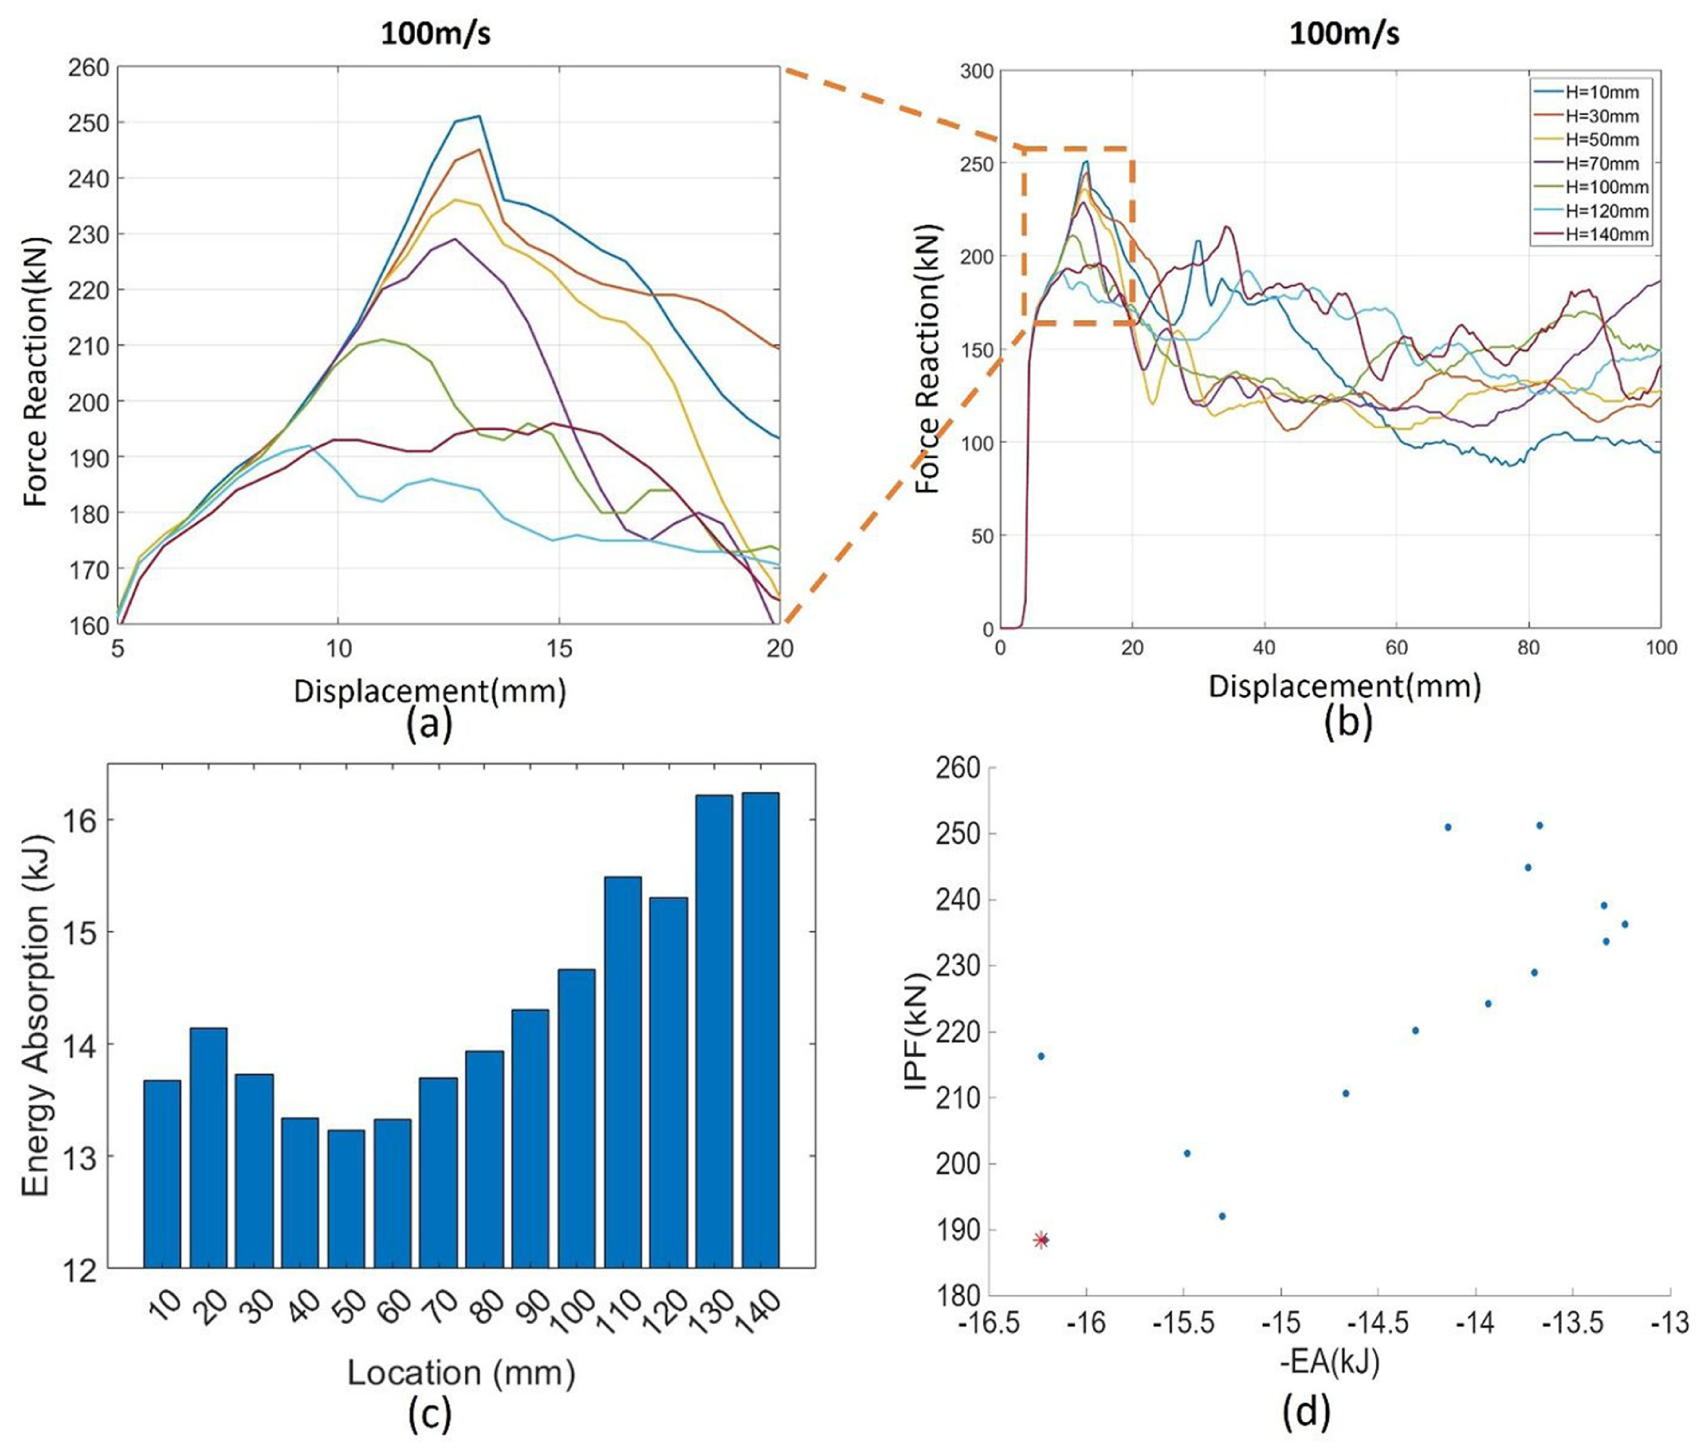
(a) Magnified zone of IPF in (b): (b) the load-displacement responses of LMS2 with different impact initiators under dynamic analysis, (c) the energy absorption of LMS2 with different impact initiators under dynamic analysis, and (d) the preliminary method to determinate the best position for impact initiators.
The trend of the curves changes significantly as the trigger height increases. Figure 10(c) compares the energy absorption of all the models, showing that the LMS2-0.6 mm with impact initiators at 140 mm absorbs the maximum energy. Figure 10(c) shows that the energy absorption generally increases with increasing trigger height. The slight decrease at H = 120 mm compared with H = 110 mm is attributed to local buckling and instability during the progressive collapse process. When the trigger is positioned near a natural buckling initiation region, the folding sequence can temporarily change, leading to a small fluctuation in energy absorption. The observed variation is less than 1 kJ, accounting for only about 3%–6% of the total range, and is typical in nonlinear large-deformation behaviour. Such minor fluctuations result from local stress redistribution and evolving crush patterns and do not indicate any abnormal structural response. Overall, the increasing trend of energy absorption with trigger height remains clear and reasonable. Figure 10(d) uses the same method to identify the best impact initiators for LMS2 under dynamic analysis. In this case, impact initiators at 130 mm are determined to be the best for LMS2.
In conclusion, the location of the impact initiators significantly affects both the energy absorption and initial peak force Furthermore, it can be observed from Figures 9(f) and 10(c) that the influence of impact initiators on energy absorption is more pronounced under high-speed impact conditions compared to low-speed scenarios. Specifically, the difference between the maximum and minimum energy absorption (EA) values at low speed is less than 1 kJ (Figure 9(f)), whereas under high-speed conditions, this difference exceeds 3 kJ (Figure 10(c)). This disparity arises because, at low impact speeds, energy is primarily absorbed through plastic deformation, allowing the structure sufficient time to undergo relatively uniform deformation. As a result, the influence of the initiator is limited. In contrast, under high-speed impacts, the structure has less time to redistribute internal forces, making the location and presence of the impact initiator significantly more critical to the deformation mode and energy absorption behaviour. Further studies are needed to better understand the relationship between the position of impact initiators and the energy absorption capabilities of crash box.
Effect of different number of unit cells
The crashworthiness of crash boxes with varying numbers of unit cells is investigated. Several crash boxes with 4, 5, 6, and 7 concave tube structures—referred to as LSM-4cells, LSM-5cells, LSM-6cells, and LSM-7cells—are designed, as shown in Figure 11. These crash boxes maintain overall dimensions similar to LMS2, and the edge lengths of their unit cells are scaled down by factors of 1, 0.75, 0.67, and 0.67, respectively. Consequently, the impact initiators are also scaled accordingly. The thickness of each crash box is 0.5 mm, and the height remains 150 mm, consistent with LMS2. The basis of selecting this scale is to keep the dimensions of these crash boxes into a typical crash box’s size.28,36 The height of all the crash boxes is 150 mm, the range of length for crash boxes is between 124.7 and 155.9 mm. The range of width for crash boxes is 94.5–126 mm. And the thickness of all the crash boxes is all the same (0.5 mm). Variable uniformity is achieved through engineering consistency by applying four types of scaling to constrain each parameter within its feasible physical range.
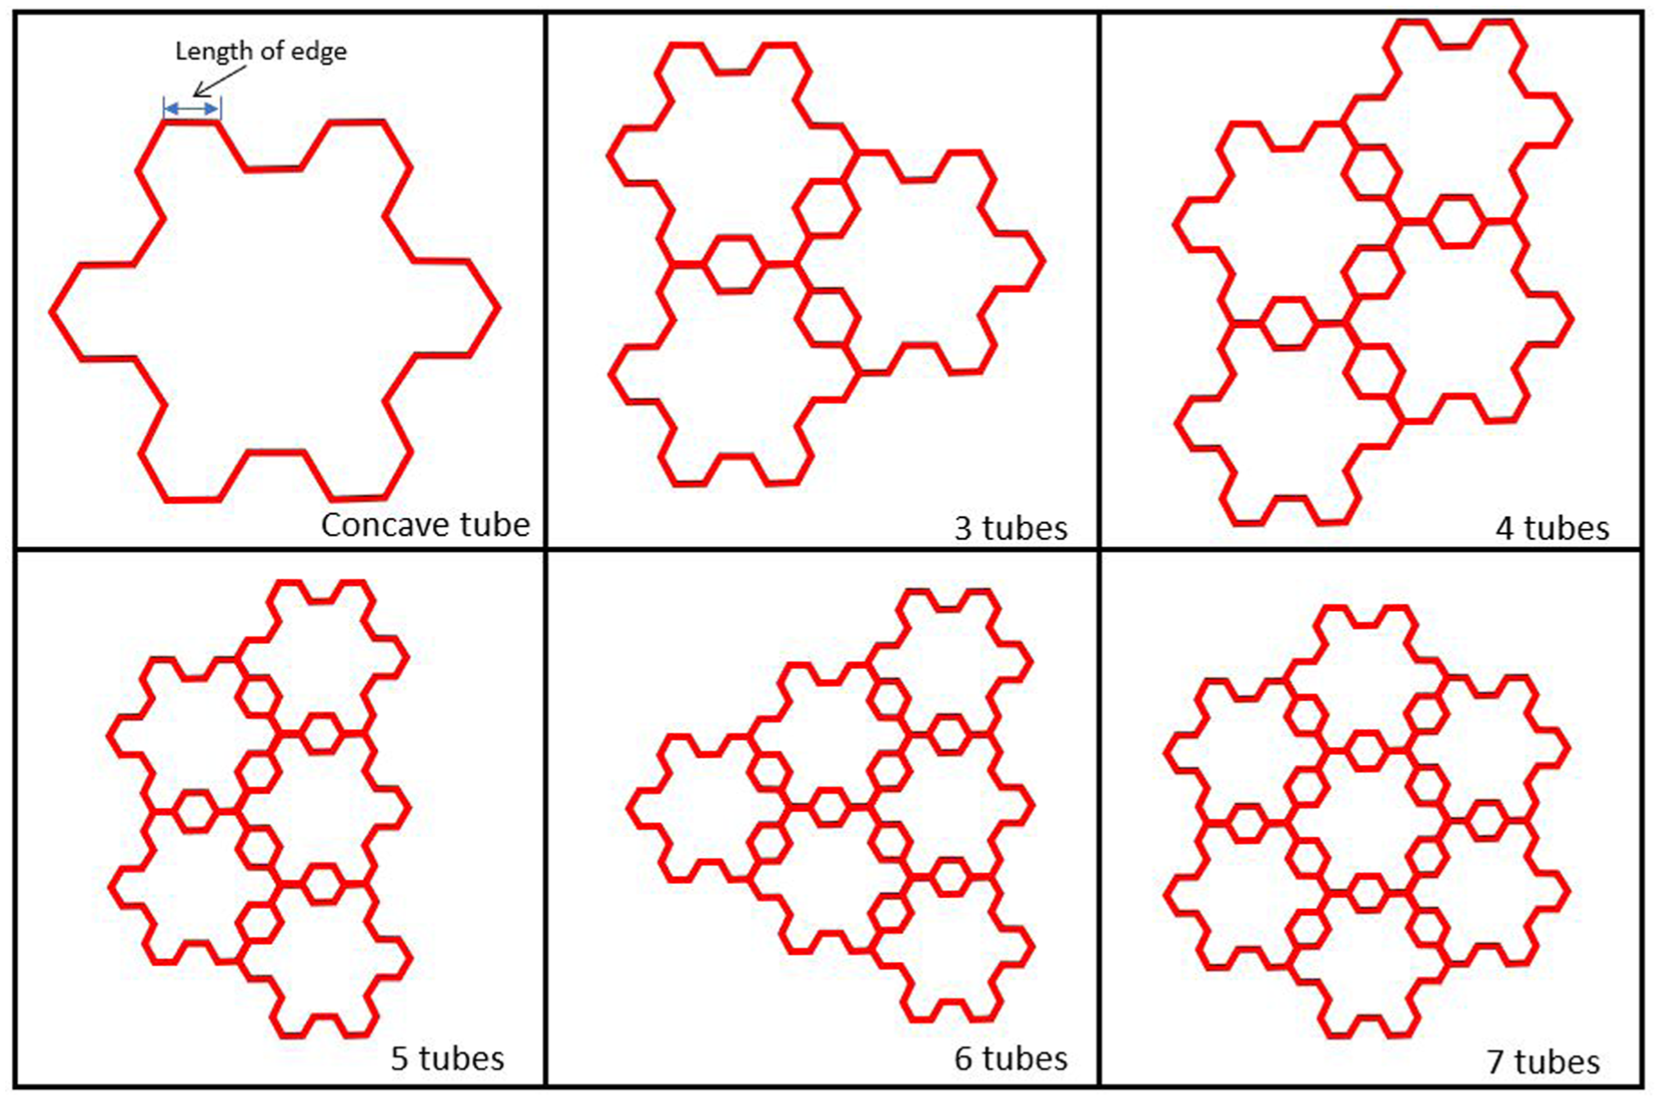
The crash boxes with different number of concave tube structures.
Due to these modifications in the structural design and parameters, the deformation process of the crash boxes in this section differs from that of LMS2-0.5 mm. When the scaling factor is less than 1, the impact initiators fail to effectively guide the crumpling process, causing deformation to happen at the middle of the tubes instead (Figure 12(a)). This indicates that new impact initiator need to be designed to guide LSM-5cells, LSM-6cells, and LSM-7cells.
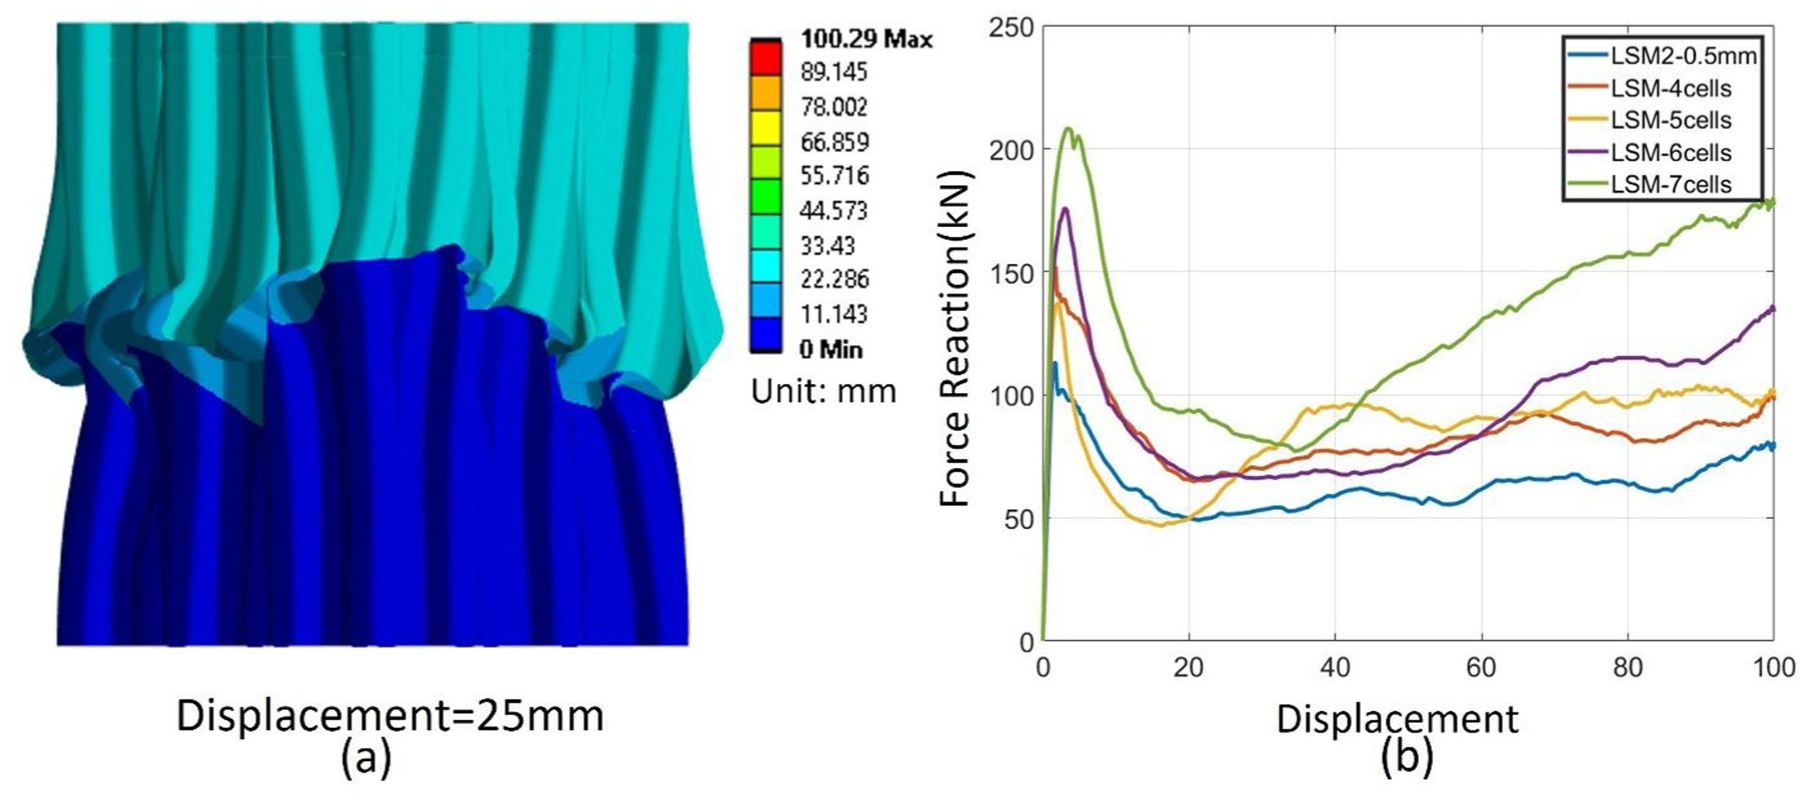
(a) The deformation result of the LMS-6cells crash box at 25 mm displacements and (b) the quasi-static analysis of the force with displacement for LMS2-0.5 mm and crash box with different number of concave tube structures.
Additionally, we compare the quasi-static force-displacement responses of these crash boxes, as illustrated in Figure 12(b). A comparison of the results indicates that both the Initial Peak Force (IPF) and Energy Absorption (EA) increase with the number of unit cells. Accordingly, the LSM-7cells configuration exhibits the highest IPF and EA values, while the LSM2-0.5 mm structure shows the lowest. This trend can be attributed to the improved load distribution provided by the multi-cell design, which allows the external impact force to be effectively shared among a greater number of structural units. As more unit cells undergo yielding simultaneously, the total IPF is enhanced. Furthermore, although the overall external dimensions remain constant, increasing the number of unit cells results in a greater proportion of the internal structure participating in plastic deformation. This leads to improved energy absorption efficiency per unit area, thereby enhancing the EA.
Conclusion
In this paper, a lightweight crash box with lattice metamaterials has been proposed. The design process for LMS1 and LMS2 is detailed, focusing on reducing the mass of the crash box while maintaining its energy absorption capacity. Additionally, the potential of using metal 3D printing technology for automatic fabrication is considered. LMS1 was modified to LMS2 to meet 3D printing manufacturing constraints, using materials suitable for metal 3D printing.
The numerical method used is validated to demonstrate its reliability by comparing it with other methods using the same model and parameters. The crash performance of LMS2 with two different thicknesses is analysed under quasi-static conditions to ensure accuracy. Furthermore, the crashworthiness of LMS2 with two different thicknesses is compared with a commercial crash box under both quasi-static and dynamic conditions to assess its practical feasibility.
The results show that EA of LMS2-0.6 mm is comparable to that of the commercial crash box, while SEA of LMS2-0.6 mm is higher, indicating that LMS2-0.6 mm maintains similar energy absorption with significantly reduced mass.
Furthermore, the effect of impact initiators on the crashworthiness of LMS2 is explored. These triggers affect the performance of LMS2, and a preliminary method is proposed to select the best triggers for LMS2, considering both EA and SEA equally. Finally, how the number of concave structures effect the crashworthiness of the crash box is investigated.
In summary, a lightweight crash box composed by lattice metamaterials has been designed, maintaining energy absorption capabilities comparable to commercial crash boxes. This design can be automatically manufactured using 3D printing technology.
Footnotes
Acknowledgements
The authors sincerely acknowledge this financial support, which enabled the development of advanced methodologies.
Funding
The authors disclosed receipt of the following financial support for the research, authorship, and/or publication of this article: This research was supported by Innovate UK through grant TSB Application Number: 10081046, titled “A digital framework for the design and additive manufacturing of lattice metamaterial structures.”
Declaration of conflicting interests
The authors declared no potential conflicts of interest with respect to the research, authorship, and/or publication of this article.