
Abstract
This article aims to study the mechanical behavior of a deep excavation occurring in sandy soils retained by anchored pile walls under anchorage failure conditions. The primary causes and types of anchorage failures are summarized. Based on an excavation case history, a numerical investigation is conducted using a PLAXIS-based finite element method to reveal the crucial mechanical behaviors of the retaining structure and soil layers as a result of different types of anchorage failures. According to the simulation results, the responses to anchorage failures are analyzed, and the safety coefficient for the retaining structure is presented. The analysis for this numerical work indicates that dangerous failure positions appear at the top of the pile wall or in the region near the excavation bottom. Then, a three-dimensional numerical model is established to analyze the mechanical behaviors and the influence scopes of the retaining structure caused by individual anchor failures. Special emphasis is placed on the analysis of the bending moments and horizontal displacements in the wall, as well as on the prestress and internal forces in each of the row anchors, displacements, and plastic strains in the ground and stabilities of the deep excavation. Conclusions obtained from the numerical study can provide guidelines for good practices in the construction of anchored pile wall-retained excavations in sandy soil.
Introduction
The construction of high-rise buildings in urban districts employs deep excavations frequently to overcome the problems of settlement and bearing capacity. 1 For deep excavations, a retaining wall with anchored tiebacks is a common technique of support systems that can be constructed using cast-in-place or precast bored piles, sheet piles, or diaphragm walls. 2 This technique first appeared in the 1950s 3 and has been developed and used in the past 70 years not only for deep excavations but also for embankment reinforcement, slope stabilization, seismic retrofit, and port constructions.4–6 A tieback anchor system offers significant economic and time advantages during the excavation of a large area. 7 However, despite an increasing number of tieback anchors being used in geotechnical engineering, the issues regarding the long-term reliability and performance of anchors have not been resolved. 8 Due to construction quality, design issues, ground characterization, water conditions, and so on, tieback anchor failures occurred occasionally, which can reduce the stability and security of the reinforced construction and even cause slope instability and excavation collapse. Therefore, a deeper understanding of the influence of anchorage failure is required to mitigate losses and future failures. 9
Since the 1970s, the behavior and failure of rod or strand tendon ground anchors have been extensively investigated.10–15 A worldwide investigation was carried out by the working group under the International Federation for Prestressing (FIP—Fédération Internationale de la Précontrainte), 16 in which 35 case histories of ground anchor failures were collected. Other related efforts are described by Littlejohn 17 and Weerasinghe and Littlejohn, 18 Parry-Davies and Knottenbelt, 19 and Barley. 20 It may be noted that most of the investigations are limited to the corrosion process and mechanical performance degradation during progressive deterioration. The serviceability and mechanical property of the tieback anchor system after anchorage failure are rarely reported. The studies on the anchorage failures of tieback anchor systems have focused on slopes in the early period. Lee et al. 21 conducted a comprehensive failure analysis on a failure case history of a slope reinforced by ground anchors. Li et al. 22 proposed the failure mechanisms of a slope reinforced by anchor cables, and a numerical investigation was presented to find the influence of the anchorage failure on the stability of the slope. In recent years, research focuses have transformed to tieback anchor systems, which support the excavations, because of the requirement of underground constructions in cities. Based on a failure case of an excavation supported by tieback anchored pile walls, Jeong et al. 23 compared an elastoplastic method and shear strength reduction method and found that a coupled analysis using the latter method is more effective for analyzing the critical surface. Itoh et al. 24 executed centrifuge model tests using an in-flight excavator and concluded that the active and passive earth pressure on the wall increases during excavation, demonstrating the failure characteristics and mechanisms of the tieback anchor failures. Prat 25 performed a series of numerical investigations on the failure of a two-row tieback pile wall, concluding that the strength parameters of the ground influence the shape and position of the slip surface. Although some conclusions were obtained from the available literature, the mechanical behaviors of excavations and the entire retaining structures after anchorage failure have not been investigated and require further studies. A satisfactory work to address these issues requires a sufficient knowledge of the geometric, hydrologic, and geologic characteristics of the ground, as well as the material properties of the supporting structures.
In this article, the common anchorage failure types and failure mechanisms, including individual anchor failure and anchor group failure, were analyzed systematically. According to a case excavation supported by a tieback anchored pile wall, a series of numerical models were established using a finite element method (FEM) to analyze the mechanical characteristics and deformation responses of the tieback anchor system influenced by the anchor failure position. The safety factor and stability of the deep excavation under each failure condition were studied using the strength reduction method. This study provides information that is useful in the design and construction of deep excavations supported by anchored pile walls.
Project background
Location and geological data
The constructed deep excavation is adjacent to Youth Street, an arterial road in Shenyang, China. This excavation has an irregular, rectangle shape (see Figure 1) with a total area of approximately 33,500 m2. As shown in Figure 1, many existing buildings are located adjacent to the west and south sides of the excavation, and the minimum distance away from the deep excavation edge is 22.8 m. The construction site is divided into two approximate rectangle areas, Area A and Area B, which have different designs for the retaining structure. Area A and Area B are rectangular, at 218 m × 140 m and 55 m × 40 m, respectively, and the average excavation depths are 23.1 and 14.9 m, respectively. The movements of the pile wall and the ground and the axial forces of the tieback anchors were monitored during construction using standard monitoring devices. Figure 1 displays the monitoring points for deep excavation, including inclinometers inside the pile wall, force sensors in the tieback anchors, and horizontal deformation monitoring points for the cap beams. Settlement monitoring points were set at the west and east sides of the deep excavation, with seven points per group.
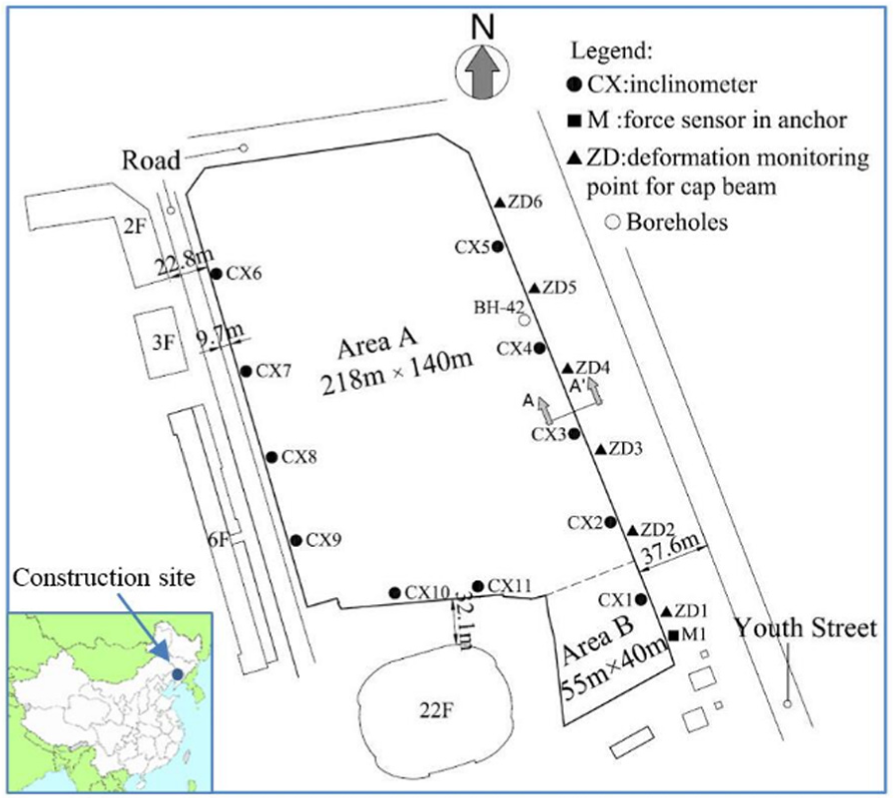
Plan and location of deep excavation. Section AA′ is shown in Figure 2.
The deep excavation is in the alluvial layer underneath the city of Shenyang, which mainly consists of medium-coarse sand and gravelly sand with a little clay. The soils in Shenyang include a Quaternary Holocene artificial filling soil layer, a Quaternary Holocene Hun River floodplain and paleocurrent shock layer, and a Quaternary Hun River rushed diluvium from top to bottom that changes from a middle dense state to dense state. 26 Based on an investigation of the site in which 90 boreholes were drilled, the profile of the construction site could be divided into five layers. Figure 2 displays the subsurface profile of one borehole (BH-42) in the excavation construction site. The mechanical parameters of soils in the construction site are shown in Table 1. In order to obtain the strength parameters of sandy soils, a series of heavy dynamic cone penetration test (CPT) were performed. The cohesions (c) and friction angles (φ) of sandy soils were obtained according to the recommended relationship between the strength parameter and CPT-N value from DB21/T 907-2015 code. For Shenyang sandy soil, the c is negligible. But for the FEM program PLAXIS, 27 c = 0 may cause some options performing hardly, even calculation non-convergence. Therefore, the cohesions of sandy soils (Soil #2 to Soil #5) are assumed to be 1 kPa in the numerical analysis. The strength parameters of filled soil were obtained directly from direct shear tests.

Profile of anchored pile wall (AA′ in Figure 1) and subsurface soils.
Mechanical parameters of soils.

E s means confined compression modulus; SPT-N value means Standard Penetration Test value; fak means characteristic value of soil bearing capacity.
The groundwater level in site changes from 6.4 m to 8.3 m, approximately. Considering the high permeability coefficients of sandy soils, well-point dewatering method was employed for the excavation case.
Design of the retaining structure
The deep excavation was supported by a tieback anchored pile wall (see Figure 2). The deeper and larger excavation (Area A) was chosen to be studied in this article since it has complex mechanical characteristics. The pile wall consisted of reinforced bored piles that were 0.6 m in diameter, 27 m in length, and 1.1 m in pile spacing. To stiffen the wall, a reinforced concrete cap beam was constructed, joining the heads of the bored piles, and it had a rectangular cross section of 0.5 m × 0.8 m. The pile wall was reinforced by tieback anchors with seven rows consisting of four strands with a design inclination of 15° to the horizontal in a 0.15 m diameter drilling hole. According to National Bureau of Standards (NBS) (GB/T 5224-2003), 28 each strand has a total cross-sectional area of 1.4 × 10⁻⁴ m2 with a nominal diameter of 15.2 mm, consisting of seven wires with 5 mm in diameter and 1860 MPa in strength. The vertical spacing of tieback anchors was 3 m. The horizontal spacing of tieback anchors was 2.2 m for rows 2 and 3 and 1.1 m for other rows. The free length and fixed length of the anchors are shown in Figure 2.
Mechanism analysis of anchor system failure
Influential factors
It is quite common for the prestressed anchors to be used in permanent works, such as slope reinforcement, dam supporting, and offshore engineering. However, the anchor system is mostly used as a temporary structure for support during deep excavations. With the construction period of deep excavations increasing, the reliability and durability of anchors will play an important role in the long-term stability of the project. Hence, the factors influencing the long-term performance of anchor systems should be considered in the design to satisfy the safety requirements and reduce the risk of failure during the construction of projects.
Tendon corrosion
The problems of prestress losses and anchorage failures are commonly caused by steel bar or strand tendon corrosion (see Figure 3). The tendon materials of anchors are primarily metals with high strength and stiffness, which are quite sensitive to the surrounding environment because of a high tensile stress state and long-term burial underground. For the free length in particular, failures occurred due to factors such as interspaces between tendon and grout, tendon over-stressing, inadequate or no cement grout cover in an aggressive environment, and inappropriate choices of protective measurements. Tendon corrosion could cause both cross section losses and internal force increases, even leading to fracture damage of the tendon.
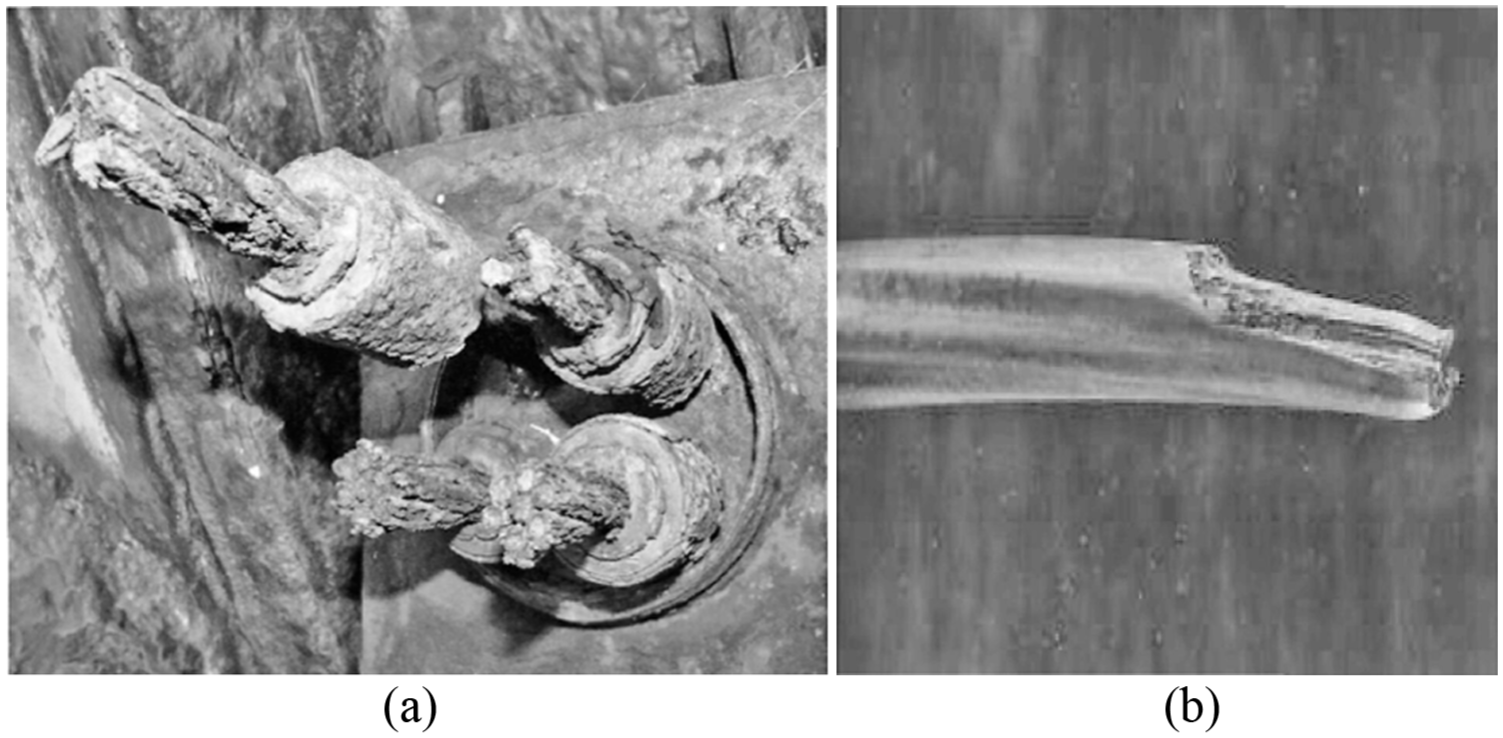
Corrosions of anchor tendons: (a) tendon corrosion, (b) tendon damage.
Construction quality
Construction quality is another important factor that greatly influences the long-term performances of anchors. During construction, improper construction quality management and operation, limits of construction team capacity, inferior or inadequate cement grout, and so on will influence the construction quality. Missing and improper installation of anchorage clips and nonuniform tension of tendons can cause a nonuniform force in the tendon easily. The grouting quality in the anchor hole will influence the mechanical performance of the cement grout, which bears high stress. Furthermore, it is not hard to see that the tendons are tensioned even when the grout does not reach the design strength in order to shorten the construction period. Slippage may occur at two interfaces, the grout–tendon interface and the grout–soil interface, because of inferior grouting quality, which leads to anchor system failures. 29
Adverse geology
The anchorage performances of anchors will be influenced significantly by the weak soils, such as the soft clay and silty soil. For example, if anchors are installed in soft clay due to inaccurate field investigation, the anchorage capacity of anchors will be reduced. Moreover, the creep characters of soft soils can accelerate the prestress losing. If the corrosion protection is inadequate or broken, particularly for anchors in corrosive zones, the service life of the anchor system will be reduced. It is common that excavation surroundings degenerate, and this degeneration was caused by sewage pipeline leakage in the case histories.
In addition, as a result of not being in time or unqualified concrete reinforcement between piles, the soils behind the pile walls may be lost, leading to looseness of the soils. The movement of the ground can decrease the prestress of the anchors.
Failure mechanism analysis
According to the description of the influence factors of anchor system failures and the anchorage failure case histories, individual anchor failures consist of four modes: bonding failure, tendon corrosion failure, prestress loss progressive failure, and mixed failure. Slippage taking place at two interfaces can lead to the contraction deformation of an anchor tendon, which causes prestress loss. This type of failure mode is called bonding failure, which is primarily due to the capacity limit of two interfaces (the grout–tendon interface and grout–soil interface). Tendon corrosion failure occurs due to defects of tendons and long-term corrosion of the surroundings. The loss of the wire diameter increases the average stress of the tendon and causes local stress concentration, which leads to tendon corrosion failures in a long-term service. In an example in Hong Kong, on-site delays between the completion of stressing and encasement of the anchor head exposed the tendon to a humid and slightly saline atmosphere and caused up to 2.7% and 12% loss of wire diameter after delays of up to 8 and 36 months, respectively. 30 Prestress loss progressive failure means that failure is caused by a significant loss of prestress for the anchor system in a long-term service. The loss of prestress of the anchors is due to various causes, including inadequate strength of the reaction force structures, such as bearing plates and steel wales, the creep of soils, and grout defects.
After individual anchor failure, constraint provided by the failure anchor disappears, and the disequilibrium load is undertaken by adjacent anchors. Usually, individual anchor failure cannot cause excessive deformation of the retaining structures and instability of the deep excavation, and the effects of anchorage failure cannot be observed easily. However, due to individual anchor failure, tension stresses of the surrounding anchors increase, which causes over-stress of anchorage structures and accelerates anchor failures, finally leading to a partial anchor group failure. If individual anchor failures are not repaired in time, partial anchor group failures occur and change, gradually worsening. Compared with individual anchor failures, partial anchor group failures have more a significant influence on the stability of a deep excavation, with the phenomena of bulging deformation of anchored structures, local settlement of the ground, and even partial collapse of excavations.
Another type of anchor group failure is called the anchor row failure, which means the failure of multiple anchors in one row or the same rows. This type of anchor group failure is usually caused when anchors in the same row encounter similar geological conditions or disqualification of the construction quality. The evolutionary process and deterioration process of the anchor row failure change quickly, showing accelerating trends. Once anchor row failure occurs, the essential reinforcement measures cannot be carried out immediately, and the security of the excavations and surroundings cannot be ensured. In this article, the anchor row failure was studied and analyzed in detail to provide a good guideline on the theory and design of deep excavations.
Numerical model
During the excavation of soils in a deep excavation, the stresses and deformations of both retaining structures and soils are quite complex. Hence, two-dimensional plane strain numerical models have been carried out with a FEM-based, nonlinear program known as PLAXIS, which is good at simulation of the construction sequence, considering the interaction of structures and soils. Area A was selected to be analyzed, and its numerical model is shown in Figure 4. Considering the symmetry in the deformation, only half of the deep excavation geometry was modeled in the analysis. The size of the model was 45 m × 120 m. The center of the excavation was set as the left boundary, and the right boundary was set at three times the average excavation depth away from the pile wall. The 45-m thickness of the soil represented the total thickness of the soil layers. Horizontal movement was restrained for the left and right boundaries. All movements were restrained for the bottom boundary. All movements were allowed for the top boundary.
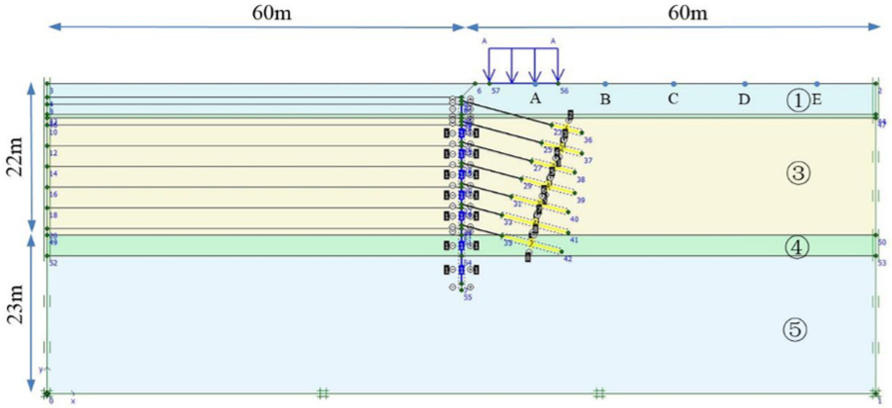
Profile of numerical model.
Figure 5 shows the mesh of the numerical model. Two-dimensional plane strain triangular mesh elements with 15 displacement nodes were used for the soil body in this analysis. The 15-node triangle mesh element provides a fourth-order interpolation for displacements and the numerical integration involves 12 stress points. The position of mesh nodes and stress points of 15-node triangle mesh element are illustrated in Figure 6. All soil layers were modeled with the hardening soil (HS) model, which considers the shear and compression stiffness. The HS model is an advanced soil model for different soil behaviors based on the Mohr–Coulomb failure criterion, which adopts a hyperbolic stress–strain representation for the soils, as proposed by Duncan and Chang.
31
The HS model implements 11 parameters, including strength parameters, stiffness parameters, and advanced parameters, which were obtained from triaxial and consolidation tests. The stiffness parameters in the HS model consist of three stress-dependent stiffness parameters,
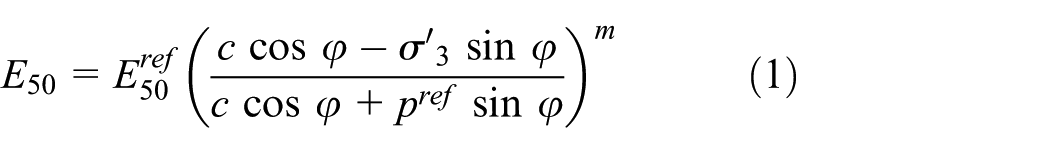
where

Mesh of numerical model.

(a) Mesh nodes and (b) stress points of 15-node triangle mesh element.
Based on the back analysis,
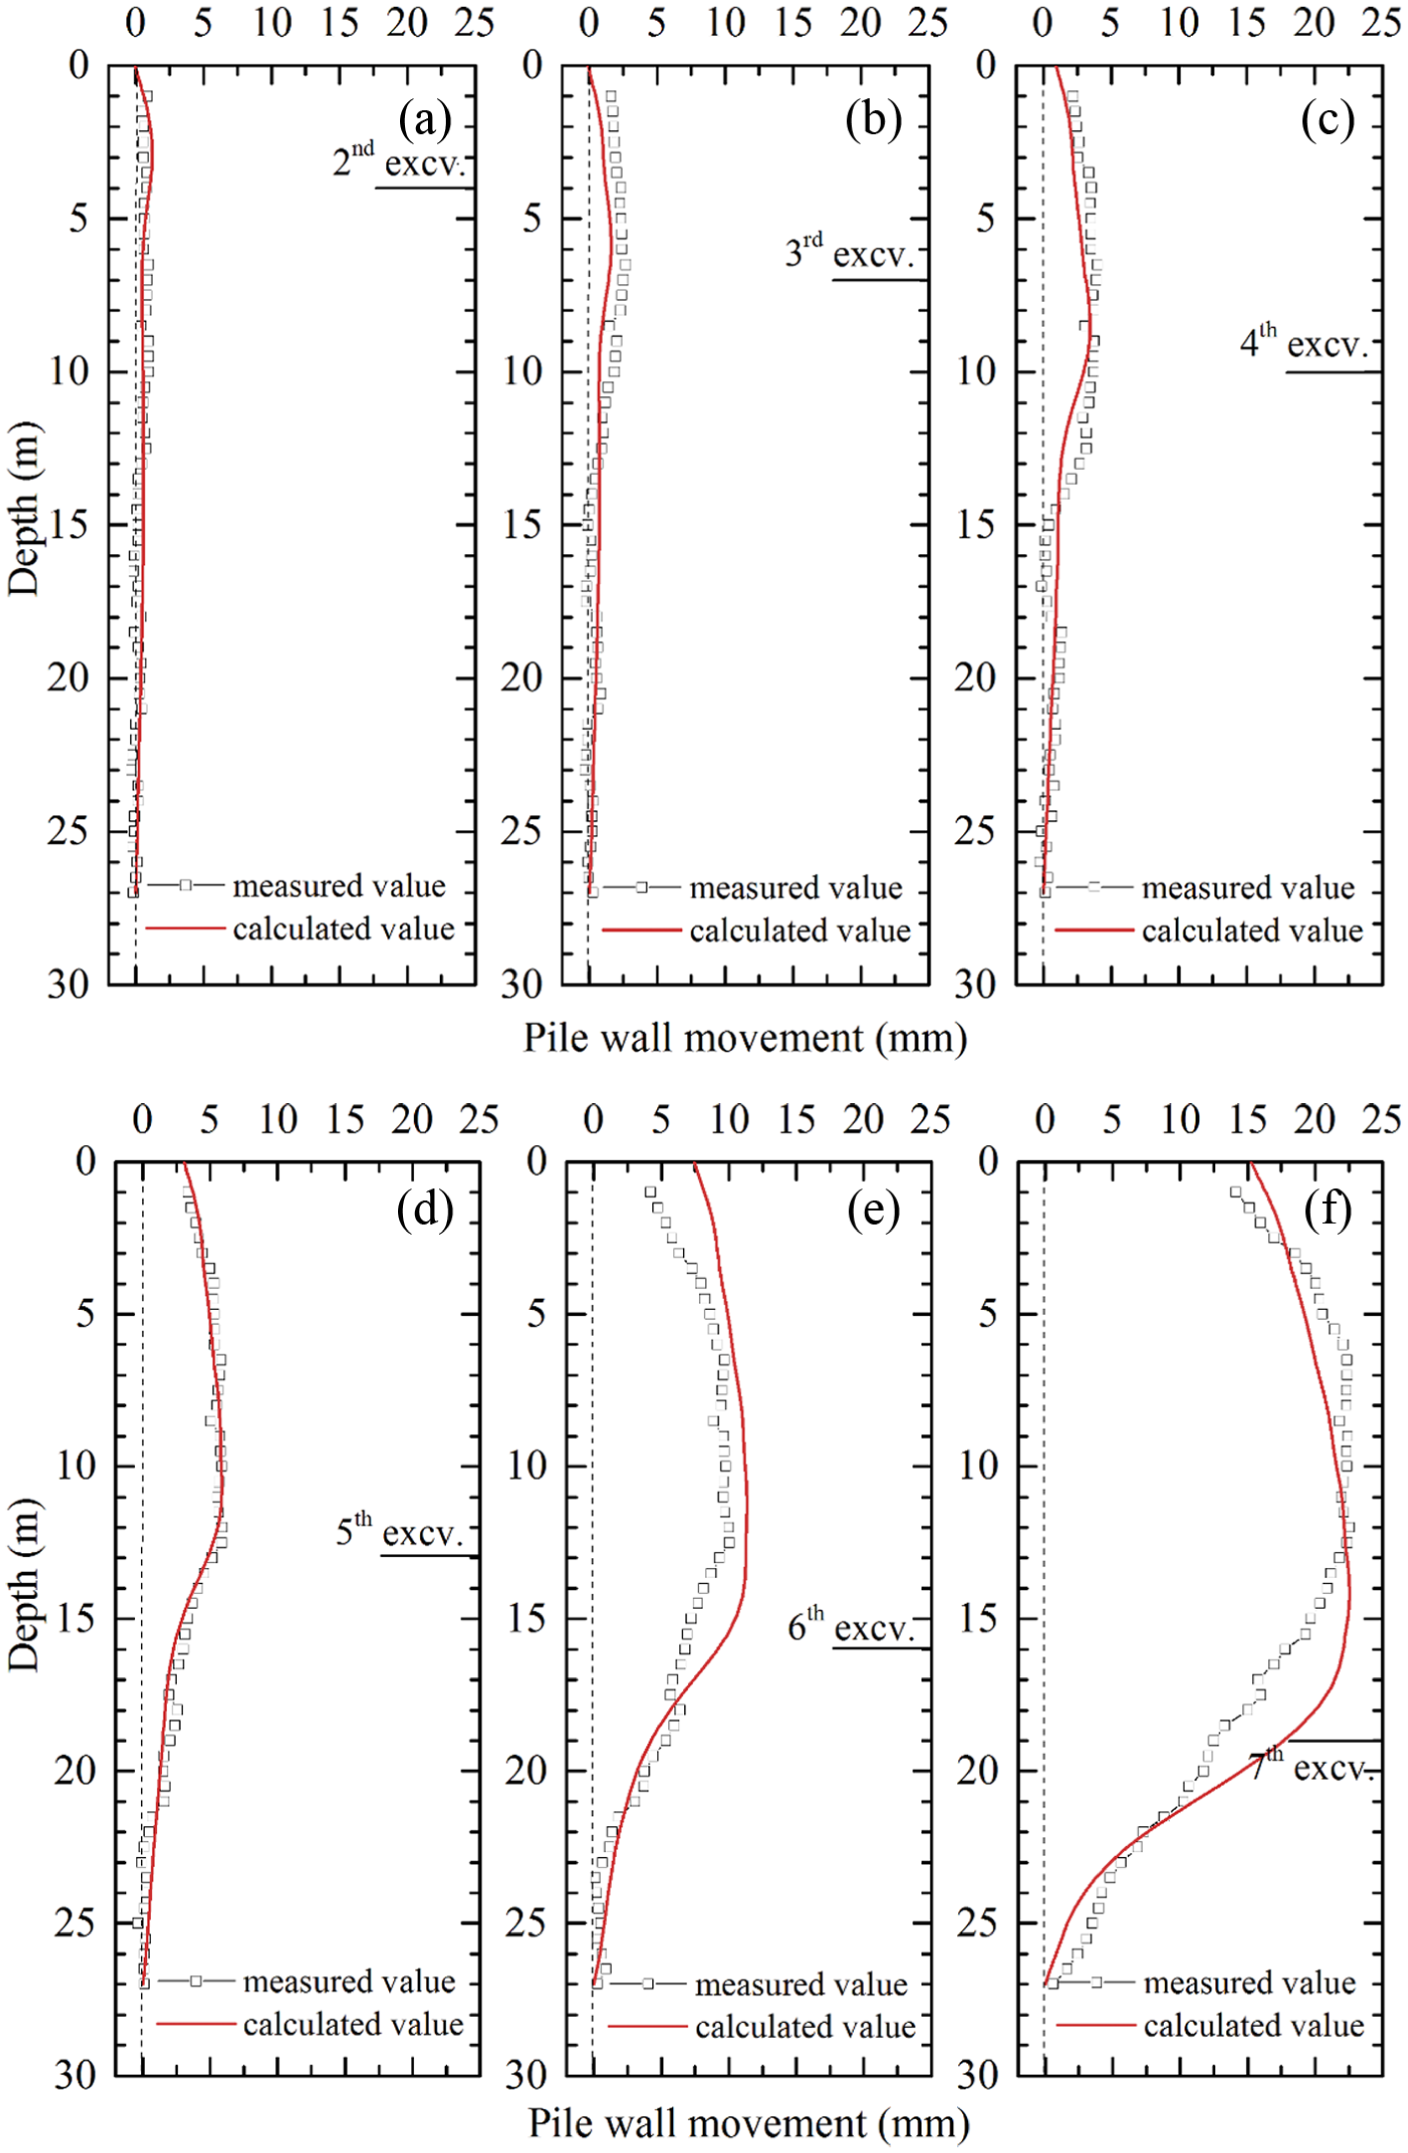
Comparison between observed and calculated pile wall movements: (a) The 2nd excavation, (b) The 3rd excavation, (c) The 4th excavation, (d) The 5th excavation, (e) The 6th excavation, (f) The 7th excavation.

Comparison between observed and calculated ground settlement.
Based on the above comparisons, the accuracy of the finite element model in predicting the excavation behavior, such as the deformation of the pile and surrounding soils, was verified. For the pile wall, lateral force is the main load acting on the pile wall. The non-volume, linear elastic plate elements, which can provide bending resistance, were used to simulate the behavior of the pile wall. The mechanical parameters of the piles were replaced by those of a diaphragm wall according to the equivalent of lateral stiffness. The equivalent wall had a thickness of 0.4 m and a length of 27 m, with E = 30 GPa and ν = 0.2. The zero-thickness interface element was set to simulate the soil–wall interaction. The interface element stiffness parameters were in the range of 0.6–0.7, according to the in situ tests, to simulate the separation and slippage behavior of the soil–wall interaction. The tieback anchors were numbered as L1–L7 from top to bottom, of which the free length and the fixed length were modeled by an anchor element and geogrid element, respectively. A Young’s modulus of E = 210 GPa was chosen for the tieback anchors. To compare with the observed values, the measured axial forces of the tieback anchors were as references for the prestress of the anchors in the numerical model. The initial prestress values of the tieback anchors in each row were set as follows: L1 = 120 kN, L2 = 200 kN, L3 = 180 kN, L4 = 203 kN, L5 = 225 kN, L6 = 224 kN, and L7 = 102 kN.
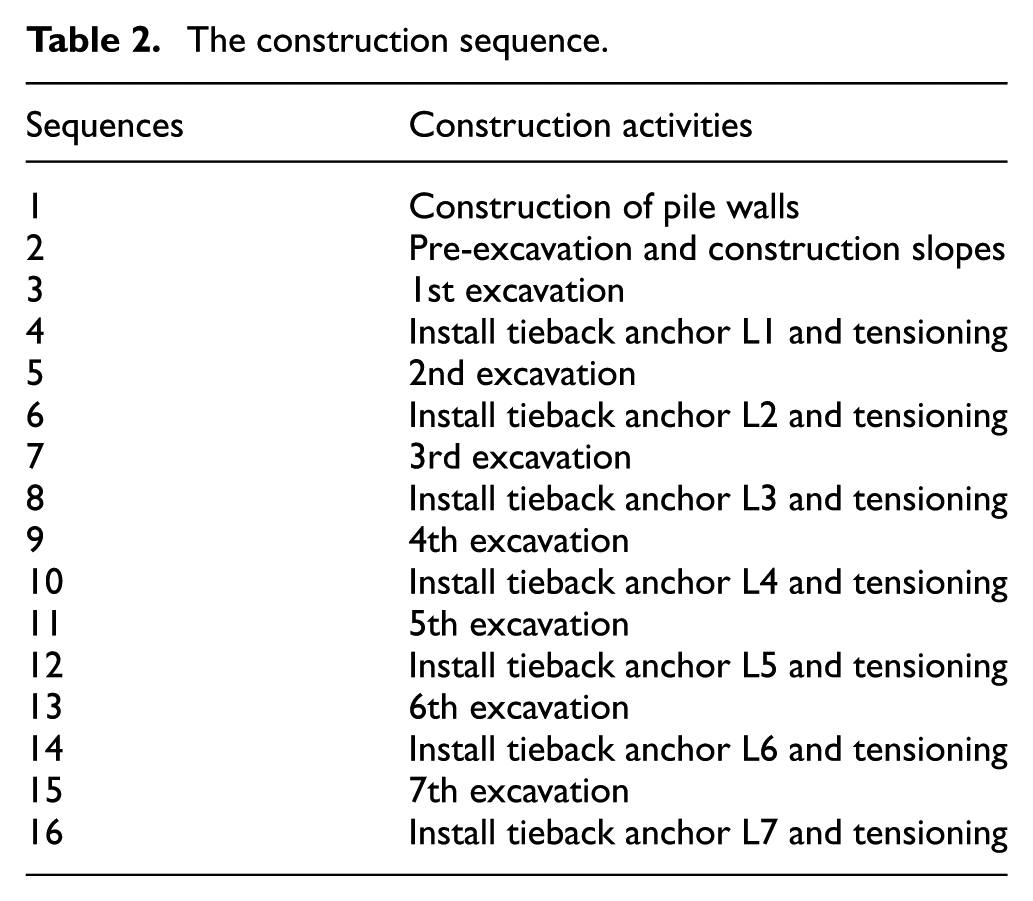
The construction sequences adopted in the deep excavation are presented in Table 2. A construction load of q = 20 kPa was applied to the ground surface in the region of 2–10 m far from the pile wall. The anchorage failures were simulated by deactivating the free lengths of anchors, and the fixed lengths of anchors were still activated after anchorage failure. Hence, after reaching the design excavation depth, one or some adjacent tieback anchors were deactivated to simulate the anchor row failure in the numerical investigation.
The construction sequence.
Analysis results
Deformation and the internal force of the pile wall
In a tieback anchored pile wall support system, the pile wall is the crucial structure that connects the overall anchors and increases the integrity of the support system. After anchorage failures occur, the stress and deformation on the pile wall will increase immediately, resulting in a lack of safety in the excavation.
Figures 9 and 10 present horizontal pile wall deformation based on the cases of one-row and two-row anchorage failures, respectively. As shown in Figures 9 and 10, compared with the cases of one-row anchorage failure, the pile wall deformation increments and scopes of influence are relatively large in the cases of the two-row anchorage failure. For one-row anchorage failures, the maximum deformation increments of the pile wall were all located at the failure position, with values of 2.7–5.0 mm. Moreover, as the depth of the failure position increased, the scopes of influence increased gradually. For the two-row anchorage failures, the scopes of influence were much larger than those of the one-row anchorage failures. The maximum deformations and deformation increments were both located between two failed anchors, except for the case of the L1L2 failure, where the maximum deformation occurred at the top of pile wall.

Horizontal pile wall deformation of one-row anchorage failure.

Horizontal pile wall deformation of two-row anchorage failure.
To distinguish the different failure cases, one-row anchorage failures, L1–L7, were defined as Cases 1–7, and two-row anchorage failures, L1L2–L6L7, were defined as Cases 8–13, respectively. Case 0 was defined to represent the non-failure case when the construction was finished. Figure 11(a) shows the maximum horizontal deformation (δm) of the pile wall and the ratio to that in Case 0, and Figure 11(b) shows the maximum bending moment (Mm) and the ratio to that in Case 0. In the numerical model, the maximum horizontal deformation and the maximum bending moment of the pile wall in Case 0, i.e. δm0 and Mm0, were 26.1 mm and 153.5 kN·m, respectively.

The maximum (a) pile wall deformation and (b) bending moment in anchor group failure cases.
For one-row anchorage failures, the δm and Mm changed slightly for Cases 1–3, while the largest increment occurred in Case 6. The disequilibrium load transferred to the wall and adjacent tieback anchors immediately after the anchorage failure, resulting in increases in pile deformation and anchor axial force. The maximum deformation and stress of the pile wall occurred near the supporting position of L6, where the soil stress behind the wall was relatively high. Due to this situation, the deformation and stress of the pile wall in Case 6 have the largest increment. Figure 11 presents the ratio of δm/δm0 and Mm/Mm0 for Case 6, which are 1.19 and 1.24, respectively.
For two-row anchorage failures, the responses of the pile wall were similar to those of the one-row anchorage failure, but the scope and degree of the influence were relatively high. Figure 11 also shows the ratios of δm/δm0 and Mm/Mm0 for Case 12 (L5L6 failure), which are 1.65 and 1.63, respectively. It is worth noting that Case 8 (L1L2 failure) results in significant increment of deformation and bending moments. The main reason was that after the failure of the top two rows tieback anchors, the top part of the wall changed to be a cantilever structure with 6.5 m length. For Case 8, the values of δm/δm0 and Mm/Mm0 became 2.48 (from 26.1 to 64.7 mm) and 1.60 (from 153.5 to 245.6 kN m), respectively.
It is assumed that the increment ratio of the pile wall bending moment caused by the anchorage failure is I. The ratio of the pile wall bending moment when the reinforcement in the pile reaches the ultimate tensile strength to the design bending moment is the safety coefficient, Kd.37,38 If I > Kd, the pile will be damaged; conversely, the pile will keep working if I < Kd. Due to this situation, if the failure of a pile is dominated by its bending capacity, then the increment ratio I becomes one of the critical factors for determining whether the excavation collapse occurs under the condition of anchorage failure. Based on the numerical analysis above, the maximum value of I was 1.63 when Case 12 occurred. Taking this case history as an example, as a first grade deep excavation based on the classification of NBS (JGJ 120-2012), 39 the coefficient of structural importance γ0 and load comprehensive coefficient γF were set to be 1.1 and 1.25, respectively. The ratio of the ultimate tensile strength to the design tensile strength of the pile reinforcement (HRB400) was set as 1.5. Hence, the Kd was equal to 2.06. Based on the condition above, I < Kd, and therefore, the pile will not fail.
Mechanical behavior of tieback anchors
Figure 12 shows that the prestress of the tieback anchors changes with the construction of the excavation to various degrees. Figure 12 also shows that the prestress of the tieback anchors increases after each soil excavation stage, especially for anchors near the excavation bottom. The prestress increase during construction was the result of the deformation increment of the pile wall, which was caused by the decrease in the earth pressure before the pile wall surrounding the excavation bottom. In addition, the increments of the anchor prestress increased with the depth of excavation. This increase occurred because the lateral earth pressure increased, and a larger load and deformation on the pile wall occurred with the increase in excavation depth. After the last excavation stage was completed, the maximum prestress increment of the tieback anchors was 59.9 kN. When the tieback anchors were tensioned, a compression deformation of the wall and the soils occurred due to extrusion. The free length of the anchors adjacent to the tensioned one loosened, resulting in a decrease in the prestress of the anchors, with loss values of approximately 1.5–7 kN. As shown in Figure 12, the effect of the anchor tension on the adjacent anchor was significant, while that on the anchors of other rows was slight. Figure 13 illustrates the incremental displacement vector after L6 is tensioned. Figure 13 shows that the radius of the compressing zone caused by the anchor tensioned with a tensioning force of 224 kN is approximately 4 m. Thus, only the anchors adjacent to the tensioned anchor were influenced. The influence degree and influence scope had a great relationship to the stiffness parameters of soils and piles.

The prestress of tieback anchors under each construction sequence.
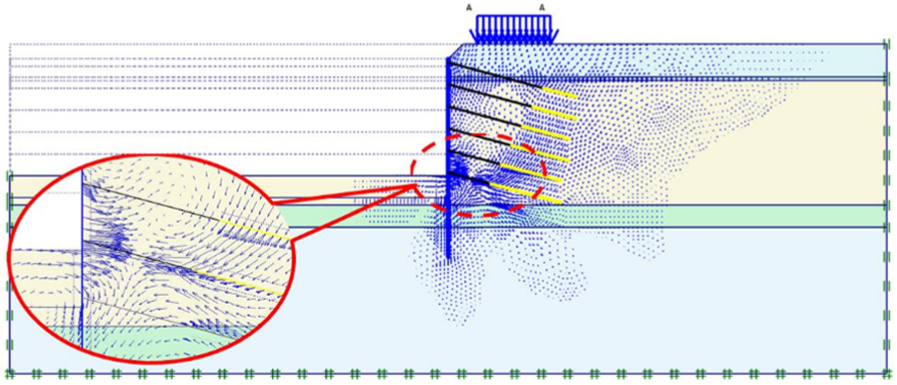
The incremental displacement vector in Step 14 (L6 installed and tensioned).
Figure 14 shows the prestress of the anchors M1 measured during the construction from L1 installed to third excavation completed. Due to L2 tensioned, the prestress of L1 decreased by 0.82 kN. In addition, due to L3 tensioned, the prestress of L2 and L1 decreased by 2.53 and 1.56 kN, respectively. As shown in Figure 12, the influence of the anchor tension of the lower row on the upper row anchors is similar to the results obtained from the numerical analysis. The measured prestress decreases were slightly less than the calculated ones because according to the tensioning sequence, the prestress values were measured while the lower anchors were not fully tensioned.
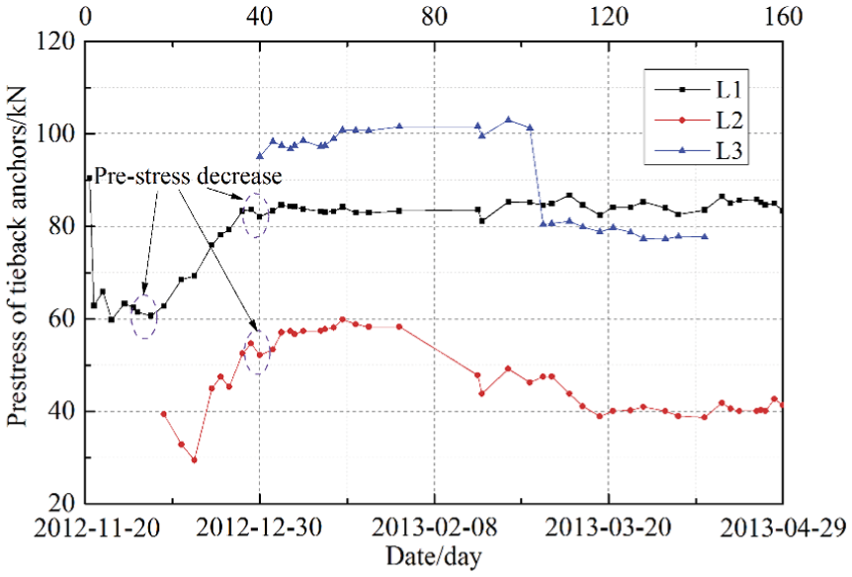
Measured prestress of tieback anchors (M1 in Figure 1).
After the tieback anchor failed, the load was transferred from the failed anchors to the adjacent anchors. The maximum prestress increment occurred on the anchors adjacent to the failure position, and the prestress increment declined nonlinearly with the increase in distance from the failure position (see Figure 15). Figure 16 shows the prestress increment of the upper and lower row anchors adjacent to the failed anchors. The prestress increment in the one-row anchorage failure cases and two-row anchorage failure cases showed the same responses. With the failure position going deeper, the prestress increment of the lower row anchors rose gradually. The maximum prestress increment of the lower row anchors occurred in Cases 5 and 12, for the one-row anchorage failure and two-row anchorage failure, respectively. The embedded depth of the pile wall and the stiffness of soils before the wall resulted in the partial load being transferred to the wall and soils; thus, the prestress increment of the lower row anchors in Case 6 was slightly less than that in Case 5. For the upper row anchors, the maximum prestress increment occurred in Cases 6 and 12, where the failure position was located around the depth of the maximum deformation of the wall. The maximum prestress increment caused by two-row anchorage failure was much larger than that caused by one-row anchorage failure, with values of 2.6 (lower row anchors) and 2.7 (upper row anchors) times of the latter.

The prestress increment of each anchor in various failure cases.

The prestress increment of adjacent anchors in various failure cases.
Partial anchorage failure caused the forces of the free length to increase and the axial forces of the fixed length to change significantly. Figure 17 shows the relationships between the axial forces of the fixed length and the distance from bottom of the free length in Case 0 and Case 12. Because the total fixed length bonded with the surrounding soils, the friction of the interface between the anchor tendon and soils had an influence on the distribution of the axial force. Figure 17 shows that the axial forces of the fixed length decline with the distance from the bottom of the free length, and that the maximum axial forces occur at the top of the fixed length. For Case 0, the axial forces declined slowly at the top part of the fixed length for L1–L4, while the decline slope rose suddenly and remained at a steady decline at the bottom part of fixed length, with a scope of approximately 2 m. The axial force of L7 in the fixed length deceased exponentially, which deceased to 0 at a distance of 2 m from the bottom of the free length.
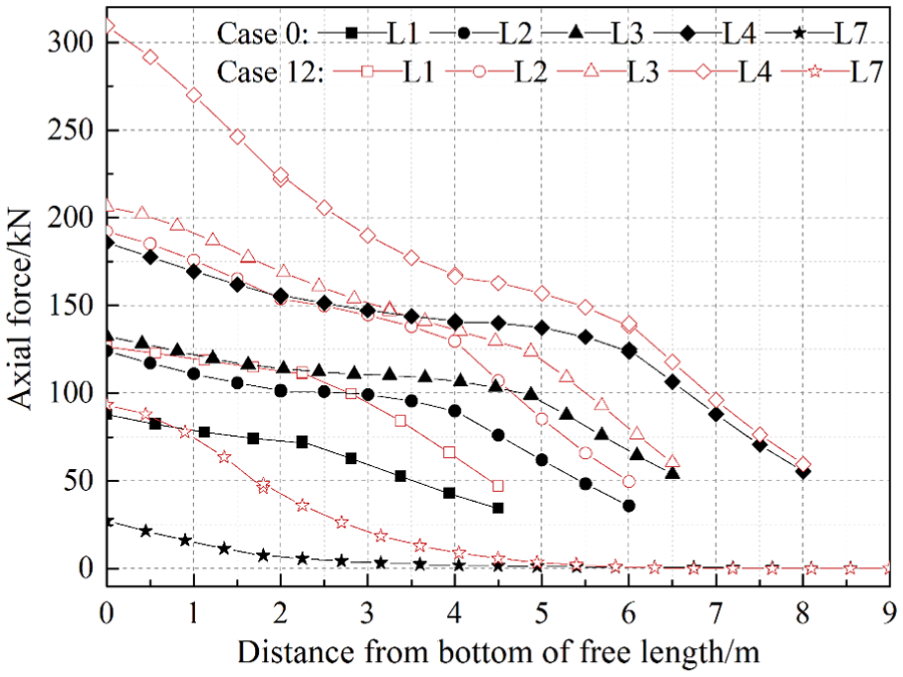
Axial forces of the fixed length.
The axial force of the fixed length presented an exponential distribution after the anchor was tensioned, and the stress concentration was obvious. With the soils excavated and the load increasing, the distribution of the axial force tended to be average, and the effective fixed length increased.
After the anchor failed, the axial force of the fixed length increased to a different degree. Moreover, the closer the anchors were to the failure position, the more significantly the anchors were influenced. The maximum force increment occurred at the bottom of the free length and tended toward zero as the distance increased. The influences of the one-row anchorage failure were less than those of the two-row anchorage failure. The fixed length behaviors in other cases were similar to those discussed above. Thus, the axial force changes of the remaining cases were not presented.
Soil behavior behind the pile wall
The anchorage failures resulted in the deformation of the pile wall, causing soil moment behind the pile wall. The uneven ground settlement will pose a risk to adjacent buildings and underground pipelines. Furthermore, excessive moment of soils may lead to soil collapse. Hence, it is necessary to study the behaviors of soils behind the pile wall in various anchorage failure conditions.
Figures 18 and 19 show the ground settlements in various anchorage failure cases. As shown in Figures 18 and 19, monitoring points A–E were set every 10 m to obtain the ground settlement behind the pile wall (see Figure 4). The maximum ground settlements in the one-row anchorage failure cases and two-row anchorage failure cases were 21.0 and 29.3 mm (except Case 8), respectively, which were 1.16 and 1.61 times that of Case 0. Compared with the one-row anchorage failure cases, the influence scopes of the two-row anchorage failure cases were slightly larger, with a value of 1.6He (He, the excavation depth). Due to the anchorage failure, the location of the maximum settlement point moved closer to the pile wall.
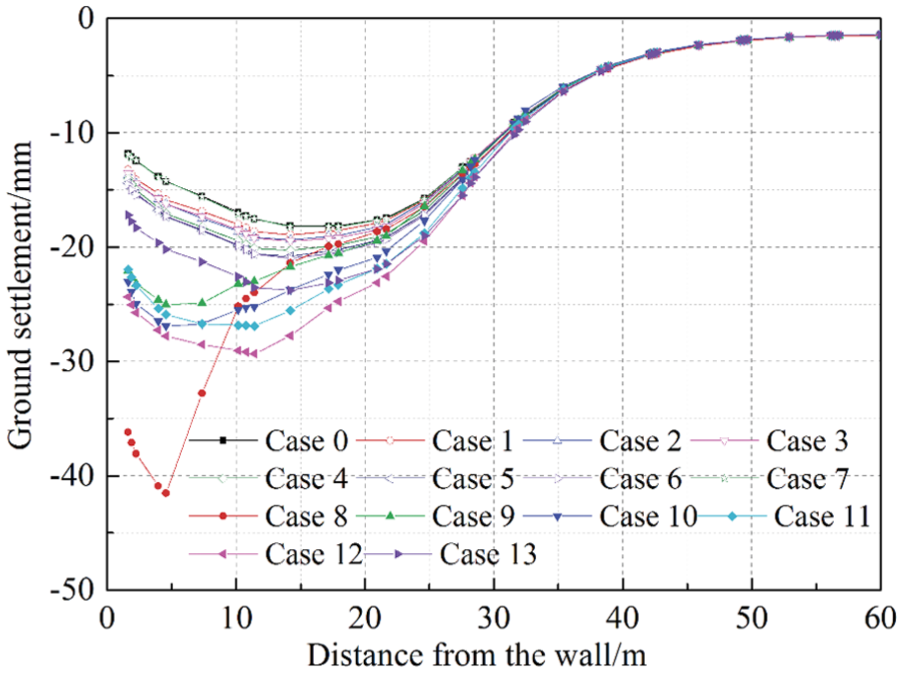
Ground surface settlement in various failure cases.

Ground surface settlement of monitoring points in the numerical investigation.
For Case 8, the failures of the top anchors led the pile wall to be a partial cantilever structure, so the ground settlement profile was similar to a triangular shape. The maximum ground settlement located near the wall had a value of 57 mm, which was an excessive deformation not allowed in the construction.
Figure 20 illustrates the plastic regions of the soils in Cases 8 and 12. The plastic points shown in Figure 20 are the stress points in a plastic state. The red open squares, which are called the Mohr–Coulomb points, represent the shear failures that occur in the soils that reached the Coulomb failure criterion. The black solid squares, which are called tension cut-off points, represent the tension cut-off criterion that was applied. As shown in Figure 20(a), for Case 8, the Mohr–Coulomb points are mainly located in the region just behind the wall. The maximum soil deformation in this region increased from 27.5 to 66.2 mm. Although the prescribed state was reached during numerical analysis, the soils collapsed in this region, and the potential slip surface almost appeared (see Figure 20(a)). Because the soil layers consisted of cohesive soils and cohesionless soils, the shape of the slip surface was a mix of flat and arc surfaces, which extended to the anchor head of L3. In addition, tension cut-off points appeared on the ground surface, meaning that the tension gaps appeared in Case 8. For Case 12, Figure 20(b) shows four plastic regions in the surrounding soils. Two shear plastic strain regions, R1 and R2, appeared near the ground surface after the failures of L5 and L6. The capacity of the support system was reduced, and the soil deformation increased, leading that the plastic region R2 being developed at the excavation bottom along the potential slip surface. The capacities of the soils behind the wall reinforced by tieback anchors. Thus, when the soils moved to the wall, the plastic region R1 appeared above the top anchor. The plastic region R4 appeared before the wall because the soil body reached the ultimate state due to the compression of the pile wall.
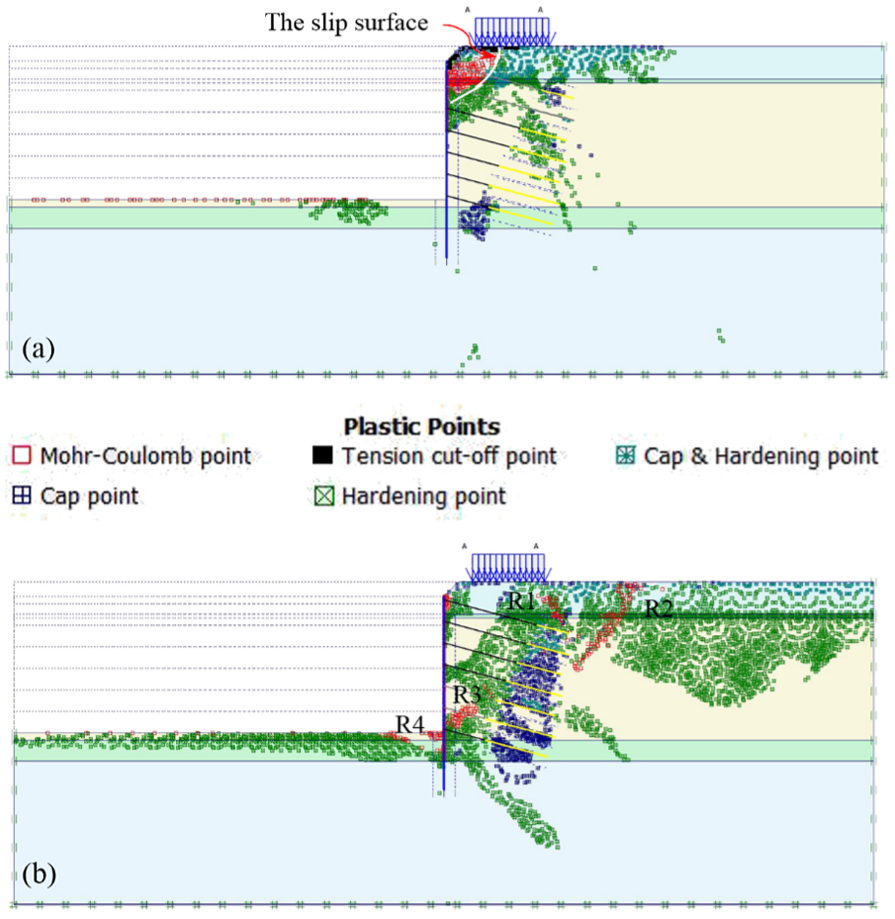
Plastic region of soils: (a) Case 8 and (b) Case 12.
To understand the behaviors of the extreme conditions, the three-row anchorage failure cases were studied by FEM analysis. The results obtained from the numerical investigation showed that the moment and deformation of the pile wall were excessive, and that the soils behind the wall collapsed. Therefore, excavation collapse occurred after the three-row anchor failures.
Excavation stability
The analysis methods for the excavation stability include the limit equilibrium method, the limit analysis method, and the strength reduction method. The strength reduction method is usually applied during an FEM analysis to calculate the excavation stability. The strength parameters, c and φ, were reduced by a small increment step to reach the ultimate state of soils. The safety factor of the excavation stability Fs was defined as follows

where φ0 and c0 were the initial strength parameters of the soils; φr and cr were the reduced strength parameters of soils. In the program PLAXIS, the unstable state of the excavation was calculated by strength reduction using the Phi-c reduction program embedded in the PLAXIS program. The reduction ratio was the safety factor of the excavation stability, avoiding the assumptions for the shapes and positions of the slip surfaces. The overall safety factors in the various anchorage failure cases are shown in Table 3. The one-row anchorage failures had a slight effect on the excavation stability, with a maximum safety factor reduction of 11.3%. For the two-row anchorage failure cases, Cases 8 and 13 were two of the most dangerous failure cases, with safety factors of 1.167 and 1.216 and with reductions of 24.0% and 20.8%, respectively. Hence, sufficient attention should be paid to tieback behavior monitoring in current practice to avoid excavation collapse caused by Cases 8 and 13.
The safety factors of excavation stability in various anchorage failure cases.

Strength reduction was not applied to the supporting structures, but the different supporting structures could determine the damage profile of the excavation. The deformation contours of the soils showed the damage profile of the excavation and the slip surface when the ultimate state was reached by the reduction progress. The slip surfaces for the different anchorage failure cases were similar and were surfaces through the pile bottom, except for Case 8 and Cases 11–13. The damage profile for Case 8 was a partial collapse (see Figure 21(b)). The typical damage profile is shown in Figure 21. Figure 21(a) illustrates that the slip surface is close to flat because the soils are primarily cohesionless.
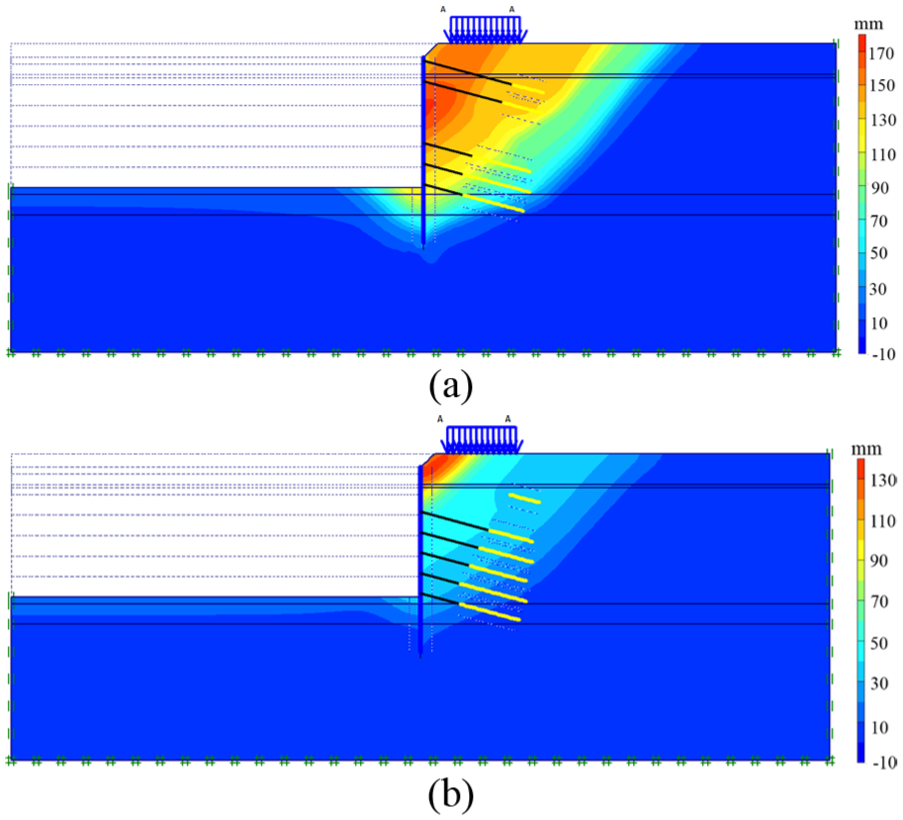
Deformation contour of excavation after Phi-c reduction: (a) Case 10 and (b) Case 8.
Individual anchor failure
The range of anchorage failures in the tieback anchored pile wall support system is varied in practice. However, due to the limitations of the plane strain model, the numerical analysis above was for only the anchor group failure, that is, the anchor row failure. The three-dimensional model was established using PLAXIS 3D Tunnel to simulate the individual anchor failure (see Figure 22), including a one-anchor failure and a two-anchor failure. The mesh of three-dimensional numerical model is shown in Figure 22. The 15-node wedge elements were selected for the soils in this analysis. The 15-node wedge element is composed of six-node triangles in x-y-direction and eight-node quadrilaterals in z-direction. The node location and stress points of typical element are illustrated in Figure 23. The pile wall in three-dimensional numerical model was equivalent to be a diaphragm wall using plate element. The parameters of the equivalent wall were set as the same with those used in two-dimensional numerical model. The critical failure cases were selected to analyze the effects on the retaining structure after the individual anchor failure.

Mesh of three-dimensional numerical model.
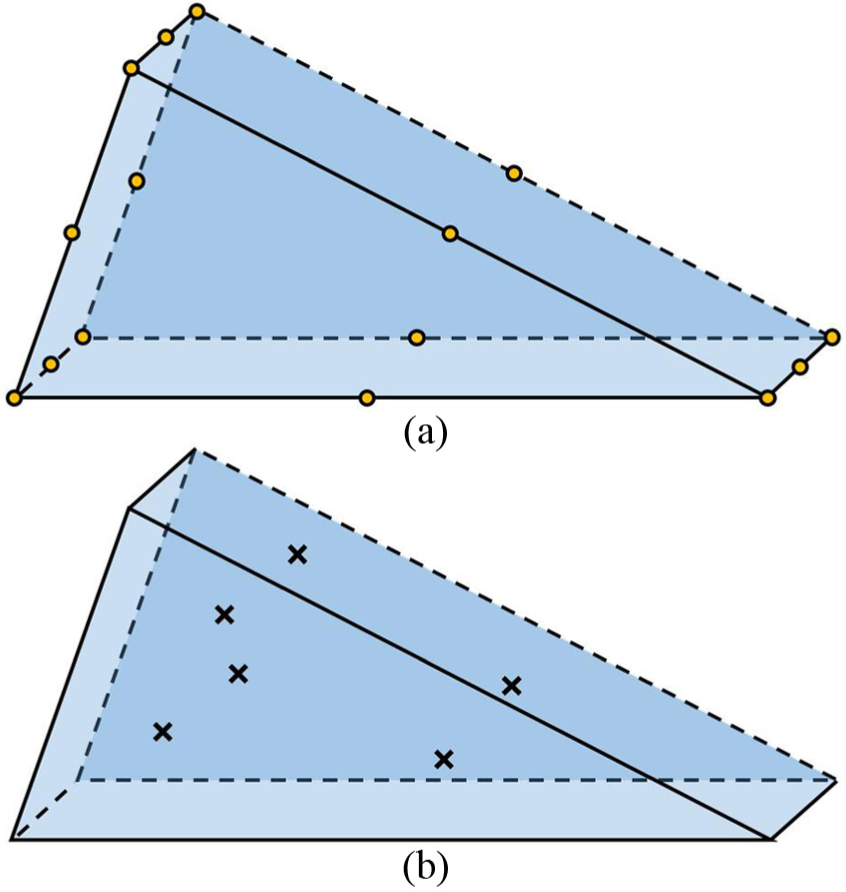
(a) Mesh nodes and (b) stress points of 15-node wedge element.
The individual anchor failure cases were defined as Cases 1-13, which were same as the anchor group failure cases. Figure 24(a) shows the maximum horizontal deformation (δm) of the pile wall and the ratio to that in Case 0, and Figure 24(b) shows the maximum bending moment (Mm) and the ratio to that in Case 0. Figure 24(a) shows that the deformation behavior of the pile wall in the individual anchor failure cases is similar to that in anchor row failure cases (see Figure 11(a)), except for Case 8, which was the top anchor failure. The cases of maximum deformation increment were Cases 6 and 12, with δm values of 26.4 and 26.6 mm, respectively, in one-anchor failure cases and two-anchor failure cases. The ratios of δm/δm0 in various cases were not more than 1.02. Figure 24(b) shows that the Mm in one-anchor failure cases and two-anchor failure cases is similar in shape. The cases of the maximum moment increment were also Cases 6 and 12, with Mm values of 157.4 and 156.3 kN m, respectively. The ratios of Mm/Mm0 in various cases were approximately 0.99–1.03. In a word, the individual anchor failure has little effect on the tieback anchored pile wall.

The maximum (a) pile wall deformation and (b) bending moment in individual anchor failure cases.
Figure 25 shows the prestress increment of the upper and lower row anchors in Cases 6 and 12. As shown in Figure 25, the prestress increment of the anchors declined with the increase in distance from the failed anchor. The maximum prestress increment was 3.0 kN, which was 1.3% of the anchor prestress. The influence scope of the individual anchor failure was approximately 11–22 m. Because the influence scope and mechanical behavior of the retaining structures caused by anchorage failure are closely related to the stiffness of the walings, a more refined model is required for further research.
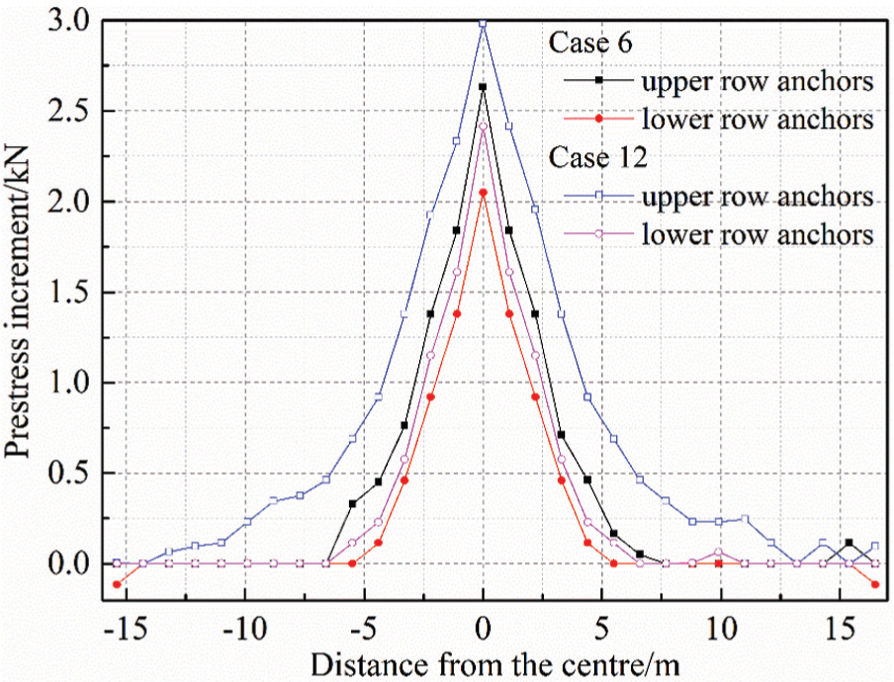
Prestress increment caused by individual anchor failure.
Interpretation and discussion
Normally, the process of anchorage failure needs a certain time. The anchors still provide some service load when anchors tend to failure and loss part of the prestress. In this study, model of anchorage failure was simplified in the numerical investigation. In order to investigate the clear mechanical responses to anchorage failure, the residual service load was assumed equal to 0.
For anchor row failures, the influences of two-row anchor failures are more significant than that of one-row anchor failures in terms of the deformation and internal force of pile wall, the internal force of adjacent anchors, and the ground settlement. For all the anchor row failure cases studied in this article, the maximum horizontal deformation (δm) of the pile wall increased in different degrees. After anchorage failure occurred, the load of failure anchors was untaken by retaining structures (pile wall and anchors) and surrounding soils. The increment of pile wall deformation mainly depends on the earth pressure acting on the pile wall (or the loads of failure anchors). Therefore, the increment of pile wall deformation increased with the increasing of depth of anchorage failure point (except Cases 7 and 13). In this process, the prestress of the anchors adjacent to failure point increased. The prestress increment mainly depends on the deformation of pile wall and the size of free length. According to the numerical results, the maximum prestress increment ratio is 52% of original prestress, which is considerable during the excavation construction. The ground settlement behind the wall was known to have a close relationship with the pile wall deformation. Therefore, the increment of ground settlement induced by various failure cases was similar to the increment of pile wall deformation.
Based on the numerical results, Cases 8 and 12 were the most dangerous failure cases. However, the mechanical responses of these two failure cases showed different. For Case 8, the bearing mode changed at the top of pile wall. The maximum deformation and bending moment occurred at the top of pile wall. Figure 20(a) shows a potential slip surface of Case 8. A partial collapse could be induced due to the anchorage failure of Case 8. According to ground settlement results, a large amount of settlement occurred within 10 m from the pile wall. This is a potential risk point and should be avoided if buildings or roads locate at the dangerous region. Compared with Case 8, Case 12 did not cause excessive ground settlement. However, an excavation rotation collapse could happen according to the potential slip surface shown in Figure 20(b). All the cases of anchor row failure did not cause excavation collapse. This is mainly because the design of the retaining structures for the excavation is conservative.
For the numerical investigations in this study, there are several limitations as follows:
The effect of underground water on the responses to anchorage failure was not taken into account. Obviously, the seepage or inrush of the water may intensify the influence induced by anchorage failure.
The numerical investigations in this study are applicable to anchor row failure. The mechanical responses to another important anchor group failure, that is, partial anchor group failure, may be different because the anchorage failure type influences the load transfer mechanism after anchorage failure happening.
Due to the limitation of the excavation case, the failure state of the retaining structure was not verified directly. Scale model tests will be performed for the next work because of the more reasonable failure state.
Conclusion
In this article, the mechanical responses of deep excavation to partial anchorage failure were studied by a series of numerical investigations based on a case history of tieback anchored pile wall supported deep excavation. The accuracy of the FEM model was verified by the in situ measured data. The load transfer mechanisms and mechanical responses were analyzed:
Compared with the one-row anchorage failure cases, the deformation and bending moment increments in the two-row anchorage failure cases were relatively larger. Despite this, both failure cases had similar mechanical responses in the supporting structure. The most dangerous failure cases occurred when the failure position was located near where the maximum horizontal deformation of the pile wall occurred.
I was defined to indicate the increment ratio of the pile wall bending moment caused by the anchorage failure. Once the failure of a pile is dominated by its bending capacity, the ratio of Kd/I became a key factor in excavation stability under the conditions of partial anchorage failure.
After the partial anchorage failure, the load on the failure position transferred to the left tieback anchors, causing an increase in prestress. The prestress increment inclined nonlinearly with the increase in distance from the failure position.
The one-row anchorage failure and individual anchor failure cases slightly influenced the stability of the excavation. For the two-row anchorage failure cases, the excavation stability was reduced significantly, especially for Cases 8 and 13, where the safety factors were 1.167 and 1.216, respectively.
The damage profile of the excavation is determined by various anchorage failure cases. A partial collapse occurred at the top of the excavation after the failure of the top anchors. Under the other anchorage failure cases, the instability of the entire excavation occurred along a slip surface through the pile bottom.
Footnotes
Acknowledgements
The support of Professor Tim Newson is greatly appreciated. The writers thank the anonymous reviewers for their careful review of the manuscript and useful comments.
Handling Editor: Jining Sun
Author Contributions
In this study, J-Y.H. and W.Z. conceived and designed the investigations; Y.C. and P-J.J. analyzed the data; J-Y.H. and P-J.J. conducted the numerical simulations; S-G.L., Z.Z. and Y.L. contributed analysis tools; and Jian-Yong Han wrote the paper.
Declaration of conflicting interests
The author(s) declared no potential conflicts of interest with respect to the research, authorship, and/or publication of this article.
Funding
The author(s) disclosed receipt of the following financial support for the research, authorship, and/or publication of this article: This study was financially supported by the National Natural Science Foundation of China (grant no. 51578116), the Program for Liaoning Excellent Talents in University (LR2015024) and the Fundamental Research Funds for the Central Universities (N160106006).