
Abstract
The engine experiments require multiple tests that are hard, time-consuming, and high cost. Therefore, an artificial neural network model was developed in this study to successfully predict the engine performance and exhaust emissions when a port fuel injection spark ignition engine fueled with n-butanol–gasoline blends (0–60 vol.% n-butanol blended with gasoline referred as G100-B60) under various equivalence ratio. In the artificial neural network model, compression ratio, equivalence ratio, blend percentage, and engine load were used as the input parameters, while engine performance and emissions like brake thermal efficiency, brake-specific fuel consumption, carbon monoxide, unburned hydrocarbons, and nitrogen oxides were used as the output parameters. In comparison between experimental data and predicted results, a correlation coefficient ranging from 0.9929 to 0.9996 and a mean relative error ranging from 0.1943% to 9.9528% were obtained. It is indicated that the developed artificial neural network model was capable of predicting the combustion of n-butanol–gasoline blends due to a commendable accuracy.
Introduction
With the climbing threat of energy depletion and air pollutions,1,2 there has been growing interest in the use of renewable fuels in recent years. Biofuels, being one possible renewable fuel, are biodegradable and have potential to reduce air pollution.3–5 The most common biofuel includes alcohols, vegetable oils, biodiesel, and so on. Among various biofuels, alcohols have been extensively utilized in internal combustion engines due to its potential to reduce emission of greenhouse gas and toxic exhaust components, enhance overall energy efficiency, and reduce fuel costs.6–8
Ethanol can be produced through a biological process, that is, alcoholic fermentation of sugars from biomass materials,9–11 while methanol is commonly produced in a catalytic process and has a high toxicity to mankind. Therefore, ethanol seems to be a more superior biofuel compared to methanol. Ethanol has been widely used as alternative fuel in many countries, such as United States, Brazil, and China. In comparison with methanol and ethanol, butanol being a viable alternative provides several advantages over them. For example, butanol is hardly miscible with water and less prone to moisture contamination, and thus butanol could be transported using the existing infrastructure. Butanol has a better fuel economy due to its higher energy density. In addition, Butanol has a higher flashing point and boiling temperature and thus is safer for storage and transportation.12–14 In recent years, butanol has been largely investigated because it is expected to be a feasible, economic, and sustainable alternative fuel.
Many researchers have been engaged in the study of butanol as a blended fuel. Atmanlı et al. 15 investigated the effect of 30 vol.% n-butanol–gasoline blend in a single-cylinder spark ignition (SI) engine. The results showed that the 30 vol.% n-butanol addition reduced engine efficiency by 7%. Dernotte et al. 16 tested the emission of an SI engine fueled with n-butanol–gasoline blends. They found that B60 (referred to as 60 vol.% butanol added into gasoline) produced a 18% and 47% unburned hydrocarbon (UHC) emission than that of gasoline. A lower carbon monoxide (CO) emission relative to gasoline was only occurred for B80. Wallner et al. 17 examined the performance and emission of a direct-injection four-cylinder SI engine fueled with B10. It was found that B10 had a 3.4% higher brake-specific fuel consumption (BSFC) than that of gasoline. B10 had a slight effect on CO and UHC emissions. However, Gu et al. 18 found B10 caused a noticeable reduction in CO and UHC emissions. Szwaja et al. conducted some experiments to study combustion characteristics of n-butanol in SI engine.19,20 It was seen that n-butanol provides a better combustion stability due to the lower coefficient of variation (COV) of indicated mean effective pressure relative to gasoline. Meanwhile, butanol showed a higher knocking resistance that allows SI engine be worked in a higher compression ratios and gives SI engine an ability to deliver power more efficiently and economically.
Artificial neural network (ANN) is a computing system that consists of many artificial neurons and has been used to process multifarious variety of issues in the field of science and engineering. Some issues, being difficult to be modeled mathematically, can be sorted by the ANN that learns to solve issues by considering input example without task-specific programming. The ANN has been recently tried to handle the problems in internal combustion engines, and a significant success has been gained. Performance and exhaust emissions of the engine fueled with methanol, ethanol–gasoline blends, biodiesel, compressed natural gas (CNG), and liquefied petroleum gas (LPG)-diesel blends have been predicted by ANN in the literature.21–30 Canakci et al. 21 built an ANN model, where fuel properties, engine operating conditions, and environment conditions are set as the input, while thermal efficiency, fuel consumption, CO, carbon dioxide (CO2), hydrocarbons (HCs), and nitrogen oxides (NOx) are set as the output. It was found that the model was not able to accurately predict engine emissions. An ANN model was developed to predict the engine performance parameters, including brake thermal efficiency (BTE) and BSFC, and the engine emissions parameters, including particle matters (PM), NOx, and HC. 24 The results showed that the model had a commendable accuracy due to the correlation coefficient ranging from 0.99833 to 0.99999 and mean absolute percentage errors ranging from 0.045% to 1.66%. Najafi et al. 26 predicted power, torque, volumetric efficiency, and emissions of the engine fueled with ethanol–gasoline blends, where correlation coefficients in the range of 0.97–1 and mean relative errors (MREs) in the range of 0.46%–5.57% are obtained.
According to the investigations mentioned above, the ANN model is of these unique advantages such as requiring moderate modeling data and high precision in resolving the nonlinear prediction problems with moderate sample sets. Therefore, a novel idea will be gotten that the ANN model is used to predict the combustion of n-butanol–gasoline blends in a port fuel injection (PFI) SI engine, and new contributions in this work can be expressed as follows: (1) combustions of the n-butanol–gasoline blends are investigated by experimental methods; (2) an ANN model for predicting the performance and exhaust emissions in a PFI SI engine is established; and (3) the ANN model is proposed to predict effectively BTE, BSFC, BTE, CO, UHC, and NOx emissions of SI engine fueled with n-butanol–gasoline (G100-B60) blends. The research results reveal that the prediction validity of the ANN model has been tested by the experimental values.
Experimental methods
Fuel preparation
In this study, n-butanol and gasoline blends are obtained through a temperature-controlled magnetic stirrer to mix n-butanol with analytical grade of 99.5% and commercial gasoline with research octane number of 92. The properties of n-butanol and gasoline are shown in Table 1. A gravitational experiment is used to test the stability of n-butanol–gasoline blends. In the test, the fuel blends are put in tubes at 25°C and 1 atm and still show a clear single phase after 21 days.
Properties of the test fuels. 19

p = 1 atm, T = 358 K, Φ = 1.
p = 1 atm, T = 343 K, Φ = 1.
AFR: air fuel ratio.
Test engine
Figure 1 and Table 2 show the schematic diagram and general specifications of the engine used in this study, respectively. 31 The engine is a single-cylinder PFI research engine that has an identical cylinder geometry to a 2000 Ford Mustang Cobra V8 engine and a peak output less than 30 kW and 52 N m. The engine is mounted on a GE-type TLC-15 class 4-35-1700 dynamometer that is controlled by a DYN-LOC IV controller. A DTC-1 digital throttle controller is used to control throttle position of the engine. A calibrated Megasquirt II V3.0 engine control unit (ECU) is used to control the engine, which allows the adjustment of spark timing and fuel injection amount. A Kistler-type 6125B pressure transducer is used to measure in-cylinder pressure. The corresponding crank angle of the in-cylinder pressure is detected by a BEI XH25D shaft encoder. The measurements of NOx and excess air coefficient (lambda) were performed by a Horiba MEXA-720 NOx nonsampling-type meter. The measurements of CO and UHC were carried out by a Horiba MEXA-554JU sampling-type meter. A LabVIEW code was developed to record real-time experimental data. The measuring range, accuracy, and resolution of the experimental apparatus are listed in Table 3.

Engine setup.
Engine specifications.

SI: spark ignition.
Measuring range, accuracy, and resolution of the experimental apparatus.
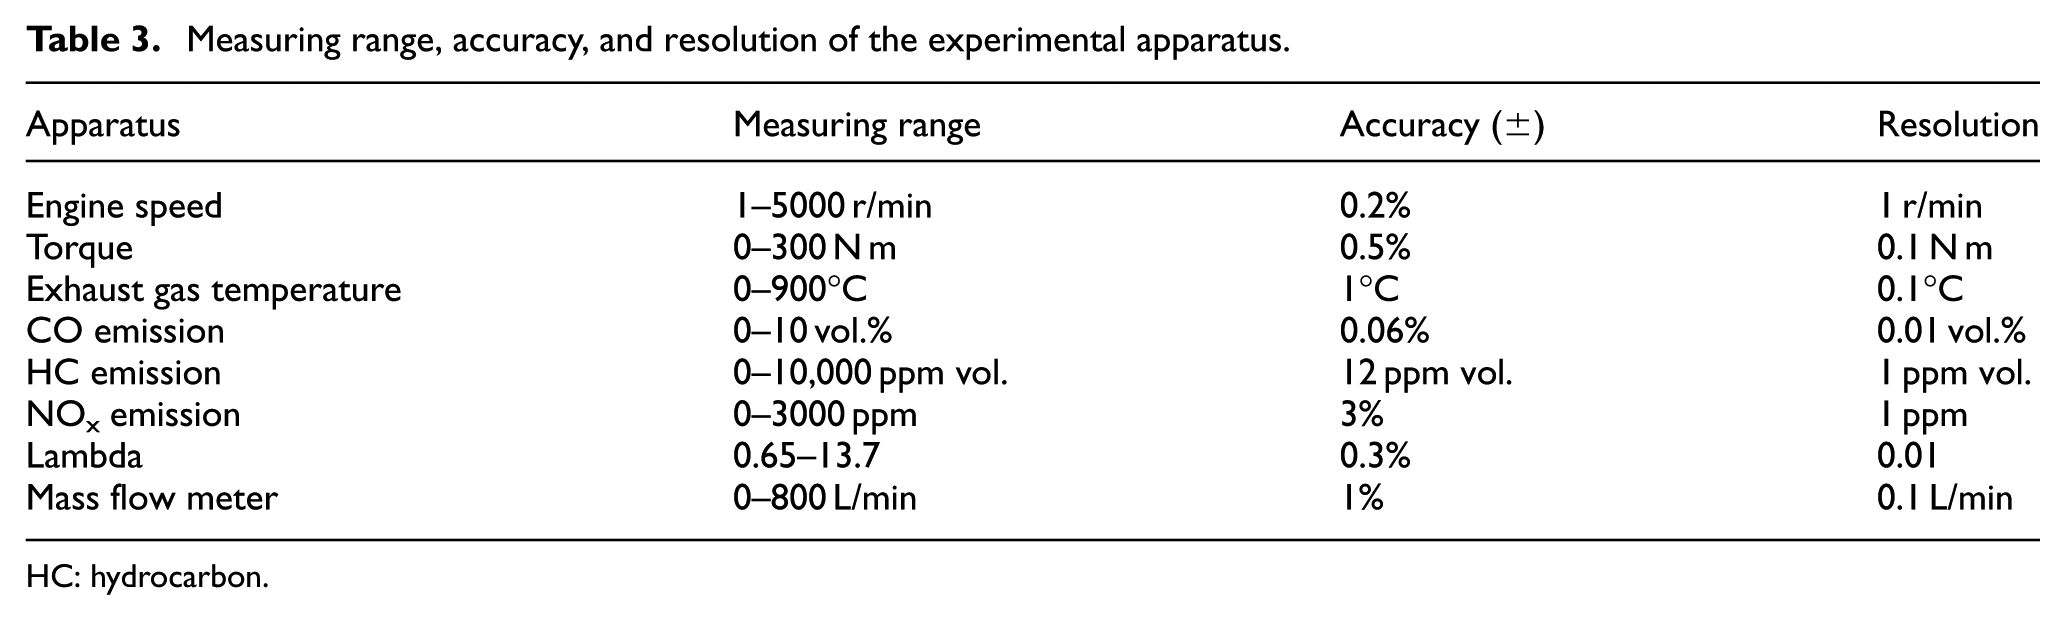
HC: hydrocarbon.
Test conditions
In this study, the engine was operating at wide-open throttle, which is meaningful to understand the combustion behavior of fuel due to the obtained combustion efficiency. The test was fixed at the engine load of 300 kPa brake mean effective pressure (BMEP) and the spark timing of gasoline’s maximum brake torque (MBT). The equivalence ratios varied from 0.83 to 1.25, covering lean, stoichiometric, and rich conditions. The experimental data of engine torque, lambda, and NOx were averaged during in 60 s, while the experimental data of UHC and CO emissions were directly read from apparatus screen. The tested emission was raw exhaust gas from the engine without the use of a catalytic converter. The experimental data were collected until the engine was warmed up. Each experiment was performed three times in a temperature and humidity-controlled room. Test conditions are listed in Table 4.
Test conditions.
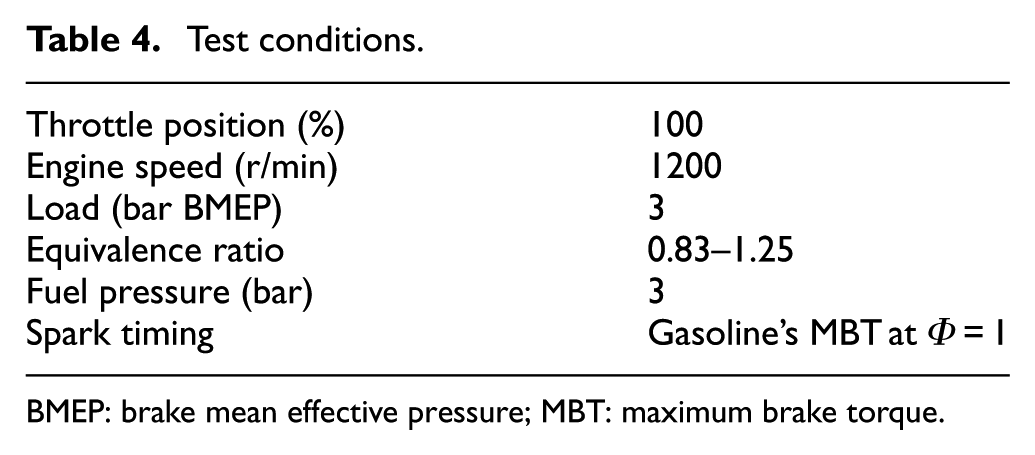
BMEP: brake mean effective pressure; MBT: maximum brake torque.
Results and discussion
Engine performance and exhaust emissions
Figure 2 shows the effect of butanol–gasoline on engine power. After using butanol, the engine power was reduced by 17.9%–27.4%, 3.9%–25.3%, and 3.7%–20.2% for B10, B30, and B60, respectively. It was probably because the engine is running at the spark timing of gasoline’s MBT, and the advanced combustion phasing of butanol–gasoline blends as shown in Figure 3 resulted in the increase in work lost in compression process and decrease in net useful work. Due to the higher laminar flame speed of butanol than that of gasoline (see Table 1), butanol–gasoline blends obtained the shorter initial combustion period. The combustion rate in the following flame propagation was promoted by the higher pressure built of butanol–gasoline blends during the initial combustion period. Therefore, butanol–gasoline blends obtained an advanced combustion phasing compared to gasoline. The peak power was achieved at Φ = 1.0 due to the complete combustion, while the combustion would be incomplete at lean conditions and deteriorated at rich conditions. With the decrease in equivalence ratio, increased dilution improved isentropic efficiency by decreasing heat loss and increasing the adiabatic exponent value due to the lower temperatures than those under stoichiometric condition. The higher combustion temperature caused by increasing engine load resulted in an improved combustion quality and a higher engine power. The difference in engine power between the fuels was reduced at lean conditions. This could be explained by the fact that the combustion phasing of fuels was retarded at lean conditions, but the engine was still running at gasoline’s MBT at stoichiometric condition, and thus, the advanced combustion phasing of butanol–gasoline blends was more suited, thus negating the impacts of improper combustion phasing on engine power.

Power of the engine.

Cylinder pressure of the engine.
The exhaust emissions of the engine are shown in Figure 4. Figure 4(a) shows the influence of butanol–gasoline on BTE. Similarly, the butanol addition caused the 1.7%–2.7%, 0.4%–4.5%, −0.5% to 0.9% lower BTE for B10, B30, and B60 relative to gasoline, respectively. For the higher BTE of B60, it might be because the improved combustion quality owing to fuel-borne oxygen of butanol offset the net work loss owing to improper combustion phasing. In addition, the BTE increased with decreasing equivalence ratio. When equivalence ratio was decreased, increased dilution improved isentropic efficiency by lowering temperatures and increasing adiabatic index (γ). 32

Performance and emissions of the engine: (a) BTE, (b) BSFC, (c) CO, (d) UHC, and (e) NOx.
Figure 4(b) presents the effect of using butanol–gasoline blends on BSFC. Due to the lower heating value (LHV) of butanol, the 0.8%–5.1%, 8.7%–13.3%, 16.7%–18.5% higher BSFC were obtained by B10, B30, and B60 compared to gasoline, respectively. In addition, the BSFC increased with increasing equivalence ratio because of the decreased BTE.
Figure 4(c) shows the relationship between the CO emission and the percentage of butanol in the fuel blends under various equivalence ratios. It was observed that the equivalence ratio controlled CO emission until lean condition was reached after what CO emission did not vary significantly. The low CO emission under lean condition could be explained by the fact that there was more than enough oxygen available to carry on the oxidation process. 33 Generally, a higher CO emission level could be caused by the conditions of locally rich, insufficient oxidizer or low combustion temperature. After adding butanol, the lack of oxygen should not lead to the increased CO emission. Previous studies explained that alcohol-containing fuels could produce more products in terms of heat capacity of combustion products, which lowered combustion temperature and further slowed down the oxidation process of CO emission.34–36 Based on the competing between the increased oxygen content and decreased combustion temperature, the different CO trends were obtained.
Figure 4(d) illustrates UHC emission for different butanol ratios in blends and equivalence ratio. UHC emission increased for rich condition because of incomplete combustion as the combustion quality deteriorates. 33 Due to the improved combustion quality as a result of fuel-borne oxygen, B30 showed the 12.4%–27.5% lower UHC emission. However, when the ratio of butanol in blend increased to 60%, the UHC was majorly increased due to the deteriorated combustion quality, which was consistent with the results in Dernotte et al. 16
Figure 4(e) shows the concentrations of NOx emission for various butanol ratios in blends and equivalence ratio. NOx emission is generally formed by three pathways: (1) fuel-nitrogen conversion, (2) Zeldovich thermal activation, and (3) fuel-rich prompt formation. 37 Zeldovich thermal activation was the predominate mechanism for NOx emission formation from combustion ignition engines. The higher combustion temperature and local oxygen concentration in the peak temperature zone were in favor of NOx emission formation. For different equivalence ratios, the highest NOx emission was seen at Φ = 0.9–1.0 with a decrease in the equivalence ratio obtained relatively richer or leaner because the complete combustion approaches were attained under Φ = 0.9–1.0 which led to a higher peak combustion temperature. In comparison with G100, although a more oxygen concentration was provided, a decreased combustion temperature and thus a different NOx trend were obtained.
ANN model
The ANN is a relatively crude electronic model based on the neural structure of the brain. The brain basically learns from experience, and thus the ANN model needs experimental data to train inner networks so that it can process specific problems in precision. The ANN model basically consists of input layer, hidden layers, and output layer.
In order to predict performance and emissions of the engine using butanol–gasoline blends, an ANN model is developed, in which a standard back propagation (BP) algorithm is used: input vector

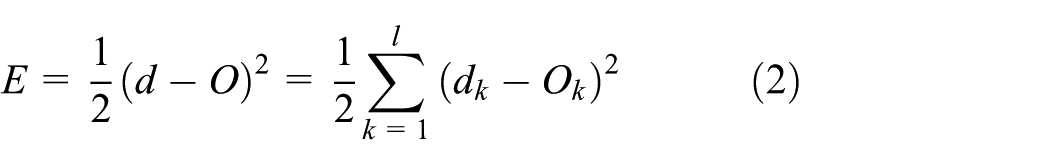
When the network output is different from desired output, there is error
When it is expanded to the input layer

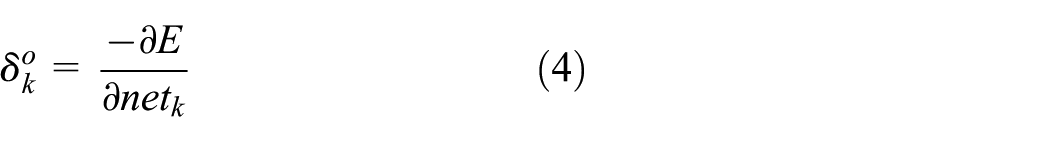
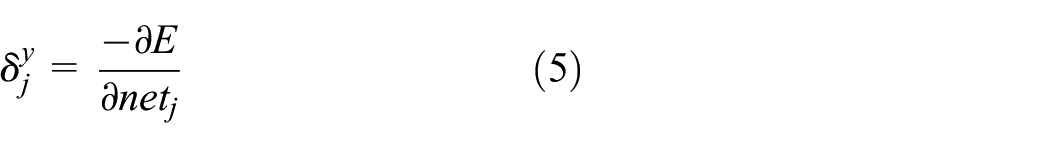
From the equation above, the error is the function of the network input layers of weights wjk and vij. Adjusting the weights can change the error E, and the principle of weight adjustment is to decrease error; therefore, the amount of weight should be proportional to the negative gradient of error. For each hidden layer and output layer, different error signals should be defined
After derivation, the weight adjustment of learning algorithm of BP neural network is calculated as follows


Approximately 80% experimental data is randomly selected for the purpose of training, and the remaining 20% was used to testing. Equivalence ratio and butanol concentration is set as the input of the ANN model, while power; BTE; BSFC; and emissions of CO, UHC, and NOx are set as the output. Therefore, there are two neurons and six neurons in the input layer and out layer, respectively, as shown in Figure 5.

Structure of ANN for gasoline engine with butanol–gasoline blends.
The number of hidden layers and neurons within each layer was designed based on the complexity of the problem. In view of computation cost, the ANN model should be simplified as small as possible. Therefore, a regression analysis between the network response and the corresponding targets was performed to investigate the network response. Different training algorithms, including scaled conjugate gradient (SCG) and Levenberg–Marquardt (LM), were tested. The SCG belongs to the class of conjugate gradient methods, which show superlinear convergence on most problems. The SCG algorithm denotes the quadratic approximation to the error E in a neighborhood of a point w by

In order to determine the minimum to Eqw(y), the critical points for Eqw(y) must be found. The critical points are the solution to the linear system defined by Moller

The LM algorithm is specifically designed to minimize sum-of-square error functions
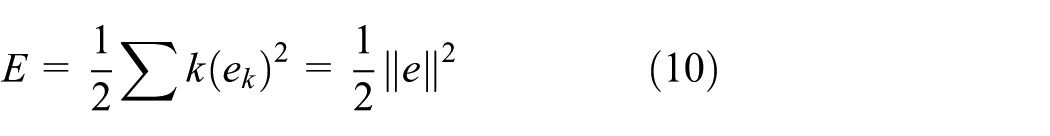
where ek is the error in the kth exemplar or pattern and e is a vector with element ek. If the difference between the previous weight vector and the new weight vector is small, the error vector can be expanded to first order by means of a Taylor series

In the LM algorithm, the error function is minimized, while the step size is kept small in order to ensure the validity of the linear approximation. This is accomplished by use of a modified error function of the form

where λ is a parameter governing the step size. Minimizing the modified error with respect to wj+1 gives

very large values of λ amount to standard gradient descent, while very small values λ of amount to the Newton method.
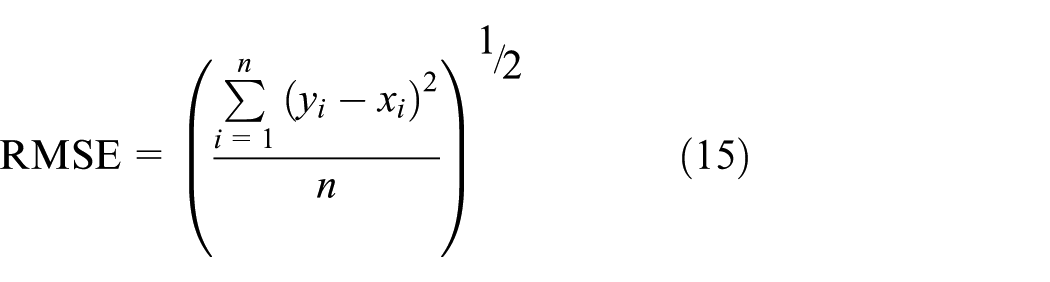
The performance of the ANN model is evaluated by three criteria, that is, correlation coefficient (R), root mean squared error (RMSE), and MRE defined as equations (2)–(4). As shown in Table 5, R and RMSE values did not increase when neurons in the hidden layer is more than 15 such as 16, 17, and 18


Summary of different networks evaluated to yield the criteria of network performance.

RMSE: root mean squared error; SCG: scaled conjugate gradient; LM: Levenberg–Marquardt.
Therefore, a network with 1 hidden layer and 15 neurons was selected as the optimum ANN. In addition, LM algorithm presented a lower R and RMSE, and thus LM algorithm was selected in this study.
ANN predicted results
As shown in Table 6, the experimental dataset for every output parameter includes 45 values, of which 30 values were used for training the network, and 15 values were selected randomly to test the performance of the trained network. The predicted versus experimental values for the experimental parameters are indicated in Figure 6. The prediction of ANN yielded the correlation coefficient of 0.9971, 0.9996, 0.9980, 0.9929, 0.9980, and 0.9982 for power, BTE, BSFC, CO, UHC, and NOx, respectively. It was found that RMSE values were 0.0795 kW, 2.0765%, 38.5611 g/kWh, 1.9159 vol.%, 52.8370 ppm vol., and 339.4638 ppm for power, BTE, BSFC, CO, UHC, and NOx, respectively. In addition, the ANN predictions for the power, BTE, BSFC, CO, UHC, and NOx yielded the MRE of 0.3527%, 0.1943%, 0.4311%, 9.9528%, 0.9307%, and 2.9520%, respectively. A comparative presentation of the error during testing using ANN and experimental results was also shown in Figure 6. There was a good correlation between the simulations from ANN and the measured data. Therefore, ANN appeared to be a useful method for simulating engine parameters.
Experimental data used in ANN model.

BTE: brake thermal efficiency; BSFC: brake-specific fuel consumption; UHC: unburned hydrocarbon.

Comparison of ANN predicted value with measured data: (a) Power, (b) BTE, (c) BSFC, (d) CO, (e) UHC, and (f) NOx.
Conclusion
In this experimental study, the engine performance and exhaust emissions of the engine fueled with butanol–gasoline blends were predicted using ANN method. By the investigation on butanol–gasoline blends with various butanol ratio under stoichiometric condition, the butanol addition caused the reduction in BTE because the engine was running at the spark timing of gasoline’s MBT, and the decreased BTE caused by improper combustion phasing of butanol–gasoline blends could not be offset by improved combustion quality due to fuel-borne oxygen. In comparison with different butanol–gasoline blends, B30 provided a better results based on its similar BTE and the lower CO (8.7%), UHC (15.3%), and NOx (6.4%) emissions than those of G100. Based on the R close to 1 and the low value of RMSE and MRE, it was indicated that ANN proved to be a useful tool for correlation and simulation of engine parameters. ANN provided an accurate and simple approach in the analysis on engine performance and exhaust emissions of SI engine.
Footnotes
Handling Editor: Oronzio Manca
Declaration of conflicting interests
The author(s) declared no potential conflicts of interest with respect to the research, authorship, and/or publication of this article.
Funding
The author(s) disclosed receipt of the following financial support for the research, authorship, and/or publication of this article: This work was supported by the National Natural Science Foundation of China (11572055, 51606162).