
Abstract
Ethanol is known as the most widely used alternative fuel for spark-ignition engines. Compared to it, butanol has proved to be a very promising renewable fuel in recent years for desirable properties. The conjoint analysis on combustion, performance, and emissions characteristics of a port fuel injection spark-ignition engine fueled with butanol–gasoline blends was carried out. In comparison with butanol–gasoline blends with various butanol ratio (0–60 vol% referred as G100~B60) and conventional alcohol alternative fuels (methanol, ethanol, and butanol)–gasoline blends, it shows that B30 performs well in engine performance and emissions, including brake thermal efficiency, brake-specific fuel consumption, carbon monoxide, unburned hydrocarbons, and nitrogen oxides. Then, B30 was compared with G100 under various equivalence ratios (Φ = 0.83–1.25) and engine loads (3 and 5-bar brake mean effective pressure). In summary, B30 presents an advanced combustion phasing, which leads to a 0.3%–2.8% lower brake thermal efficiency than G100 as the engine was running at the spark timing of gasoline’s maximum brake torque (MBT). Therefore, the sparking timing should be postponed when fueled with butanol–gasoline blends. For emissions, the lower carbon monoxide (2.3%–8.7%), unburned hydrocarbons (12.4%–27.5%), and nitrogen oxides (2.8%–19.6%) were shown for B30 compared with G100. Therefore, butanol could be a good alternative fuel to gasoline for its potential to improve combustion efficiency and reduce pollutant emissions.
Introduction
With the increasing concern on the shortage fossil oil supply and the need for environmental protection, more and more attentions have been paid to renewable fuel in the past few decades. 1 For example, the Energy Independence and Security Act in the United States mandated in 2007 that 36 billion gallons of renewable fuel were to be blended into US transportation fuels by 2022. 2 European Commission also committed that renewable fuel will play a key role in the transition toward a competitive, secure, and sustainable energy system. The share of renewable fuel had increased to 13% in 2012 as a proportion of final energy consumed and is expected to rise further to 21% in 2020 and 24% in 2030. 3 Brazil has been a leader for the past 30 years in the development and commercialization of vehicles powered by ethanol, where the ethanol from sugar cane is widely used as a gasoline extender (up to 25%) or used as a transportation fuel. 4
Among various renewable fuels, alcohols, such as ethanol, methanol, butanol, and so on, sometimes referred to as oxygenates, have been extensively utilized in internal combustion (IC) engines. Ethanol is produced by alcoholic fermentation of sugar from vegetable biomass materials, such as corn, sugar cane, sugar beets, barley, sweet sorghum, and agricultural residues.5–7 But methanol is rarely produced from biomass, and it is mainly produced from coal- or petrol-based fuels. Therefore, ethanol is superior to methanol. In comparison with ethanol and methanol, butanol has higher viscosity, which will cause problems including potential fuel deposit or erosion to spark-ignition (SI) engines, and besides, its lower octane number will require smaller compression ratio as well as lower combustion efficiency and lower combustion efficiency will increase the emission of greenhouse gas carbon dioxide (CO2); however, butanol has a number of desirable properties for use in gasoline engines. Butanol is less prone to water contamination. As a result, it could be distributed with the same infrastructure used to transport gasoline. Additionally, butanol also has a lower latent heat and vapor pressure, octane number, and higher heating value, and so on, which make it a viable alternative to ethanol.8–11 Researchers expected that butanol would become an attractive, economical, and sustainable fuel as petroleum oil nearly and that may explain the increasing studies on butanol in recent years.
The availability analysis of a spark-ignition engine using a butanol–gasoline blend has been experimentally studied by Alasfour. 12 After that, he also investigated the variations of nitrogen oxides (NOX) and hydrocarbons emission.13–14 As for the combustion characteristic of n-butanol in a single-cylinder SI engine,15,16 the results showed that butanol provided higher knocking resistance for allowing advancing the ignition timing in SI engines. In addition, combustion stability of pure butanol did not vary significantly compared to gasoline as measured by the coefficient of variation (COV) of indicated mean effective pressure (IMEP). The performance and emissions of an SI engine fueled withn-butanol–gasoline blends were investigated. 17 It was found that CO2, carbon monoxide (CO), and unburned hydrocarbons (UHC) emissions decreased dramatically while output torque, power, and volumetric efficiency decreased slightly when compared to gasoline. Dernotte et al. 18 examined the emissions characteristics of several n-butanol–gasoline blends (0, 20, 40, 60, and 80 vol% of n-butanol blended with gasoline) using a port fuel injection (PFI) SI engine and found that B60 and B80 produced 18% and 47% more UHC emissions than gasoline, respectively. Meanwhile, B80 was the onlyn-butanol-blended fuel which did not produce lower CO emission than pure gasoline. Yang et al. 19 discussed the feasibility of fueling gasoline engines with n-butanol–gasoline blends, ranging from 10% to 35% n-butanol by volume. Test results showed that the engine power could be maintained when the n-butanol concentration was below 20%. The maximum engine power went down and brake-specific fuel consumption (BSFC) went up slightly when the concentration of n-butanol approached 30%. Gu et al. 20 tested five blended ratios (G100 (i.e. B0 in this article), B10, B30, B40, and B100), and the results showed that the UHC and CO emissions of blends were lower than those of gasoline, and besides, pure n-butanol increased the UHC and CO emissions compared to those of gasoline. They also found that the addition of n-butanol decreased the number concentration of particle emissions. When an SI engine is fueled with 35 vol% butanol, 1 vol% H2O, and gasoline blend, NOX and CO2 emissions are worser than that of the original level of pure gasoline. 21
There are numbers of valuable publications concerning butanol–gasoline blends in SI engines as mentioned above; however, there is limited information on the conjoint analysis of combustion, performance, and emissions for butanol–gasoline blends, which is meaningful because engine performance and emissions depend largely on the combustion characteristic of fuel. Therefore, the experimental investigations on combustion, performance, and emissions of a PFI SI engine fueled with butanol–gasoline blends were carried out by (1) comparison between butanol–gasoline blends (0, 10, 30, and 60 vol% butanol referred as G100, B10, B30, and B60, respectively); (2) comparison between conventional alcohol alternative fuels, including M30, E30, and B30 (30 vol% methanol, ethanol, and butanol–gasoline blends); and (3) comparison between B30 and G100 under various equivalence ratio and engine load.
Experimental setup
Test fuels
Pure commercial summer gasoline with research octane number (RON) of 92 was selected as the baseline fuel in this study. Then, analytical-grade methanol (99.5%), butanol (99.5%), and ethanol (99.8%) were mixed with gasoline using a temperature-controlled magnetic stirrer to prepare alcohol–gasoline blends. The properties of individual fuels are listed in Table 1, and the property of the prepared blends and the blends were deposited in a test tube at 25°C and 1 atm for 14 days. The blends displayed a clear single phase after the stability test.
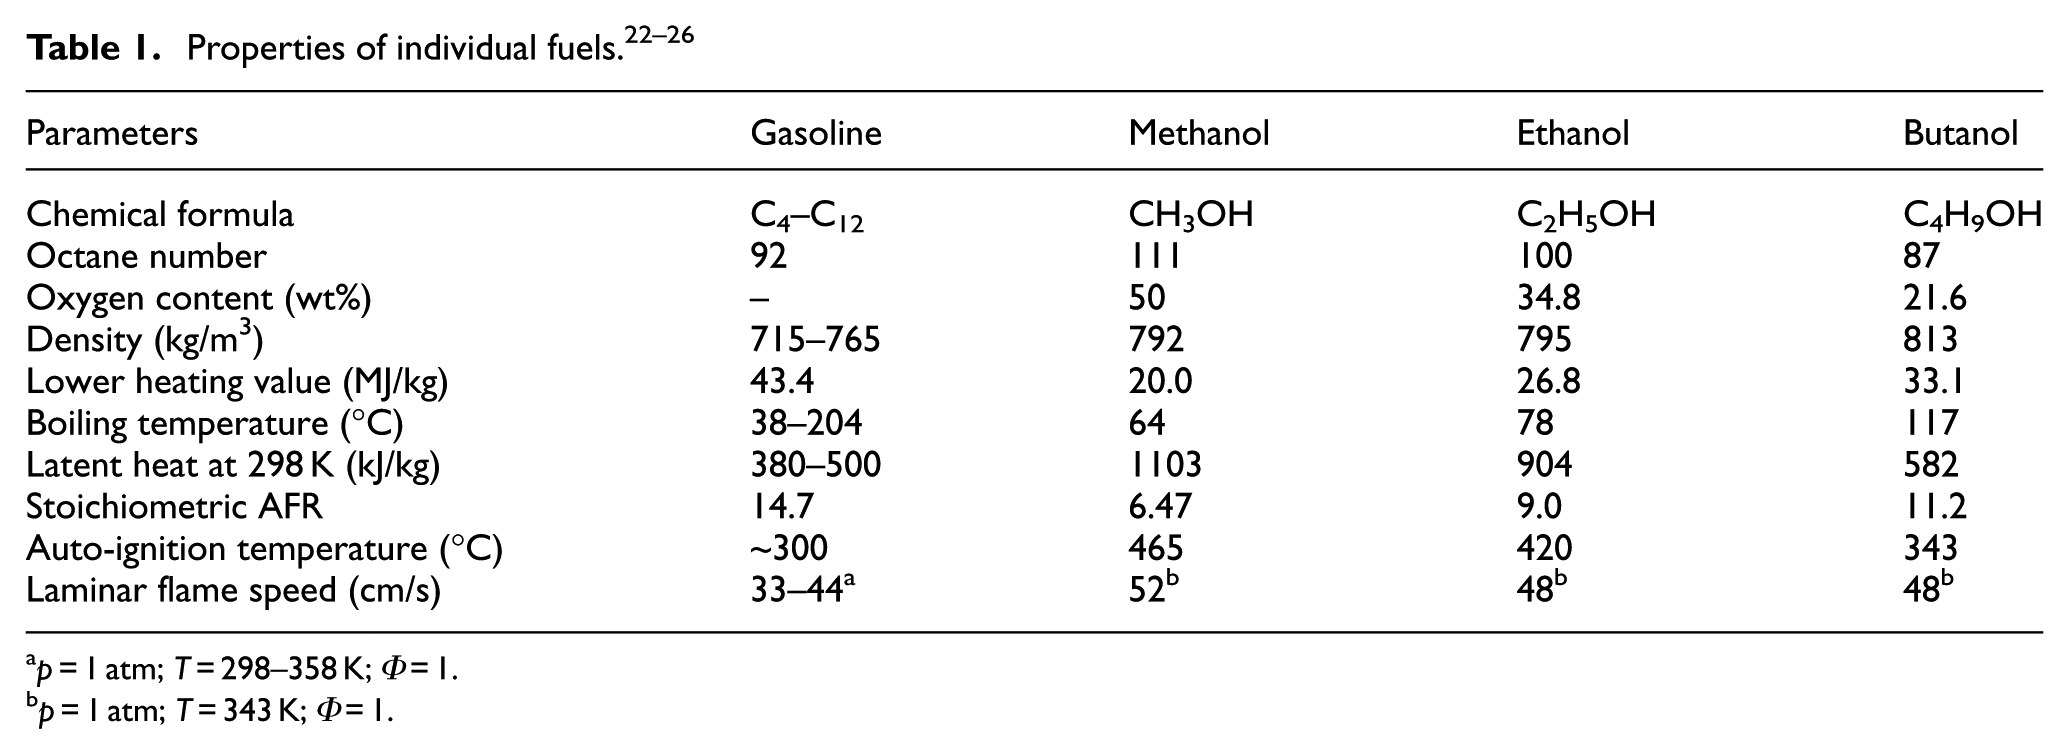
p = 1 atm; T = 298–358 K; Φ = 1.
p = 1 atm; T = 343 K; Φ = 1.
Engine setup
Most of the experimental setup details had been reproduced from Li et al., 27 since the same test bench was used for this study. Experiments were conducted with a single-cylinder engine whose cylinder geometry was identical to the V8 engine assembled in a 2000 Ford Mustang Cobra. The schematic diagram of engine setup is shown in Figure 1, and the engine specifications are listed in Table 2. A GE type TLC-15 class 4-35-1700 dynamometer, controlled by a Dyne Systems DYN-LOC IV controller and a Dyne Systems DTC-1 digital throttle controller, is connected to the engine. A Kistler type 6125B pressure transducer and a LabVIEW code 28 are employed to measure and record in-cylinder pressure, respectively. A Megasquirt II V3.0 engine control unit (ECU), which can adjust the fuel based on volumetric efficiency tables as well as adjust the ignition timing (spark advance) that is a function of engine speed (r/min) and engine load (manifold absolute pressure (MAP)), is used to control the engine. A Horiba MEXA-720 NOX non-sampling type meter is installed in the exhaust manifold of the engine and used for NOX and air fuel ratio (AFR) measurements; meanwhile, a Horiba MEXA-554JU sampling type meter is used for of UHC and CO measurements, and their measurement range and accuracy are listed in Table 3. Besides, a type-K thermocouple, located in the exhaust manifold, is employed to make the measurement of exhaust gas temperature (EGT).

Engine setup.
Engine specifications.

SI: spark ignition.
List of measurements and the instrument range, accuracy, and percentage uncertainties.

CO: carbon monoxide; HC: hydrocarbon; CO2: carbon dioxide; NOx: nitrogen oxides; AFR: air fuel ratio.
Test conditions
The engine load was set to 3 and 5 bar (brake mean effective pressure (BMEP)), and the speed was fixed at 1200 r/min in this study. The experiments were conducted with the throttle plate fully open (i.e. wide-open throttle). The fuels were first tested under stoichiometric conditions with the same ignition timing as gasoline’s MBT to analyze butanol used in SI engines without any modifications. The brake torque, NOX and AFR, and measurements were averaged over a 60-s period in the LabVIEW code, while UHC, CO, and EGT measurements were recorded directly from the emissions analyzer. The experiments were performed three times, and these data sets were then averaged. The test was conducted in a temperature-controlled laboratory, so the effects of humidity were assumed to be negligible. An electronic regulator, which offers precise control (accuracy: ±0.1 kPa), is used to control the intake pressure. In addition, in order to ensure steady-state measurements, the engine was required to run for an extended period of time at each operation condition as well as the data were recorded and averaged every 25 engine cycles. The test conditions are summarized in Table 4.
Test conditions.
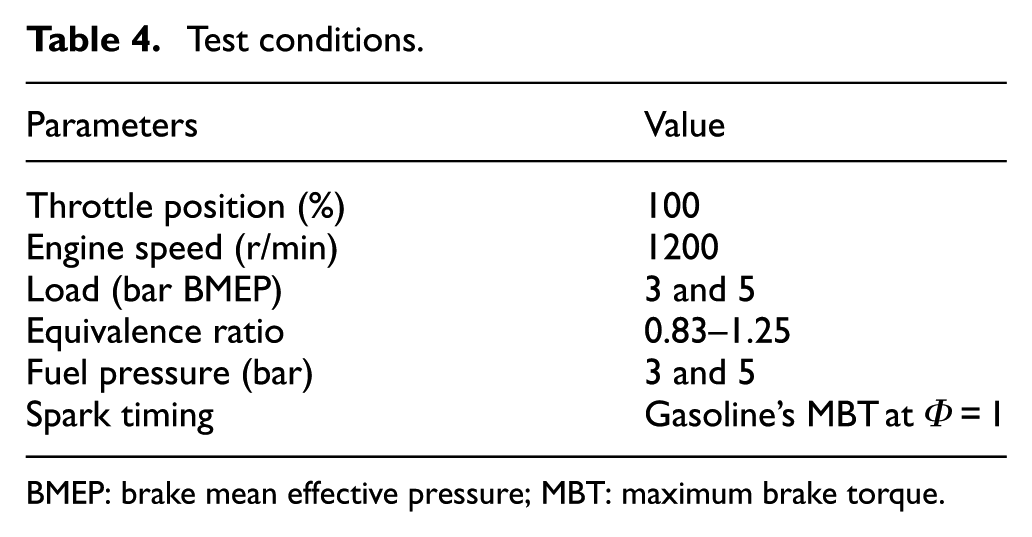
BMEP: brake mean effective pressure; MBT: maximum brake torque.
Parameters tested
A series of tests were conducted with each of the above-mentioned blend fuels. In each test, the parameters for combustion and performance of the engine are listed as follows.
The chemical heat release rate HRR (J/deg) by combustion is expressed as follows
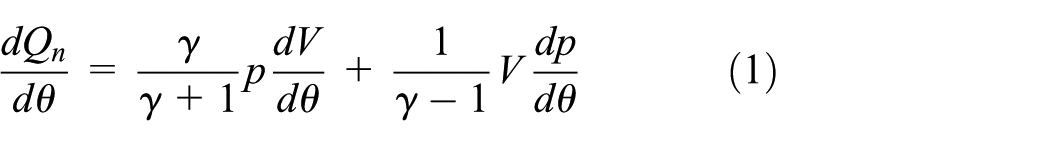
where γ is the polytropic index, p is the in-cylinder pressure, V is the cylinder volume, and θ is the engine crank angle. In this analysis, the heat transfer to walls and fuel flow into crevices were neglected.
The normalized mass fraction burnt (MFB) is expressed as follows

where MF is the integrated heat release at (up to) each crank angle degree, and MT is the total heat released in the cycle. It can be stated that the ratio MF upon MT is considered as normalized MFB with limits from 0 to 1. In this article, the flame development period and major combustion duration are given by 0%–10% MFB and 10%–90% MFB, respectively.
The BMEP (bar) is expressed as follows

where T (N m) is the brake torque, and VH (L) denotes the engine total displacement volume.
The brake power, P (kW), is expressed as follows

where N is engine speed N (r/min).
The BSFC is expressed as follows (g/kWh)

where MA is the mass flow rate of intake air (g/h).
The brake thermal efficiency, BTE (%), is expressed as follows

where LHV is the lower heating value of fuel (MJ/kg).
Results and discussion
Comparisons between butanol–gasoline blends
The combustion characteristic varied with the butanol ratio and was compared with each other, as shown in Figure 2. It was found that B30 showed the highest peak cylinder pressure, resulting from the most advanced combustion phasing. The flame development period, major combustion duration, and MFB were calculated in order to further evaluate the combustion phasing of various fuels. During the ignition delay period, the laminar flame speed (LFS) affected the combustion rate significantly. 15 Due to the higher LFS of butanol than that of gasoline (see Table1), B10 and B30 got the shorter flame development period. However, the fuel volatility and charge cooling, which were influenced by the vapor pressure and latent heat of vaporization, respectively, also affected the flame development period. Gasoline had been shown having lower charge cooling relative to alcohol fuels.29,30 Additionally, Popuri and Bata 31 offered a rough value of 62–90 kPa at 37.8°C, which was much larger than that of butanol (2.2 kPa). Therefore, it needed longer time for butanol to get vaporized completely. 32 The reasons above could be employed to explain the increased flame development period for B60. The major combustion duration of the test fuels followed a similar trend to the flame development period. The cause could be demonstrated that the following major combustion duration could be influenced by the flame development period, while the combustion rate in the following flame propagation was promoted by the higher pressure built during the flame development period. Due to the shorter flame development period as well as major combustion duration, the 50% MFB location was advanced by 1°CA, 0.75°CA, and 0.75°CA for B30 compared to G100, B10, and B60, respectively.

Comparisons of combustion characteristic at Φ = 1 and 3-bar BMEP between G100, B10, B30, and B60: (a) pressure, (b) MFB, and (c) 0%–10% MFB, 10-90% MFB, and 50% MFB location.
The engine performance of G100, B10, B30, and B60, including BTE and BSFC, was compared with each other, as shown in Figure 3. The BTE indicates how well an engine can convert the heat in fuel into mechanical energy. According to the results in Figure 3(a), it was shown that G100 had the highest BTE for the following two facts that the engine was running at the spark timing of gasoline’s MBT, and besides, the advanced combustion phasing of butanol–gasoline blends led to the increase in work lost in compression process as well as the decrease in net useful work. However, a similar BTE to G100 was observed by B60 probably because the net work loss owing to improper combustion phasing was offset by the improved combustion quality owing to fuel-borne oxygen of butanol. As for the BSFC shown in Figure 3(b), it was increased by 5.0%, 10.3%, and 18.3% for B10, B30, and B60 compared to G100, respectively. Obviously, the butanol content of B60 among G100, B10, B30, and B60 is the highest, and the LHV of butanol is lower than gasoline, so B60 had the highest BSFC as well as G100 had the lowest, and besides, the higher the butanol content among these butanol–gasoline blends, the higher the BSFC.
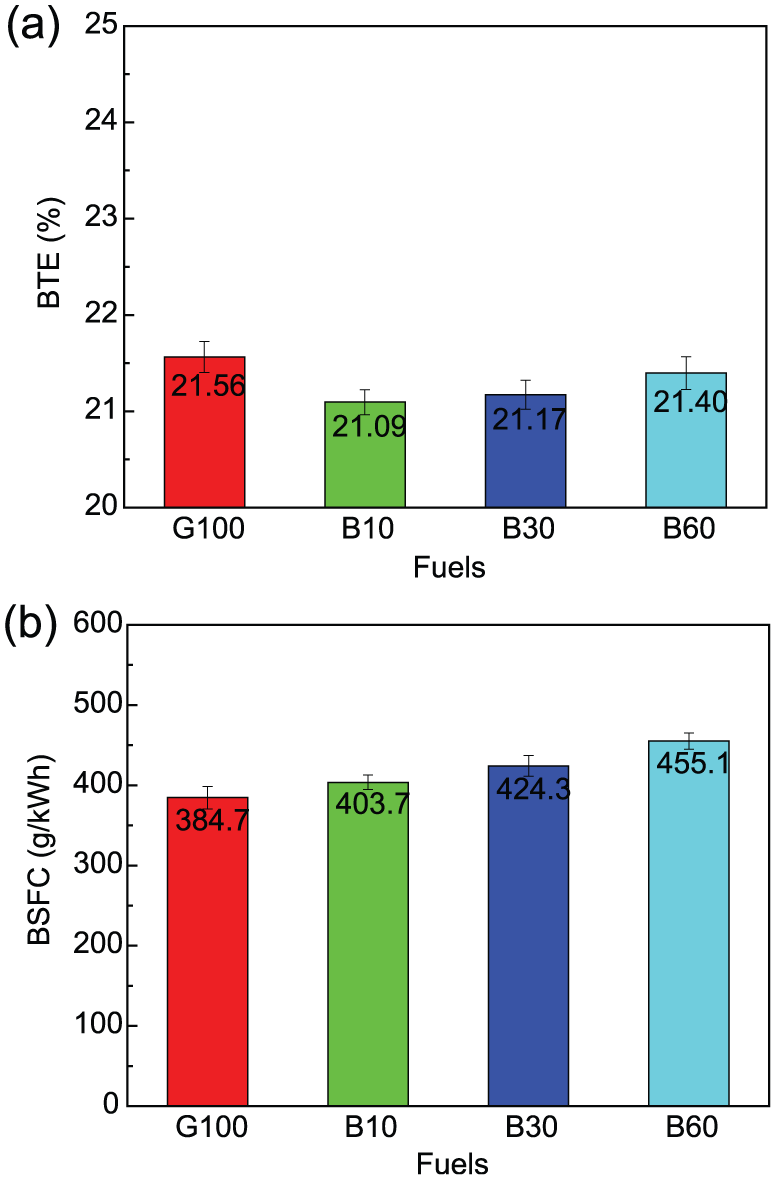
Comparisons of engine performance at Φ = 1 and 3-bar BMEP between G100, B10, B30, and B60: (a) BTE and (b) BSFC.
The CO, UHC, and NOX emissions and peakin-cylinder temperature of butanol–gasoline blends under different blending ratios were compared with each other, as shown in Figure 4. For B10 and B60, the CO emission was higher than that of G100 and B30. In general, conditions of locally rich, insufficient oxidizer or low combustion temperature could rise in a higher CO emission level. However, the lack of oxygen should not result in CO emission increasing after adding butanol. Previous studies concluded that more products could be produced by alcohol-containing fuels in terms of heat capacity of combustion products, which lowered combustion temperature and further slowed down the oxidation process of CO emission.32–34 UHC emission was primarily affected by the combustion quality. The oxygen content in butanol was beneficial to improve combustion quality, and as a result, B10 and B30 had a lower UHC emission than G100. However, the lower AFR of butanol also led to the more fuel injected, and as a result, more fuel got into the crevice volumes or was absorbed in oil layers and deposited, and the subsequent higher UHC emission of B60 appeared. 35 Zeldovich thermal activation was the predominating mechanism for NOX emission formation from IC engines. The higher combustion temperature and local oxygen concentration in the peak temperature zone were favorable to NOX emission formation. 36 For B10, NOX emission was 2.4% higher than that of G100. However, the NOX emission of G100 was 6.4% and 1.1% lower than that of B30 and B60, respectively. Najafi et al. 37 and Zhuang and Hong 38 had reported that oxygenated fuels could increase the NOX emission due to the fuel self-provided oxygen. The balance between fuel self-provided oxygen and reduced combustion temperature (see Figure 4(d)) could be employed to explain the various NOX emission levels in this part.
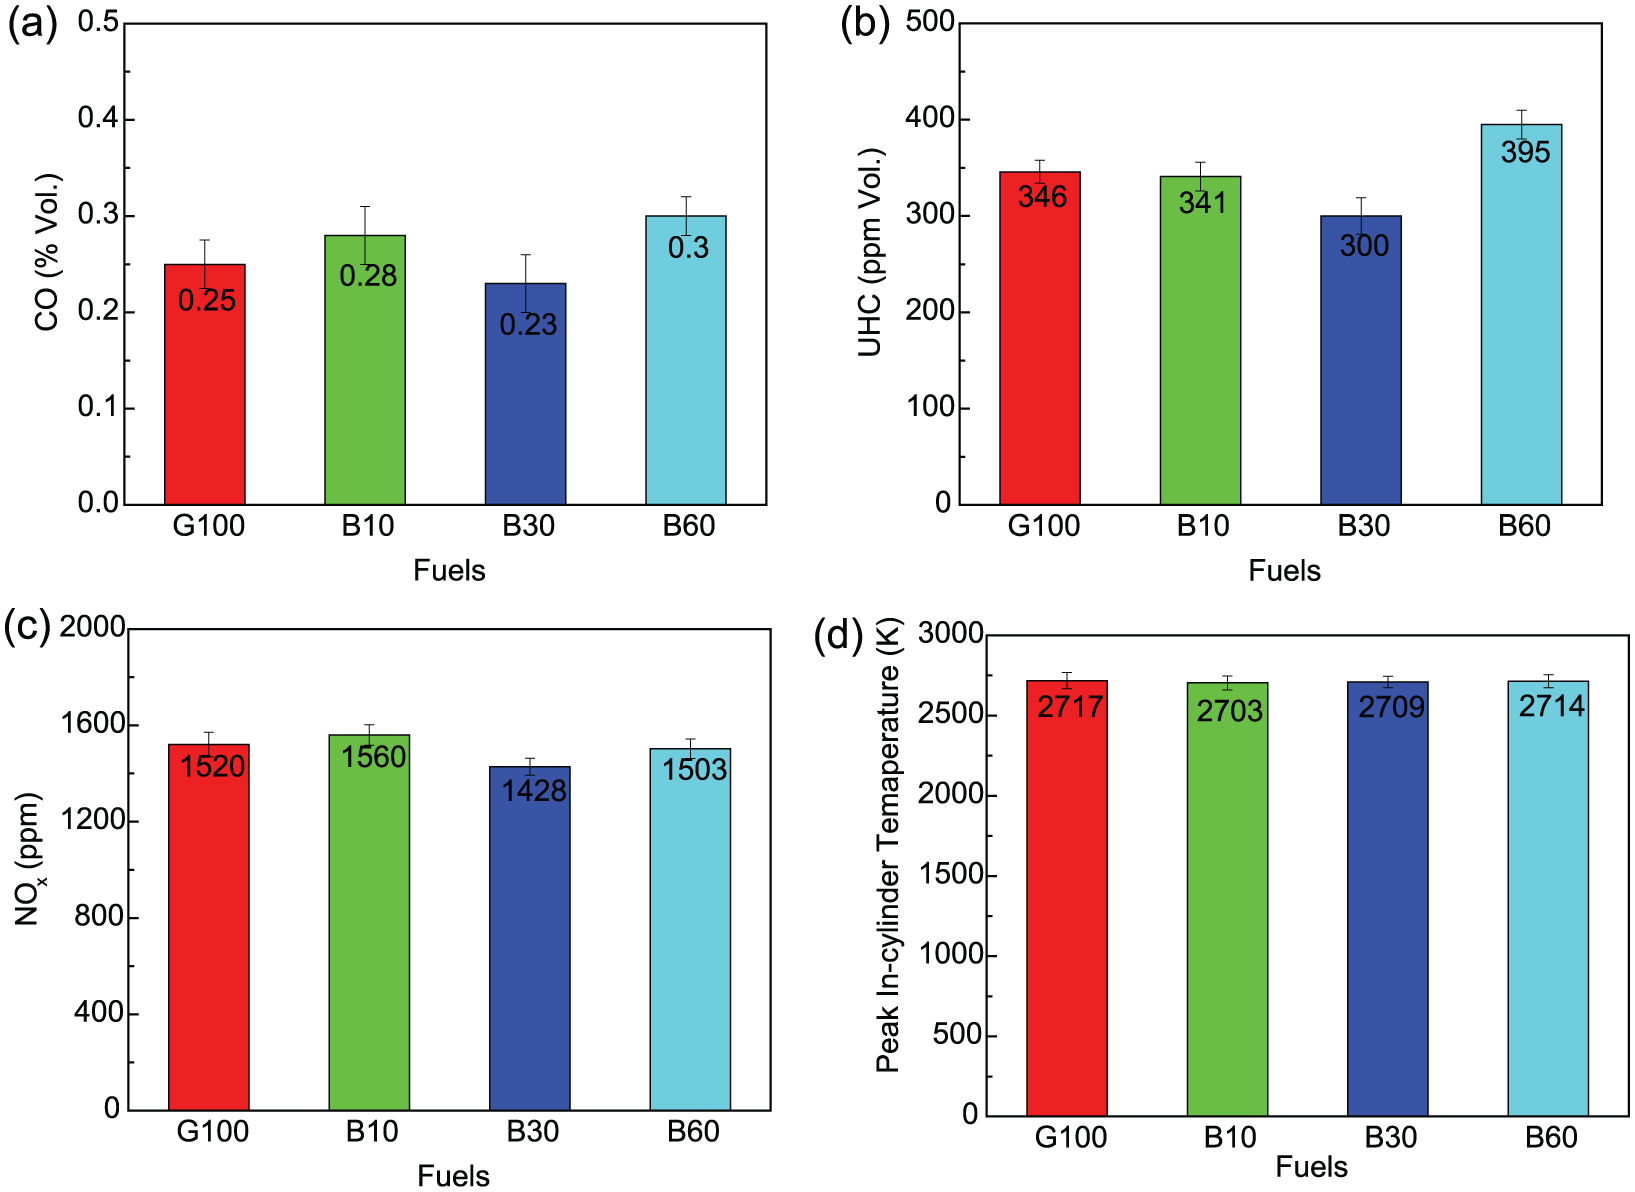
Comparisons of emissions and peak in-cylinder temperature at Φ = 1 and 3-bar BMEP between G100, B10, B30, and B60: (a) CO, (b) UHC, (c) NOX and (d) peak in-cylinder temperature.
Comparisons between conventional alcohol alternative fuels
According to the results mentioned above, B30 performed well in the perspective of engine emissions. In this part, it was compared with conventional alcohol alternative fuels, including M30 and E30. The pressure traces of three fuels were shown in Figure 5(a). It was found that a similar pressure trace and combustion phasing was obtained by these fuels. As shown in Figure 5(b) and (c), compared to E30, the same flame development period and major combustion duration were obtained by M30, while 2.0% longer flame development period and 1.5% shorter major combustion duration were obtained by B30. Although methanol had a higher LFS (see Table 1) and vapor pressure calculated by Antoine equation (see Figure 6), the higher latent heat also existed, and thus, M30 was finally caused to have the same flame development period as E30. The extraordinary lower vapor pressure of butanol probably led to the longer flame development period of B30. For the 50% MFB location, E30 got 0.25°CA and 0.5°CA advanced relative to M30 and B30, respectively.

Comparisons of combustion characteristics at Φ = 1 and 3-bar BMEP between M30, E30, and B30: (a) pressure, (b) MFB, and (c) 0%–10% MFB, 10%–90% MFB, and 50% MFB location.

Saturation vapor pressure of methanol, ethanol, and butanol.
As shown in Figure 7, the similar BTE was obtained by different alcohol blends based on the similar combustion phasing and cylinder pressure. The differences in combustion phasing and cylinder pressure of M30, E30, and B30 were slight, and thus, their difference of BTE was also slight. Moreover, the LHV of methanol, ethanol, and butanol is 20.0, 26.8, and 33.1 MJ/kg, respectively, and all the alcohol contents of these alcohol–gasoline blends are equal to 30%, so M30 had the 6.5% and 11.4% higher BSFC relative to E30 and B30, respectively, owing to the lowest LHV.
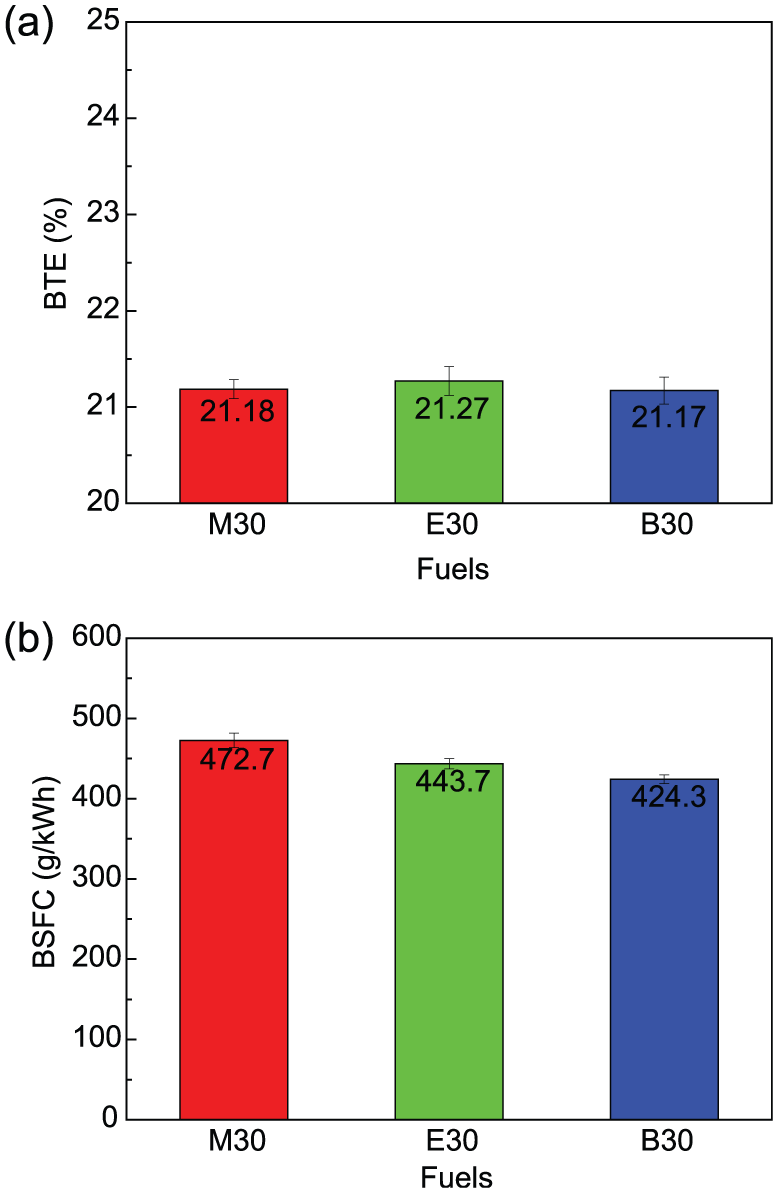
Comparisons of engine performance at Φ = 1 and 3-bar BMEP between M30, E30, and B30: (a) BTE and (b) BSFC.
As shown in Figure 8, the emissions and peakin-cylinder temperature for different alcohol blends were compared. The CO emission of E30 significantly increased and was 36% and 26% higher than that of M30 and B30, respectively. Additionally, UHC emission of M30 increased and was 22.5% and 18% higher than that of E30 and B30, respectively, which might be as a result of the more injected fuel due to the lower AFR. As for NOX emission, the similar result was obtained by different fuels. As is known to all, the LHV of these alcohols is lower than gasoline, but their oxygen content is higher, the heat value of all these alcohol–gasoline blends will be nearly equal to the gasoline, and thus, their peak cylinder temperature difference (see Figure 8(d)) will be slight, and the difference of their NOX emission will be very close to each other.
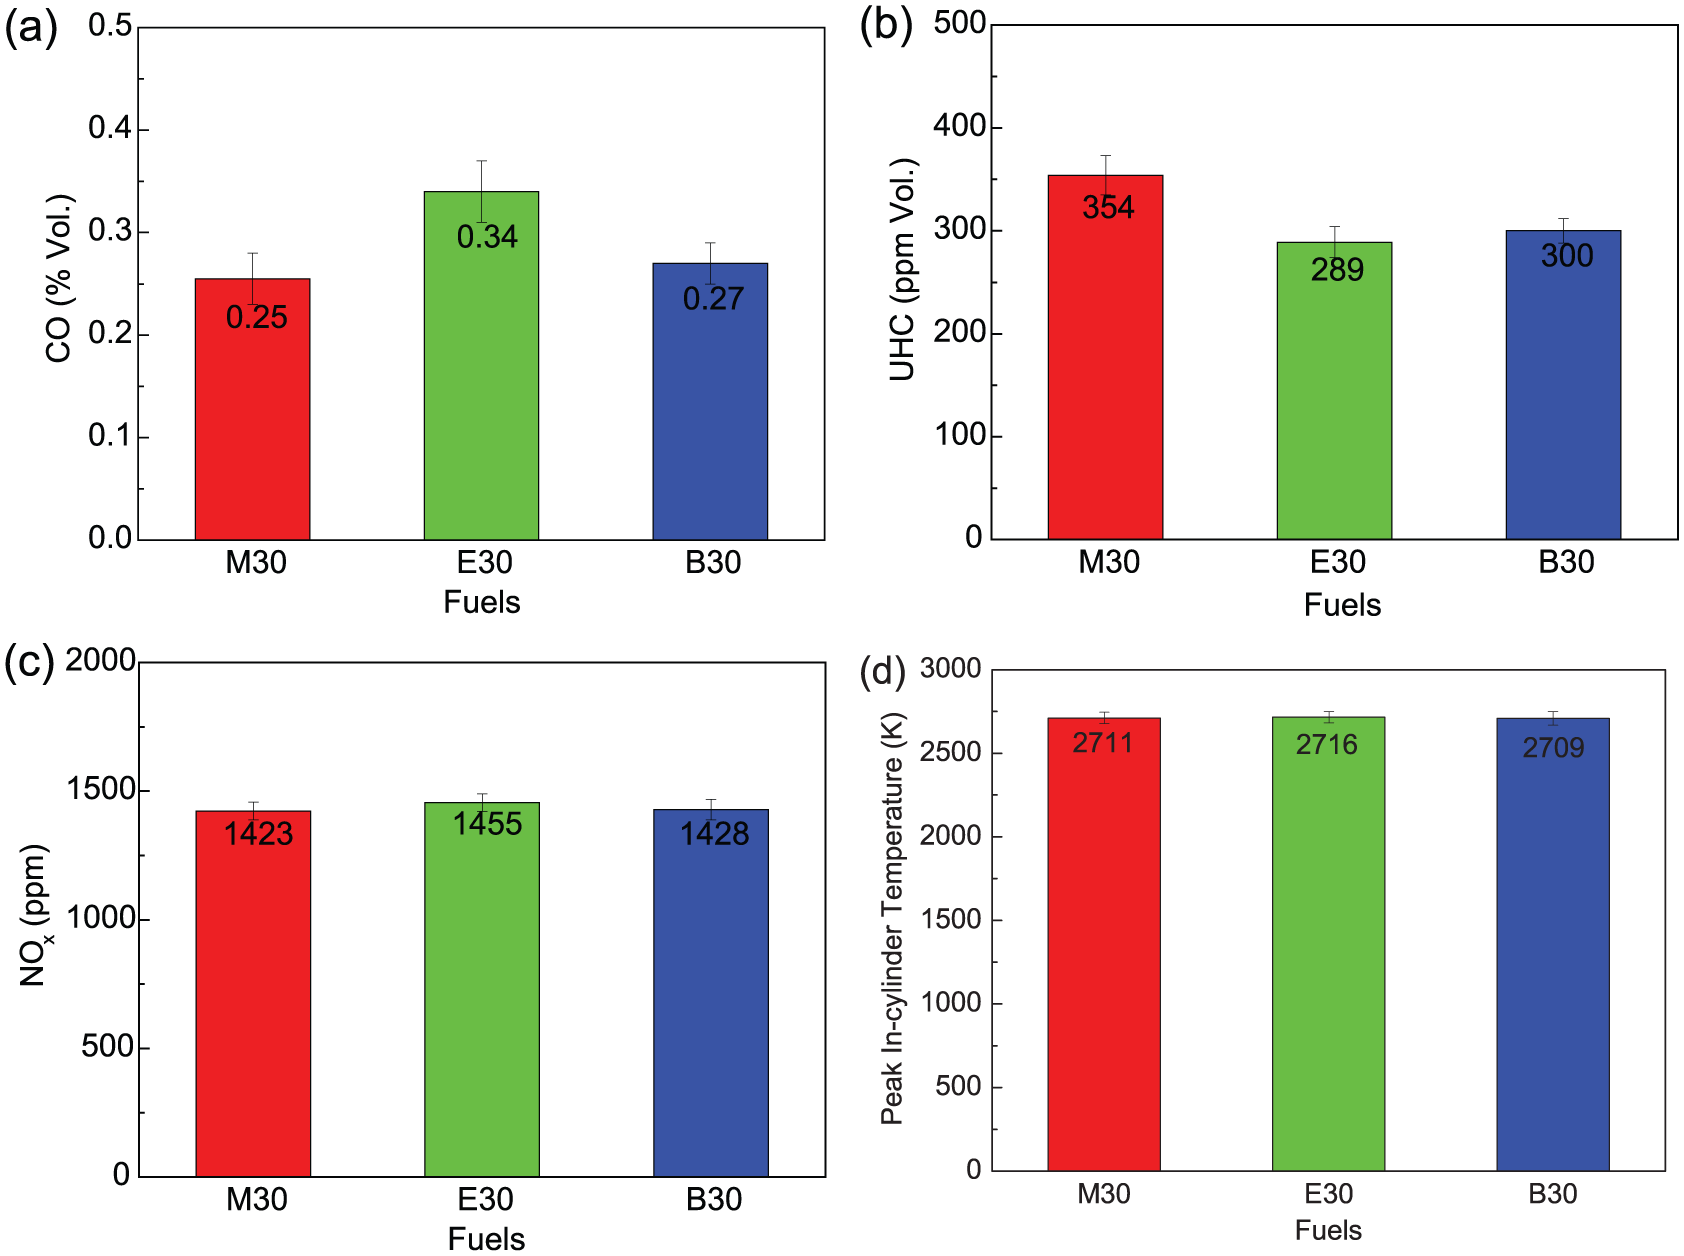
Comparisons of emissions and peak in-cylinder temperature at Φ = 1 and 3-bar BMEP between M30, E30, and B30: (a) CO, (b) UHC, (c) NOX, and (d) peak in-cylinder temperature.
Comparisons between B30 and G100 under various equivalence ratio and engine load
In this part, the combustion characteristic of B30 was compared with G100 under the equivalence ratios from 0.83 to 1.25 and the engine loads of 3 and 5-bar BMEP, as shown in Figure 9. It was found obviously that the flame development period and major combustion duration decreased with the increase in equivalence ratio and engine load. A higher cylinder temperature was obtained in the high engine load, which resulted in a faster combustion rate. Gauthier et al. 39 had also found that ignition delay would decrease with the increase in equivalence ratio. Moreover, with the increase in equivalence ratio and engine load, the differences of ignition delay and major combustion duration between different fuels would be reduced, which was in accordance with those of Gauthier et al. 39 and Heywood. 40 In summary, compared to G100, B30 had a more advanced combustion phasing as a result of its higher LFS and presented the 2.0%–11.4% shorter flame development period and the 1.8%–13.8% shorter major combustion duration, respectively.

Comparisons of combustion characteristics under various equivalence ratio and engine load between B30 and G100: (a) 0%–10% MFB and (b) 10%–90% MFB.
The BTE and BSFC of B30 were compared with G100 under the equivalence ratio from 0.83 to 1.25 and the engine load of 3 and 5-bar BMEP, as shown in Figure 10. The BTE increased with the decrease in equivalence ratio and increase in engine load. The higher cylinder temperature at 5-bar BMEP improved the combustion quality and resulted in higher BTE. When equivalence ratio decreased, the increased dilution would improve isentropic efficiency by lowering temperatures and increasing adiabatic index (γ). 41 G100 had a 0.3%–2.8% higher BTE than B30 based on the fact that the engine was running at the spark timing of gasoline’s MBT, and the advanced combustion phasing of B30 led to a more net work loss at compression stroke as mentioned above. Moreover, it should be noted that the difference of BTE would be reduced with the decrease in equivalence ratio. As a result of the decreased BTE, the BSFC increased with the increase in equivalence ratio and decrease in engine load. Due to the lower LHV, B30 presented a 7.7%–11.3%, higher BSFC than that of G100.

Comparisons of engine performance under various equivalence ratio and engine load between B30 and G100: (a) BTE and (b) BSFC.
The CO, UHC, and NOX emissions and peak in-cylinder temperature with various equivalence ratio and engine load for B30 and G100 were compared, as shown in Figure 11. It was found that the equivalence ratio controlled CO emission till the lean condition was reached, and then the CO emission did not vary remarkably. There was more than enough oxygen available to carry on the oxidation process, and as a result, the CO emission under the lean condition was low. 42 Compared with G100, CO emissions of B30 decreased by 2.3%–8.7% at 3-bar BMEP due to the increased oxygen content, while increased by 2.6%–41.3% at 5-bar BMEP due to the decreased combustion temperature and shorter major combustion duration. On the other hand, for the incomplete combustion as the combustion quality deteriorates, UHC emission increased under the rich condition. 42 B30 presented a 12.4%–27.5% lower UHC emission due to the improved combustion quality as a result of fuel-borne oxygen. It was found from Figure 11(c) that the highest NOX emission occurred at Φ = 0.9–1.0, and the NOX emission decreased as the equivalence ratio got relatively richer or leaner because the complete combustion approaches were obtained under Φ = 0.9–1.0 which led to a higher peak combustion temperature. 18 Similarly, at the engine load of 5-bar BMEP, the higher NOX emission was produced resulting from the higher cylinder temperature. In comparison with G100, a decreased combustion temperature (see Figure 11(d)) was also caused, so that the final 2.8%–19.6% lower NOX emission was produced, although a more oxygen concentration was offered.
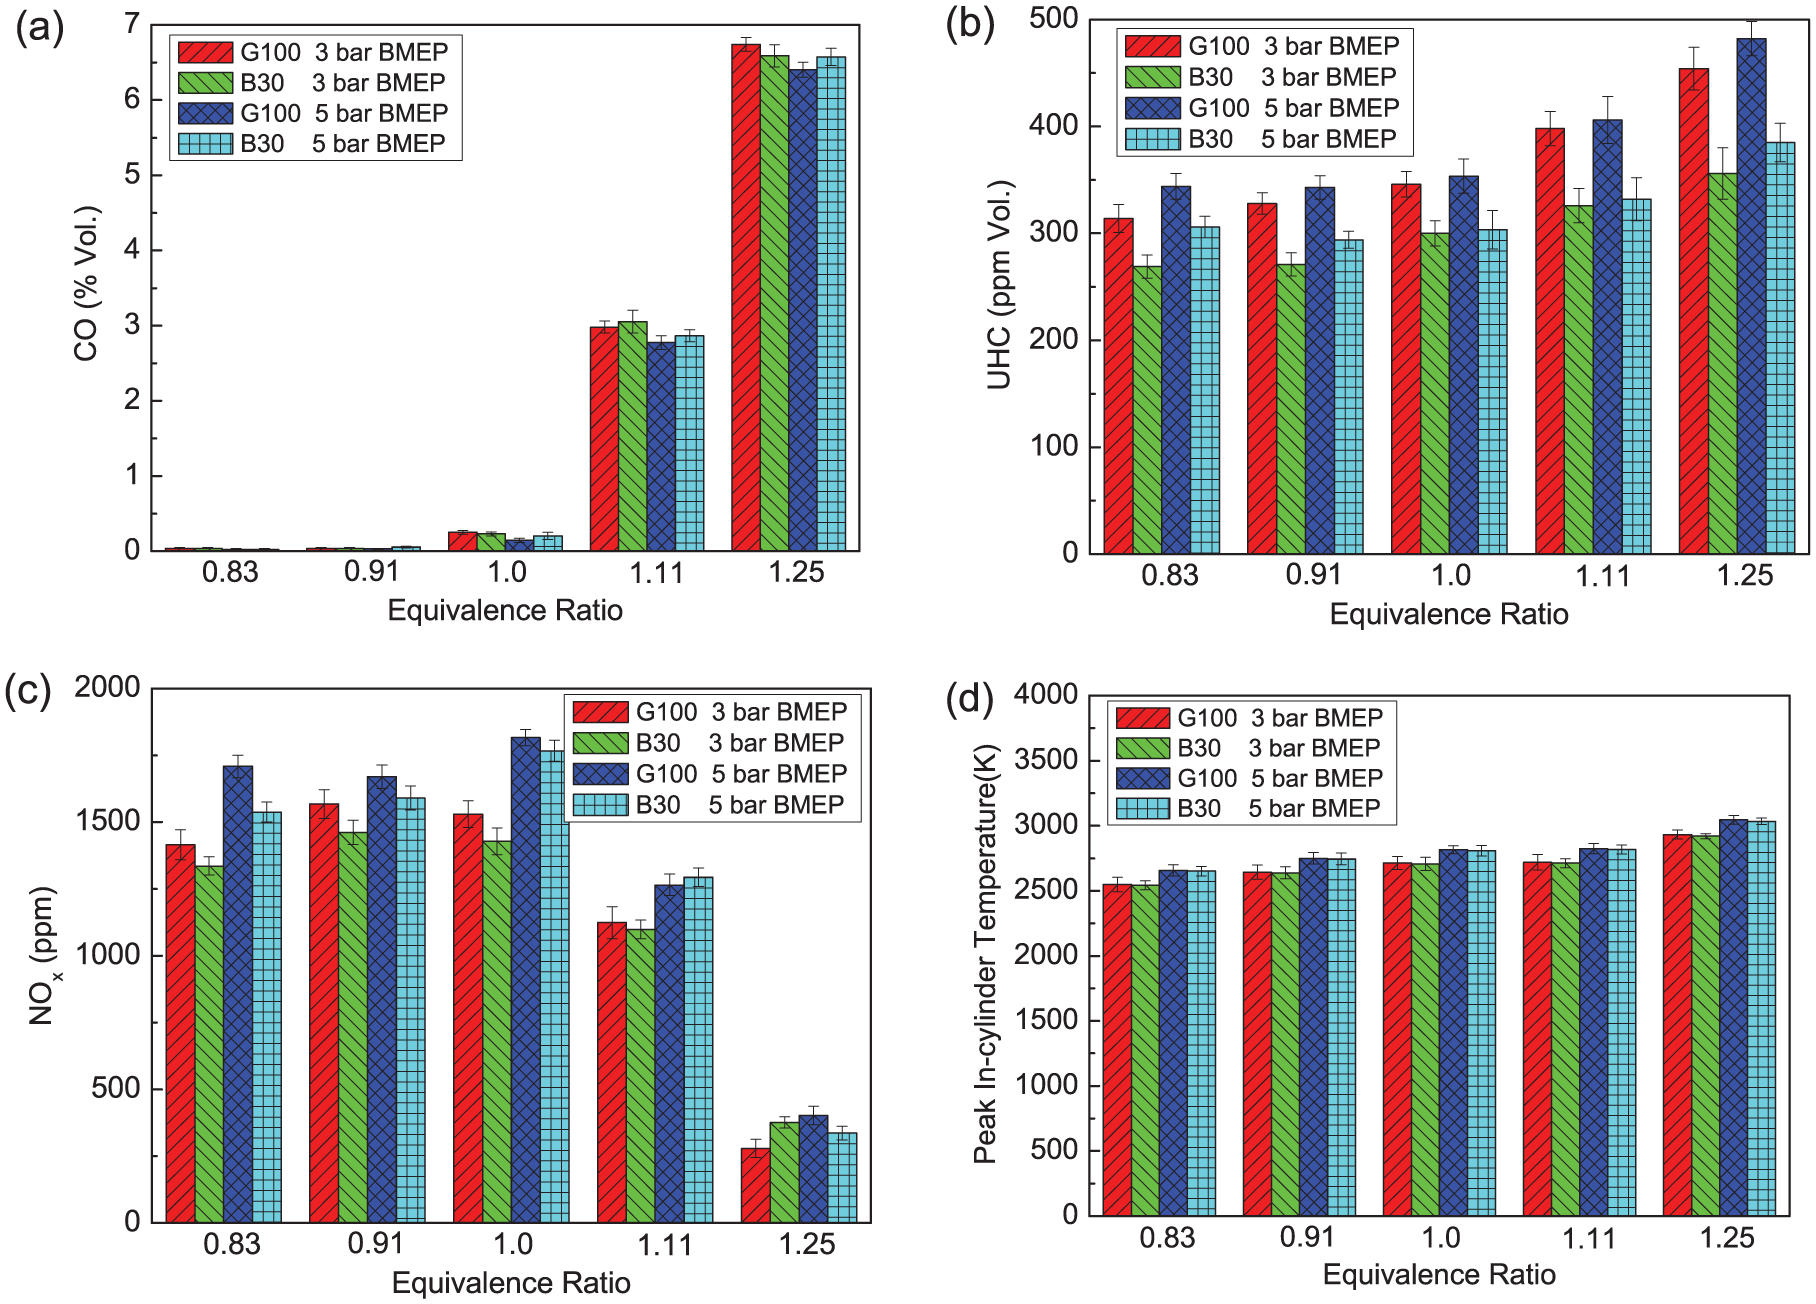
Comparisons of emissions and peak in-cylinder temperature under various equivalence ratio and engine load between B30 and G100: (a) CO, (b) UHC, (c) NOX, and (d) peak in-cylinder temperature.
Conclusion
In this article, the conjoint analysis of combustion, performance, and emissions characteristics of an SI engine fueled with butanol–gasoline blends was carried out through the experimental investigation. Some conclusions were obtained as follows:
Through the experimental study on butanol–gasoline blends with various butanol ratio under stoichiometric condition, it was found that B10 and B30 presented an advanced combustion phasing with the shorter flame development period and major combustion duration when compared with G100. The reduction in BTE was caused by the butanol addition as the engine was running at the spark timing of gasoline’s MBT and the improved combustion quality due to fuel-borne oxygen could not offset the decreased BTE caused by improper combustion phasing of butanol–gasoline blends. B30 provided better results based on its similar BTE as well as the lower CO (8.7%), UHC (15.3%), and NOX (6.4%) emissions than those of G100, in comparison with different butanol–gasoline blends.
A similar combustion phasing was shown with the comparisons between alcohol alternative fuels including M30, E30, and B30, which also resulted in a similar BTE. Due to the highest LHV, B30 had the lowest BSFC. A significant increase in CO and UHC emissions occurred for E30 and M30, respectively. Besides, as for NOX emission, the similar result was obtained by different fuels.
For the different butanol–gasoline blends mentioned above, B30 performed well for the engine performance and emissions, and thus, it was further compared with G100 under various equivalence ratio and engine load. B30 presented a generally advanced combustion phasing, which led to a 0.3%–2.8% lower BTE than that of G100. Therefore, the sparking timing should be postponed when the engine fueled with butanol–gasoline blends. For the emissions, the lower CO (2.3%–8.7%), UHC (12.4%–27.5%), and NOX (2.8%–19.6%) emissions were shown for B30 in comparison with G100.
Footnotes
Acknowledgements
The author Yu Li would also like to thank the China Scholarship Council (CSC) for providing a visiting scholarship in the United States throughout the project [2013]3009.
Academic Editor: Oronzio Manca
Declaration of conflicting interests
The author(s) declared no potential conflicts of interest with respect to the research, authorship, and/or publication of this article.
Funding
The author(s) disclosed receipt of the following financial support for the research, authorship, and/or publication of this article: This work was supported by the National Natural Science Foundation of China under grant nos 51176045, 51276056, and 91541121.