
Abstract
Drastic flatness changes in high-strength steel strips during water quenching cause problems for both their subsequent manufacture and final products. In this work, a temperature–microstructure–stress coupled finite element model is established to simulate the quenching process of cold-rolled high-strength steel strips using a UMAT subroutine in ABAQUS. The evolution mechanisms of two main forms of flatness defects, including C warping defect and edge wave defect, are investigated. Our simulations reveal that the temperature gradients of the strips induce their extension differences along transversal/thickness direction and the sequential phase transformation, both of which finally cause the flatness changes. Furthermore, flatness control strategies are proposed according to the integrated effects of the tension and initial temperature differences during quenching. In addition, quenching experiments are implemented to validate the numerical results.
Introduction
As a high added-value product in the steel industry, high-strength steel is widely used in aviation, aerospace, shipping, oil pipelines, bridges, automobiles, and so on. 1 In addition, heat treatment, especially the quenching process, is the key process for improving steel strength and hardness and obtaining good mechanical properties.2,3 Before and after the quenching process, cold-rolled high-strength steel strips often have buckling and warping defects, 4 which are collectively called flatness defects. Materials such as tool steel may provide a quick fix during subsequent cryogenic treatment. 5 However, for quenched high-strength steel strips and plates, serious flatness defects are usually permanent and the operation stability during subsequent production processes, reducing the quality of the products.
To study the mechanisms and characteristics of deformation, finite element modeling (FEM) is widely used for numerical simulations of heat treatment. Li et al.6,7 developed an FE method for a quenching process simulation considering the correlated effects of temperature, stress, and phase transformation. Segurado et al. 8 implemented a multi-scale simulation for plastic deformation, in which polycrystalline microstructures were considered. Şimşir and Gür9,10 developed an FEM-based mathematical model that can predict temperature history, phase evolution, and internal stresses. Macroscopic deformation pattern simulations have become increasingly accurate. The microstructure evolution model and the rate–temperature–microstructure-dependent elastic–plastic constitutive model have been implemented in ABAQUS through the user material subroutine VUMAT for studying the hot rolling process of Ti–6Al–4V large rings. 11 Wang et al. 12 studied the changes and distribution rules of the temperature field during laser quenching of 20CrMnMo gears. The initiation and growth of surface defects on the strips during the hot rolling process and the temperature and strain fields during warm rolling were analyzed using a three-dimensional (3D) FEM with constrained node failure 13 and a mathematical model based on a two-dimensional model, respectively. 14
Several studies have focused on steel strip heat treatment to determine the mechanisms that change the sample flatness. Guo et al. 15 conducted a temperature field simulation for the steel roller quenching process and showed that severe temperature changes could cause large temperature differences and different cooling speeds in the thickness direction, eventually causing warping defects. Liu et al. 16 conducted a numerical simulation for the temperature, stress, and strain fields in the quenching process and proposed an optimal flow ratio for the upper and lower nozzles. Lequesne et al. 17 developed a 3D temperature–microstructure–stress multi-field coupling simulation for the roller quenching process of thick steel plates and revealed the inaccuracies of the two-dimensional plane strain model because the transverse residual stress was not considered. To control the flatness of steel strips and plates, Fall et al. 18 developed tools to control the flatness after quenching and tempering in industrial applications. Qiao et al. 19 stabilized the flatness of thin steel plates using reasonable quenching parameters. Zhang et al.20,21 attributed the buckling phenomenon to transverse-induced compressive stresses caused by local longitudinal uneven stretching of steel strips and analyzed the critical conditions of flatness and buckling for steel plates under high temperatures in an annealing furnace. Dai and Zhang 22 developed an analytical solution for the post-buckling path of the central wave buckling problem. Yang 23 believed that flatness defects originated from unevenness in the horizontal and longitudinal cooling during the rapid cooling process. Good quenching flatness has been obtained by controlling the upper and lower nozzle water volume, water pressure, and roller speed. However, few studies of the mechanisms of flatness defects during the high-strength steel strip-quenching process exist.
The above scholars indicated that many factors affect the strip flatness during the cooling process, and their mechanisms are complicated. Moreover, the flatness change mechanism and the characteristics of the initial flatness defects during the quenching process have not been reported. Therefore, comprehensive research is conducted here that considers the coupling mechanism of the thermal conduction behavior, phase-change behavior, and mechanical behavior during the steel strip-quenching process.
Finite element implementation of quenching process
Quenching is a technological process with a coupled material temperature field, microstructure field, and stress–strain field. During the continuous water quenching process, the steel strip temperature rapidly cools to the sink temperature with dramatic changes in the internal microstructure. During the industrial water injection cooling process of thin steel strips, the transformation from austenite to martensite is the main phase change considered. The strip is subjected to shrinkage distortions during the cooling process and phase-change swelling deformations due to the specific volume difference between the austenite and martensite. 24
Temperature, microstructure, and stress coupled model
Heat transfer of the strip is an unstable process. In order to put phase transformation and heating effect of deformation into consideration, Fourier heat conduction differential equation is used in this model

where T is the temperature, t is the time,
To model the microstructure evolution, the theoretical Koistinen–Marburger model is used to describe the martensitic transformation kinetics. The martensitic transformation is a non-diffusive transformation. The model is defined as

where
The expansion coefficient of martensitic phase transformation is as below

where
Quenching experiment is carried out by Gleeble 3500 thermal simulation test machine to determine the value of the parameters from equations (2) and (3). The specimen size and experiment process are shown in Figure 1(a) and (b), respectively. Figure 1(c) shows the change rate of specimen width varies with temperature. In this figure, the martensite start temperature

Quenching experiment of 22 MnB5 steel: (a) specimen size, (b) flow of quenching process, (c) width change during quenching, and (d) martensite volume fraction change during quenching.
Also, the influence of temperature change and phase transformation on mechanical properties as elasticity modulus, yield strength, as well as the thermal property like thermal expansion coefficient is considered to obey the rule of mixture

where
Constitutive relationship
The uneven thermal strain, phase transformation strain, and phase transformation plasticity due to the temperature reduction time difference and temperature difference between the strip edge and the center must be considered.25,26 Therefore, the strain increment of the material can be expressed as the sum of the elastic strain increment, plastic strain increment, thermal strain increment, transformation strain increment, and transformation plasticity strain increment 27

where
Modeling of flatness defects
The expressions of four steel strip flatness defects are as follows
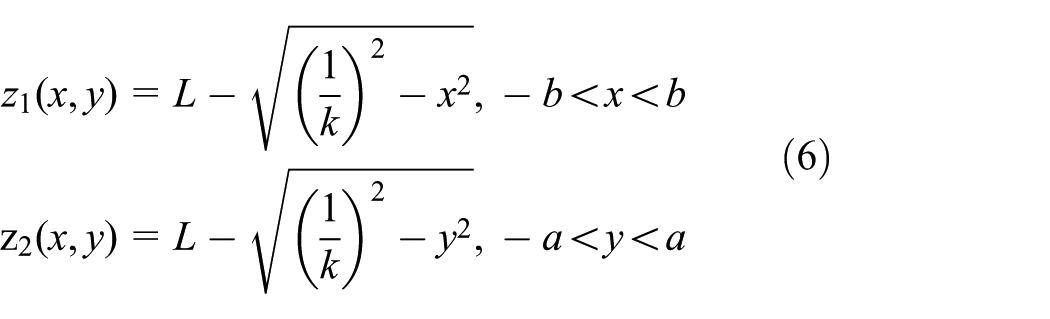

where
Figure 2 shows the four types of initial flatness defects in the FE models. For the steel plate with edge wave defects, 1/2 of the steel plate is considered to be symmetrical for modeling. For the steel plates with C warping, L warping, and central wave defects, the overall model of the steel plate is established. The surface heat exchange conditions are applied on the top and bottom surfaces of the steel strip (Table 1).

FE models of strip defects: (a) C warping, (b) L warping, (c) edge wave, and (d) central wave.
Modeling parameters.

Assumptions for the model are as follows:
The steel strip remains static; environment temperature and boundary condition of heat transfer are defined to simulate the water quenching.
The steel strip is isotropous.
Coefficient of heat transfer between steel strip and the water is only related to the temperature. The relationship is given in Figure 3.

Heat transfer coefficient between steel strip and the water.
The changing rates of the warping height, wave height, wave length, and wave width are used to quantify the defect evolution.
Elastic–plastic verification of the model
To validate the FE model, the comparison between simulated and experimental results under one same isothermal tensile test condition is analyzed.
The isothermal tensile test of 22 MnB5 steel at 600°C, 700°C, 800°C, and 900°C is conducted using Gleeble 3500 thermal simulated test machine. Heating and tensile process is shown in Figure 4(a). The size of the specimen is the same as the quenching experiment shown in Figure 1. Extensometer is used to record width change in the sample in order to calculate strain.

Experiment and simulation of the isothermal tensile test: (a) experimental procedure and (b) FE model.
Meanwhile, a symmetrical 3D FE model of the specimen shown in Figure 4(b) is established using the constitutive model above to simulate the isothermal tensile test. The tensile process is conducted by longitudinal movement of the pin, which is defined as a discrete rigid body. Symmetric and transversal restraint is, respectively, applied to each side of the specimen. The strain in FE model is calculated from change rate of the specimen width.
Figure 5(a) and (b) shows the simulated and experimental stress. It can be seen that the simulated results agree with the experimental results.

Experimental and simulated results of isothermal tensile experiments: (a) austenite and (b) martensite.
Results and discussion
Evolution of warping defects during the quenching process
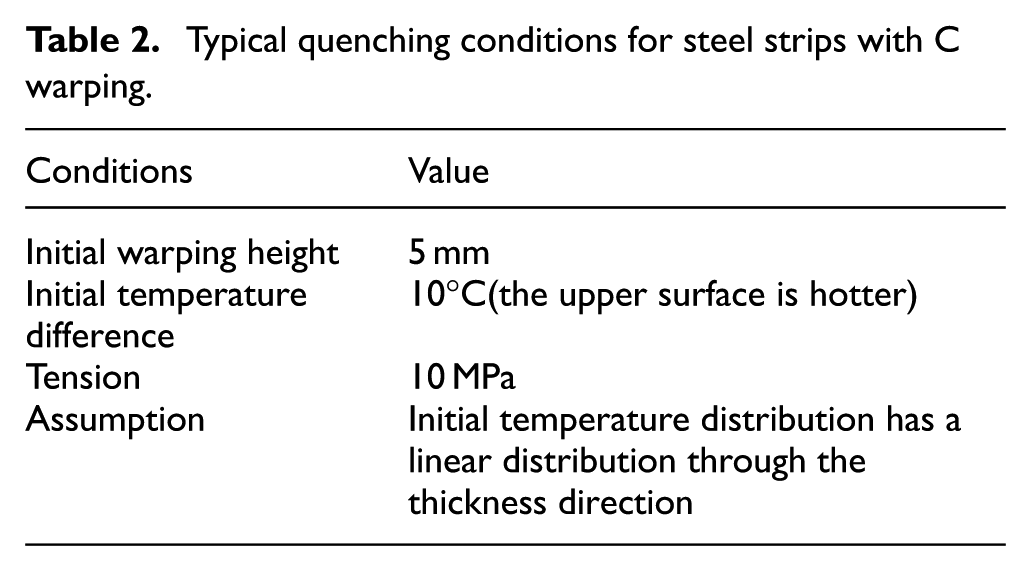
Typical working conditions were selected for simulating the flatness evolution of high-strength steel plates with initial warping defects during the quenching process (Table 2).
Typical quenching conditions for steel strips with C warping.
When observing the quenching process of the whole steel strip, the martensitic transformation appears on the surface of the steel strip after 0.754 s and is practically completed 1 s later, as shown in Figure 6(a). In this work, the quenching process is divided into three stages: in stage I, the steel strip rapidly decreases from a high temperature to the martensite start temperature, the steel strip is not subject to martensitic transformation, and the time interval corresponding to this process is 0–0.754 s; in stage II, the strip is subject to martensitic transformation and the time interval corresponding to this process is 0.754–1 s. In stage III, the martensitic transformation of the strip is completed, and the time interval corresponding to this process is 1 s to the end of the quenching process. Figure 6(b) presents the curve of the C warping height with time. The C warping height first increased by 3.12% and then slowly decreased by 1.00% during stage I. Then, the C warping rapidly decreased by 1.36% and fluctuated during stage II before slightly decreasing and then remaining unchanged during stage III.
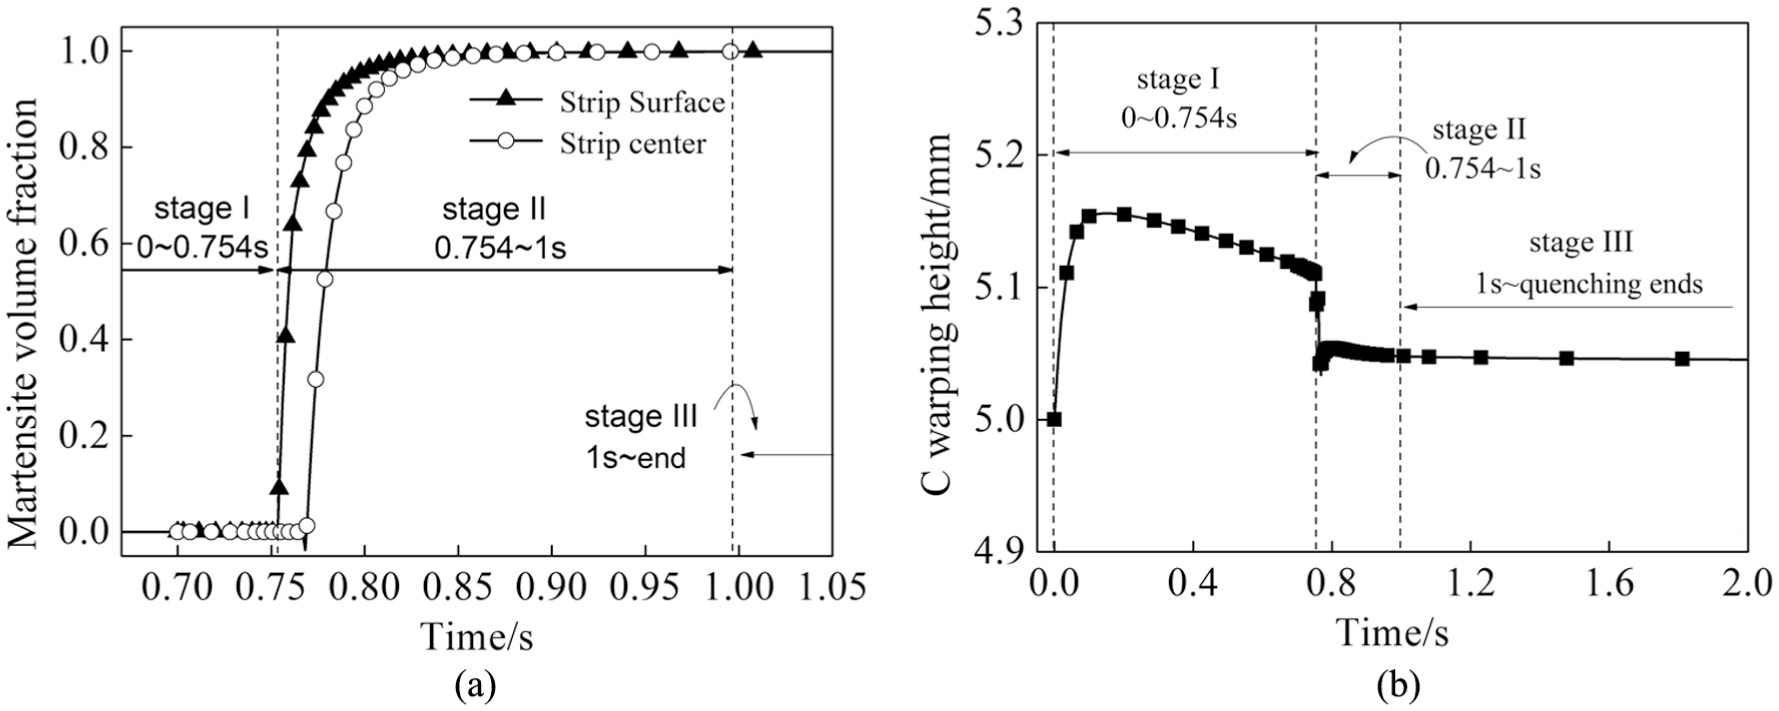
Changes in martensite volume fraction and warping height during quenching process: (a) martensite volume fraction and (b) C warping height.
Figure 7(a) shows the changes in the thermal strain difference between the top and bottom surfaces of the steel strip and the C warping height within 0–0.18 s during stage I. The thermal strain of the bottom surface is greater than that of the upper surface, and the difference between the two surfaces constantly decreases, which leads to an increase in the C warping height by 3.12% during this stage.

Changes in the strain differences and C warping heights with time during different stages of the quenching process: (a) stage I, (b) stage II, and (c) stage III.
Figure 7 (b) shows the changes in the thermal strain difference, transformation strain difference, and transformation plastic strain difference between the top and bottom surfaces with time during stage II. The thermal strain difference between the top and bottom surface slightly increased by 1.92% during this stage, the transformation strain difference decreased by 99.86%, and the longitudinal transformation plastic strain difference changed non-monotonically by 28.08% while fluctuating from 0.754 to 0.77 s, which may be related to the internal stress changes. Under the comprehensive impact of the thermal strain, transformation strain, and longitudinal transformation plastic strain, the C warping height fluctuates and finally decreases by 2.27%.
The martensitic phase in the steel strip is fully transformed during stage III. During this period, the strain difference and longitudinal transformation plastic strain difference for the steels strip are both equal to 0, and the main factor affecting the flatness warping changes in the steel strip is the thermal strain difference due to the temperature gradient. Figure 7(c) shows the changes in the thermal strain difference between the top and bottom surfaces of the steel strip during stage III of the quenching process with time. It can be seen from the figure that the thermal strain difference in stage III is slight, and the C warping height slightly decreases by 0.14%.
The final C warping height of the steel strip is greater than the initial warping height, with a change rate of −0.81%, indicating that the initial C warping defect of the steel strip after quenching is more severe than before quenching.
As a conclusion, the C warping changes result in uneven total strain change along thickness direction of the strip, which consists of elastic strain, plastic strain, thermal strain, transformation strain, and transformation plasticity strain. Concerning about the evolution mechanism, it is known from this work that before and after the martensitic transformation, the C warping evolution mechanism is no different from other cooling or heating process. The uneven thermal strain caused by uneven temperature distribution finally changes the C warping defect. But during the martensitic phase transformation, the longitudinal transformation plastic strain differs along the width direction of the strip primarily changing the warping.
Evolution of the warping defects under different quenching conditions
The impact of the initial temperature difference and tension on the warping height change rate after quenching is shown in Figure 8. The C warping height change rate increases when the initial temperature difference increases in the thickness direction. In addition, the tension has a considerably limited impact on the C warping change.

Impact of the initial quenching conditions on the C warping after quenching: (a) initial temperature difference and (b) tension.
To propose control countermeasures for C warping defects during actual production, it is important to study the coupled impacts of the existing process parameters on the C warping height change rate. For the common steel strip specifications used in actual production (1 mm thickness and 5 mm warping height), the joint control measures of the tension and initial temperature differences can be used to obtain better flatness. As shown in Figure 9, the dotted line is the zero line, and the parameters above the dotted line can improve the initial C warping defects. These results provide guidance for practical quenching lines in industry.

Change rate of the C warping height after quenching under various control measures.
L warping defects generally exist in offline steel strips and are mainly characterized by longitudinal warping in the rolling direction of the steel plate. Since the steel strip is offline, the steel strip is not subjected to tension, and the main factor affecting warping is the initial temperature difference in the thickness direction.
The impact of the initial temperature difference in the thickness direction on the steel strip L warping defect change rate is shown in Figure 10. The L warping height change rate after quenching increased with the initial temperature difference in the thickness direction of the steel strip. The above simulation shows that a control policy with a positive initial temperature difference in the thickness direction can be used to control the steel plate flatness during the production of steel plates with initial L warping defects and an upward warping direction.
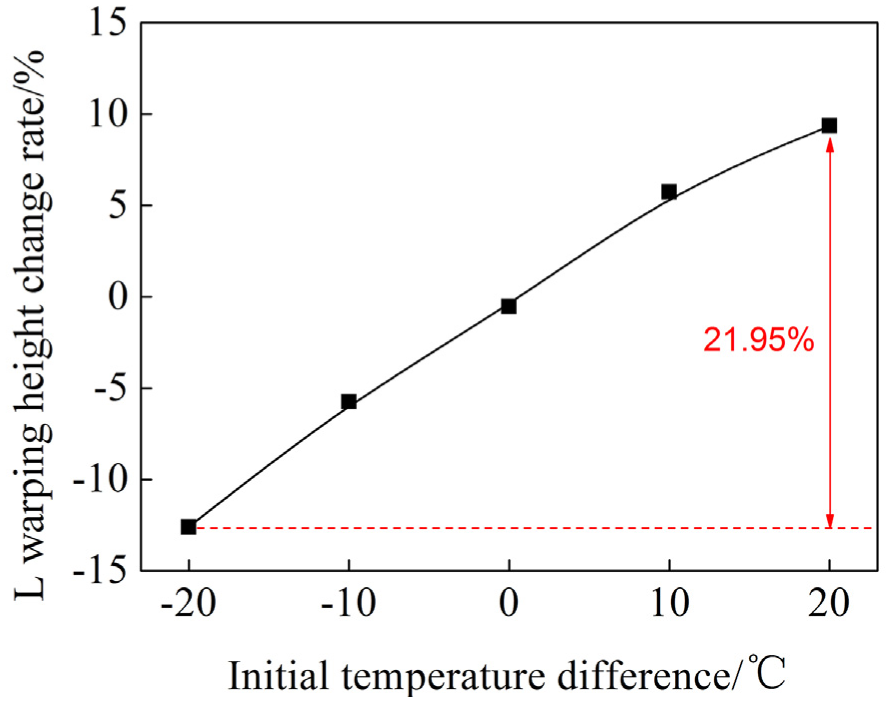
Impact of the initial temperature difference in the thickness direction on the L warping height change rate after quenching.
Evolution of buckling defects in quenching process
Typical working conditions are selected for simulating the flatness evolution of a steel plate with initial edge wave defects during the quenching process (Table 3).
Typical quenching conditions of a steel strip with edge waves.

Figure 11(a) shows the martensitic phase transformation process on the surface of the steel plate throughout the entire quenching process. The transformation starts in the middle of the surface after 0.774 s and at the edge of the surface after 0.809 s. Therefore, the quenching process is divided into three stages. In stage I, the plate temperature falls to the martensite start temperature and the martensitic transformation does not occur in the middle or at the edge within the time interval of 0–0.774 s. In stage II, only martensitic transformation occurs in the middle of the steel plate within the time interval of 0.773–0.809 s. In stage III, martensitic transformation appears at both the edge and the middle of the plate, within the time interval from 0.809 s to the end of the quenching process.
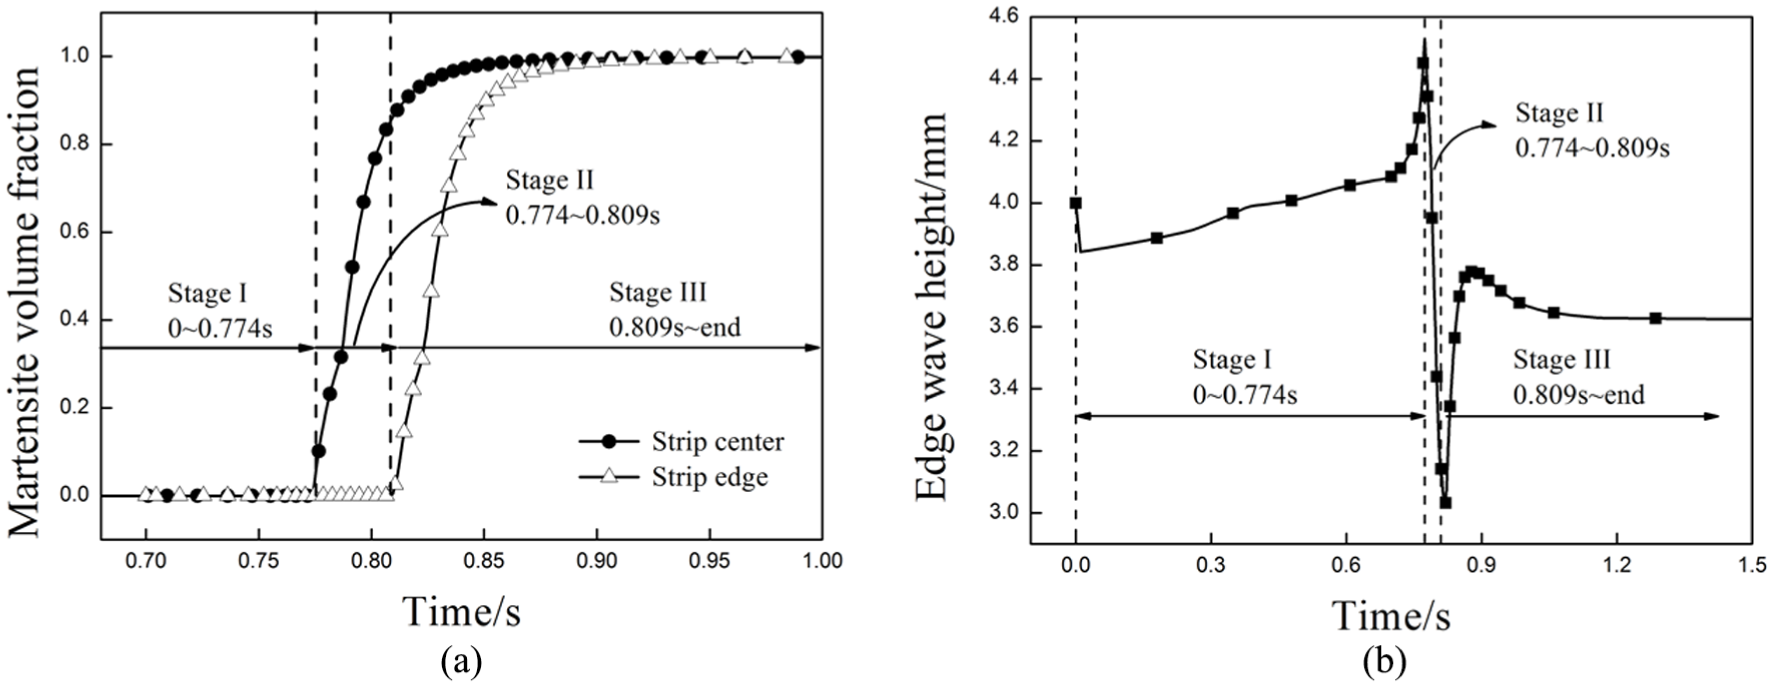
Martensite volume fraction and edge wave height during quenching process: (a) martensite volume fraction and (b) edge wave height.
To analyze the changes in the flatness edge wave defects during the above three stages, Figure 11(b) shows the changes in the wave height with time during the entire quenching process. The initial wave height slightly decreases and then increases during stage I, significantly decreases during stage II, and increases and then decreases during stage III before slightly fluctuating after 1.200 s.
The increase in the edge wave height during stage I of the quenching process is mainly due to the gradually increasing thermal strain difference between the edge and the middle. The changes in total strain difference are shown in Figure 12(a). The transformation strain difference, transformation plastic strain difference, and plastic strain difference at the edge and the middle are equal to 0 during stage I, but the thermal strain difference gradually increases from 0 to 0.0012 while the wave height increases from 4 to 4.52 mm during this stage. Due to the identical change trend with the uneven thermal strain distribution, the thermal strain difference mainly caused the increase in the edge wave. For the thermal strain difference increase, the temperature of the steel plate is much higher than 100°C at stage I. Meanwhile, the heat transfer between the cooling water and the plate surface mainly results from film boiling at this temperature and the large amount of bubbles generated on the contact surface, which hinders the heat exchange between the steel plate and the cooling water. The heat transfer coefficient decreases as the temperature increases. Therefore, the heat exchange coefficient of the edge with the higher initial temperature is greater than that of the middle, which results in an increasing difference between the thermal strain in the middle and edge of the steel plate. The initial edge wave height decreases from 4 to 3.84 mm due to the impact of the tensile stress applied on the high-temperature steel plate in the model.

The strain differences between the edge region and central region: (a) stage I, (b) stage II, and (c) stage III.
The strain differences during stage II are shown in Figure 12(b). As the quenching process progresses, the thermal strain difference between the edge and the middle first increases and then decreases. Affected by the temperature field distribution of the steel plate, the steel plate is subjected to transformation expansion from the surface to the center and from the middle to the edge, successively, and the transformation strain value is positive. The difference between the transformation strain at the edge and in the middle gradually increases over time. The longitudinal transformation plastic strain is closely related to the volume fraction of the martensitic phase transformation, and the difference between the longitudinal transformation plastic strain at the edge and at the middle increases over time. Due to the martensitic transformation that first appears in the middle and then at the edge, the yield strength in the middle obviously increases; thus, it is difficult to achieve plastic deformation at the edge, and the difference between the longitudinal plastic strain at the edge and the middle increases over time. Moreover, the martensitic phase transformation occurs earlier on the surface of the steel plate than at the center, and the plastic strain on the surface of the steel plate is less than that in the center. In summary, the overall longitudinal strain at the edge is less than that in the middle due to the impact of the uneven distributions of the thermal strain, transformation strain, longitudinal transformation plastic strain, and longitudinal strain in the width direction during stage II, and the strain difference between the edge and middle is reduced due to phase transformations and temperature gradients over time; therefore, the steel plate edge wave height is reduced during this stage.
As shown in Figure 12(c), the thermal strain difference between the surface and edge of the steel plate decreases, the transformation strain difference increases, the longitudinal transformation plastic strain decreases, and the longitudinal plastic strain difference remains approximately constant over time during stage III. Under the joint action of the temperature gradient and the phase transformation, the strain difference between the edge and the middle first increases and then decreases, and the steel plate edge wave height first increases and then decreases.
To conclude, the change in edge wave defect results from the transverse strain differences of the strip, which consist of elastic strain, plastic strain, thermal strain, transformation strain, and transformation plasticity strain. Discussing about the defect evolution mechanism, before the martensitic phase transformation starts, uneven thermal strain caused by uneven temperature distribution is the primary reason for the defect change. When the martensitic phase change occurs from the coolest area of the strip, the sequence of the phase change causes uneven phase transformation strain along the transversal direction of the strip. The distribution of phase transformation strain finally leads to drastic change in the defect. When martensitic transformation is over, thermal strain distribution again dominates the edge wave defect change.
Evolution of buckling defects under different quenching conditions
Edge wave evolution
The continuous quenching production process of the steel plate requires a certain tension applied on the steel plate. The integrated impact of the tension and initial temperature difference on the edge wave change is shown in Figure 13.
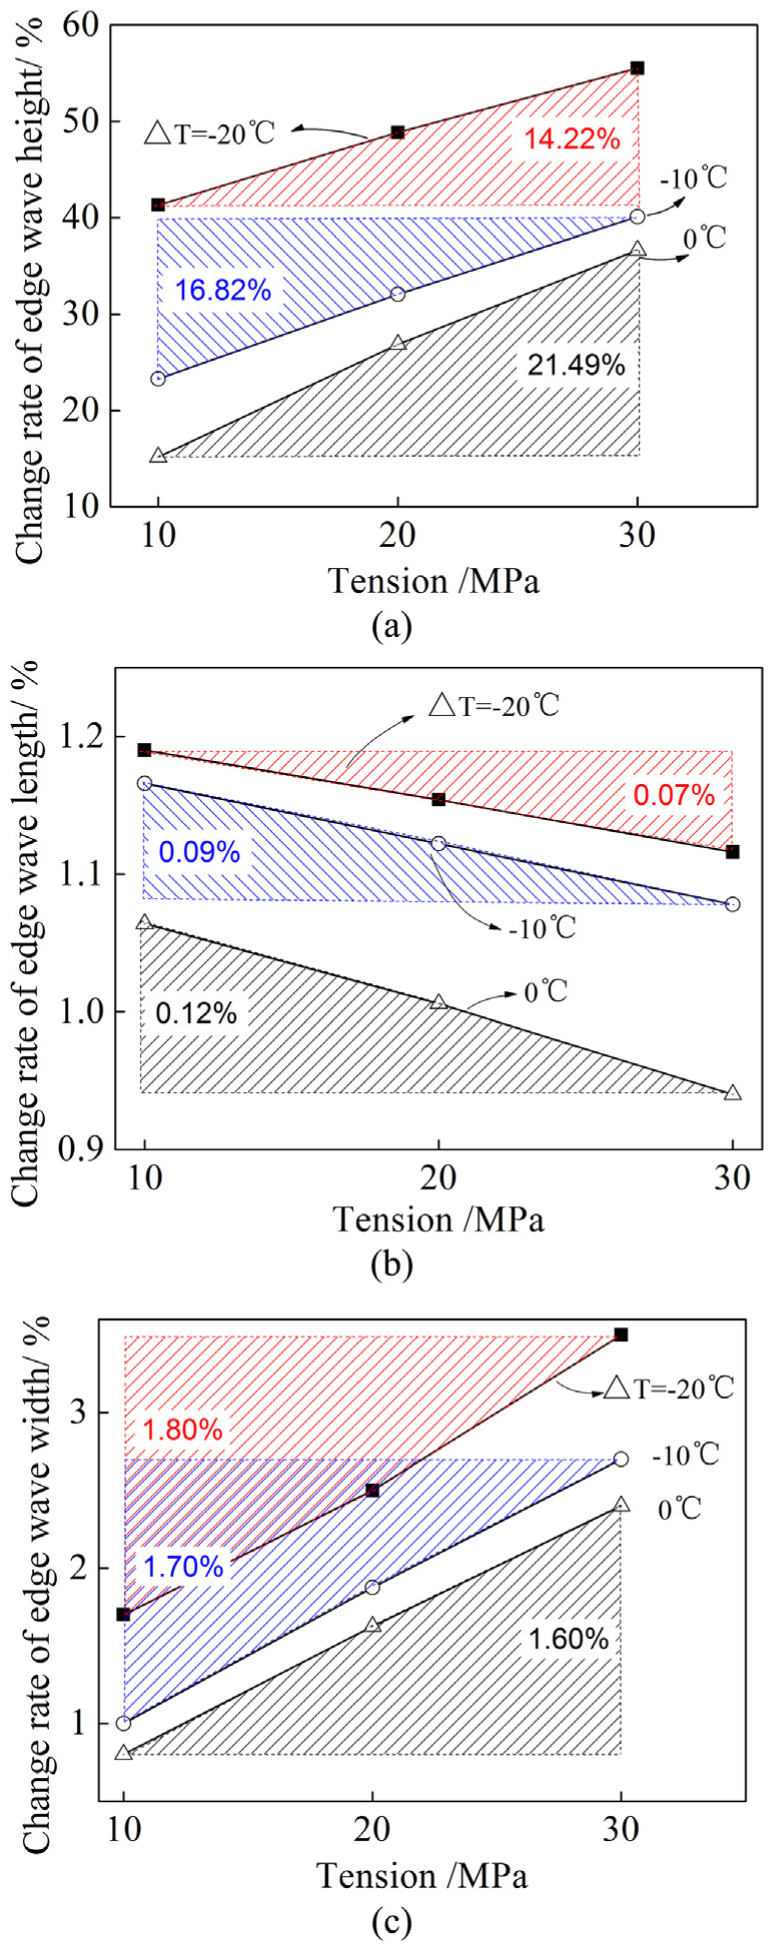
Edge wave change rate under different quenching conditions: (a) wave height change, (b) wave length change, and (c) wave width change.
When the temperature difference
When the tension is 20 MPa, the edge wave height, wave width, and wave length change rate are reduced by 22.00%, 0.87%, and 0.14%, respectively, when the initial transverse temperature difference of the steel plate increases from −20°C to 0°C. These results indicate that a negative initial temperature difference improves the initial wave height and width of the edge wave more significantly than the wave length.
Central wave evolution
The mutual impacts of the tension and initial temperature difference on the central wave after quenching are shown in Figure 14.

Central wave change rate under different quenching conditions: (a) wave height change, (b) wave length change, and (c) wave width change.
When the temperature difference is
As for the influence of the initial temperature difference, from the figures, a positive temperature difference can promote the capability to improve the central wave height; this promotion does not increase significantly with an increase in the temperature.
Therefore, during the actual production process, it is recommended to avoid initial transverse temperature differences or to utilize a large initial transverse positive temperature difference and properly increase the steel plate tension to control the central wave during the quenching process of a steel plate with initial central wave defects.
Experimental verification
Experiments to characterize the warping defect changes
The L warping defects become C warping defects when the strip is offline and cut into plates. Therefore, L warped 22 MnB5 high-strength steel strips were used to simulate the online C warping changes after quenching. The warped offline steel plate is shown in Figure 15(a). Different sides of the plate were first placed into the water quench tank to simulate the positive and negative initial temperature differences in the thickness direction. The experiments were repeated 20 times for each case. The flatness measuring equipment was designed to accurately measure the defect changes. The steel plate quenched with L warping defects facing up and down is shown in Figure 15(b) and (c), respectively (Table 4).
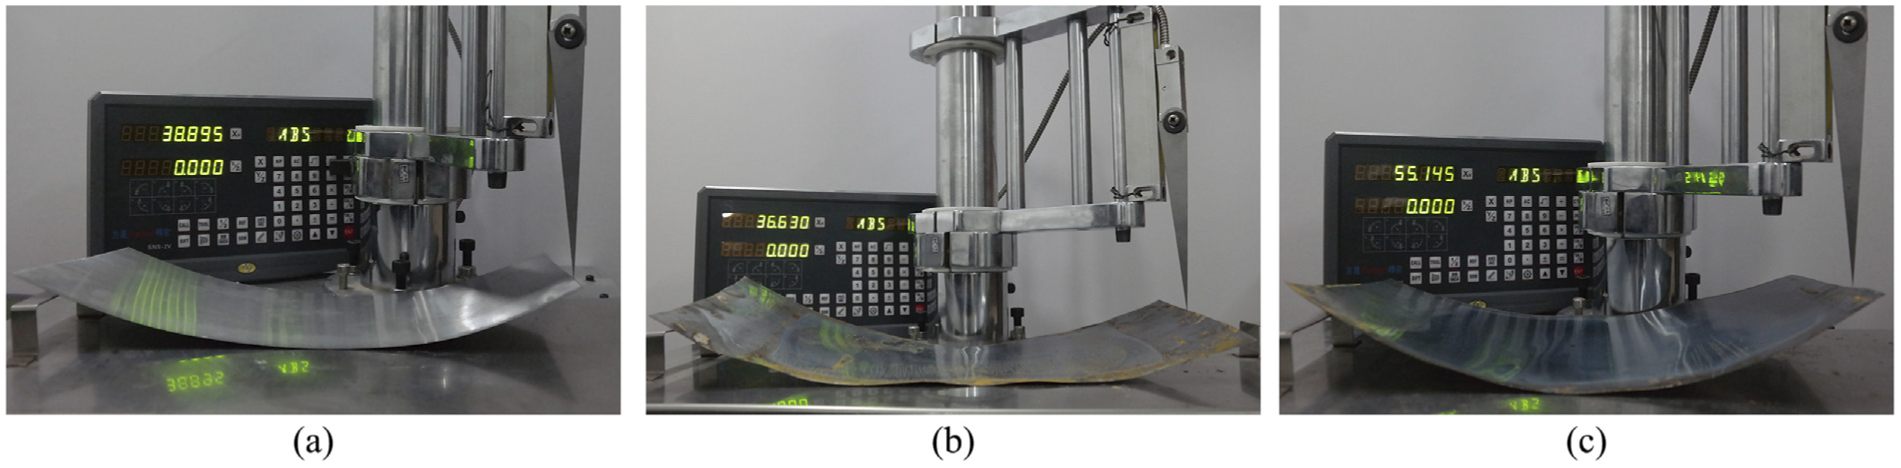
L warped steel plates: (a) before quenching, (b) after quenching facing up, and (c) after quenching facing down.
Equipment and settings of the quenching experiment.
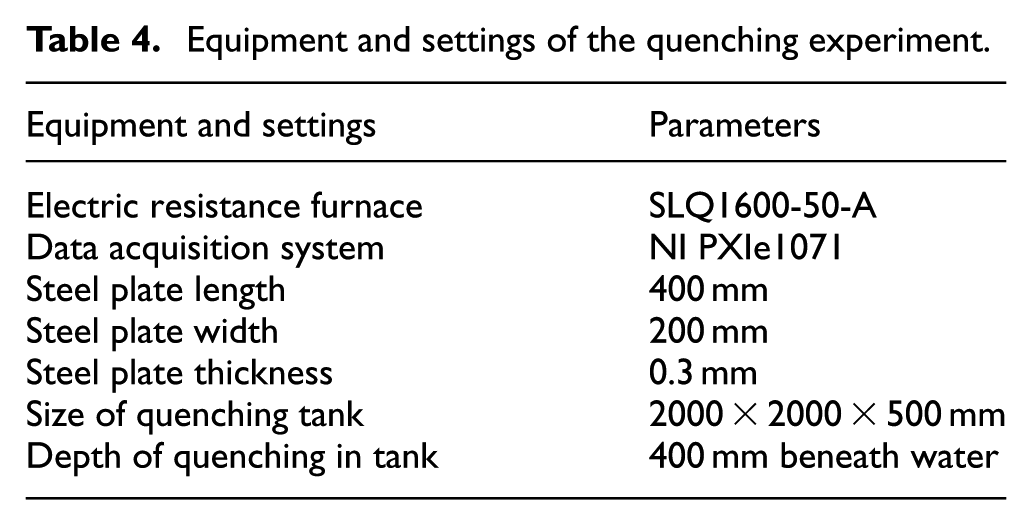
Figure 16 shows the changes in initial L warping height after quenching experiments using the different methods above. The dotted line represents the initial warping height (45 mm). It can be seen from the figure that the average warping height decreased by 18.44% when quenched with the L warping facing up. Meanwhile, the average warping height increased by 15.89% when the plate is being quenched by the other way. In other words, a positive initial temperature difference helps reduce the warping height after quenching, while a negative difference accomplishes the opposite.

L warping height after quenching using different quenching methods
From the simulated results, the L warping height decreased by 9.35% when the initial temperature difference is 20°C. On the contrary, it increased by 12.60% with an initial temperature difference of −20°C. The experimental results qualitatively verify the flatness defect changing laws of the FE model.
Experiments to characterize the buckling defect changes
In all, 20 samples with initial edge wave defects were prepared with the same warped plate dimensions. Both the edge wave defect side and side without defects were, respectively, quenched in the tank to simulate the case for the initial transversal temperature difference. The experiments are repeated 20 times for each case.
Figure 17 presents the edge wave height of the steel plate after quenching according to the initially quenched side, and the dotted line in the figure indicates the initial edge wave height (2.17 mm) of the steel plate. The figure shows that the steel plate average wave height is 62.32% higher than the initial one after quenching with the waved side first. In addition, the steel plate average wave height is 19.39% lower than its initial one after quenching with the opposite side first, which indicates that the negative initial transversal temperature difference can decrease the edge wave height during the quenching process. The FE model–calculated result shows that the change rate of edge wave height ranges from 55.53% to 41.32% under different tensions. The experimental results are qualitatively identical to the FE calculations.

Edge wave height using different quenching methods.
Conclusion
A temperature–microstructure–stress coupled FE model was established using UMAT in ABAQUS to simulate the flatness defect evolution of steel strip that includes warping and buckling defects during high-strength steel quenching process.
In this model, the Koistinen–Marburger model is used to describe the martensitic transformation kinetics. The elasticity modulus, yield strength, and thermal expansion coefficient are set to obey the rule of mixture. In the constitutive model, total strain consists of elastic strain, plastic strain, thermal strain, transformation strain, and transformation plasticity strain. An isothermal tensile test were conducted by Gleeble 3500 machine and simulated using this model for the verification.
From the numerical simulation result, the evolution of two typical types of strip defects, C warping and edge wave, is studied. The evolution during quenching originates from the temperature gradient in strip thickness or transversal direction. Before and after martensitic phase transformation, the temperature gradient causes uneven thermal strain difference, which primarily changes the strip defect. During the phase transformation, the temperature gradient leads to the sequence of the phase change, which causes phase transformation strain difference and alters the defects as a result.
The joint influence of the initial temperature gradient and tension on C warping, L warping, edge wave, and central wave during quenching was analyzed. Based on the analysis, proposals are submitted for steel strip defects improvement during industrial quenching process of high-strength steel.
Offline steel plate quenching experiments were conducted. The statistical results of the experiments were in accordance with the defect changing law from numerical simulations. An online flatness control system has been developed in the product line of Baoshan Iron & Steel Co., Ltd in China based on the results discussed in this work.
Footnotes
Handling Editor: Jining Sun
Declaration of conflicting interests
The author(s) declared no potential conflicts of interest with respect to the research, authorship, and/or publication of this article.
Funding
The author(s) disclosed receipt of the following financial support for the research, authorship, and/or publication of this article: The work presented in this article was supported by the National Natural Science Foundation of China (no. 51575040) and National Key Technology Research and Development of China (no. 2011BAE13B05).