
Abstract
This article presents the development of an acoustic energy harvester using a quarter-wavelength resonator phononic crystals together with piezoelectric vibrators. The quarter-wavelength resonator phononic crystals consist of a main wave duct, several quarter-wavelength resonators, and equivalent piezoelectric vibrators. The acoustic energy is converted to mechanical energy when the sound incident in the quarter-wavelength resonator generates an oscillatory pressure as of localization efficiency, which in turns causes piezoelectric vibrators vibrating. Transfer matrix method is used to provide a physical insight into the structure band of the quarter-wavelength resonator phononic crystals, and finite element method is used to analyze the sound localization effect and evaluate the reclaimed energy of the quarter-wavelength resonator phononic crystals. Results indicate that the numerical analysis agrees well with experiments. When the frequencies of the incident sound are near both sides of the bandgap, the maximum output voltage always can be obtained.
Keywords
Introduction
The extensive use of microelectromechanical systems (MEMS) and wireless technology in the past two decades, which are now more powered by chemical batteries for a regular replacement and maintenance, has led to permanent environmental pollution.1–3 Therefore, many studies on self-powered electronic components by harvesting energy from ambient have been carried out, showing the potential benefit of eliminating the battery replacement and disposal. Acoustic energy is a clean, ubiquitous, and sustainable energy source, and it is abundant in some circumstances, thus investigating the acoustic energy reclaiming mechanisms is of significance. Whereas cabling and electrical commutations complicate the installation, especially inside sealed or rotating system, acoustic energy harvesting (AEH) is a reasonable solution for obtaining local long-term power in the case of remote locations. It was suggested that the harvesting of propagating wave energy in solids or fluids can be enhanced by localizing the wave propagation in the materials.
For lower energy density, the sound waves must be localized and amplified to be reclaimed, and the resonators are usually applied. Among the acoustic resonators, Helmholtz resonator and two types of straight resonator, namely the quarter-wavelength resonator (QWR) and half-wavelength resonator (HWR), are the most commonly used. By comparing the damping capacities, Sohn and Park 4 found that the QWR is the best one to collect acoustic energy at a given incident frequency. Horowitz and colleagues5–8 presented an active electromechanical acoustic liner in mesoscale designed to suppress the noise in aircraft engine nacelles. A tunable electromechanical Helmholtz resonator (EMHR) was formed with a compliant piezoelectric ceramic transducer (PZT) piezoelectric composite diaphragm to reclaim the sound wave energy. The energy harvesting circuit gave a continuous output power in the range of 20–30 mW at an incident wave sound pressure level of 151 dB. Noh et al. 9 had theoretically and experimentally analyzed an acoustic energy harvester with a piezoelectric polyvinylidene fluoride composite cantilever integrated within a Helmholtz resonator. The energy harvesting efficiency is the maximum when the mechanical resonance frequency of the cantilever equals the acoustic resonance frequency of the resonator. The maximum output voltage of 0.22 V was obtained at 865 Hz. Li and colleagues10,11 used PZT piezoelectric plates in a straight tube resonator to harvest low-frequency acoustic energy. However, due to the lack of multi-mode coupling of harvesting system parts, the energy harvesting is narrow-banded and then impractical in the real world where ambient acoustic is distributed over a broad spectrum of frequencies. Peng et al. 12 proposed a wideband acoustic energy harvester with dual Helmholtz resonators taking advantage of multi-modal frequencies due to the acoustic coupling of the vibrating plate and two cavities.
Recently, artificial acoustic metamaterials, such as the phononic crystals (PCs), that achieve exotic physical properties by free designing, including of the negative permeability, negative stiffness or mass, and negative refractive index, 13 have attracted the attention of researchers. The transmission spectra, defect modes, and wave localization of PCs with a defect have been investigated theoretically and experimentally. When the incident acoustic wave is at the resonant frequency, it can be localized and amplified in the cavity, so it can be used for AEH with piezoelectric materials.14,15 Wu and colleagues16–18 developed an acoustic energy harvester using PCs with a point defect and piezoelectric material. The point defect acts as a resonant cavity where the acoustic wave can be localized and amplified to excite the piezoelectric material to generate electric power, and the output power of ∼35 nW was obtained at the resonant frequency of 4.2 kHz. Yang et al. 19 embedded the EMHR in a phononic crystal resonator (PCR) to improve the amplification of acoustic pressure. The PCR structure was formed by removing a rod from perfect PCs in the air background. The efficiency of the harvester was 23 and 262 times higher than the maximum efficiencies of the EMHR structure and the PCR structure, respectively. When the incident acoustic pressure was 110 dB at the resonant frequency of 5.545 kHz, with the optimal load resistance of 4.4 kΩ, the harvester generated a maximum output power of 429 μW. It was concluded that the higher harvesting efficiency was due to the larger amplification of acoustic pressure in the coupled resonance structure. By combining the plane wave expansion method with supercell method, Guo et al. 20 analyzed the bandgaps characteristics of PCs with line defect and investigated how the structure parameters of the PCs effect the sound pressure amplification in the resonator.
Those above are Bragg Scattering PCs whose defect frequency depends on the structure scale. Generally, Bragg Scattering PCs can localize the high-frequency sound wave through the defect with large sizes of the lattice constant, while the localization effect is severely limited for the low-frequency one. Alternative composite structures, in which full bandgaps open due to local resonances associated with individual scatters, were proposed theoretically and demonstrated experimentally by Liu et al. 21 They considered structures in which each scattering unit consisted of a high-density solid core (1.0 cm diameter lead balls) coated with an elastically soft material (silicon rubber) embedded in a matrix made of a rigid material (epoxy). Due to presence of the soft material in between two highly rigid materials, low-frequency resonances associated with a single scattering unit arise, manifested as the motion of the hard core with respect to the surrounding matrix. They found the existence of a wide attenuation band at around 0.4 kHz and the sound wavelength in epoxy is about 6.4 m, which is about 400 times larger than the crystal lattice constant. Moreover, note that the existence of sonic gaps in locally resonant materials does not rely on the geometry, in which scattering units are arranged, and only requires the density of the scatters to exceed a certain threshold.
Hirsekorn et al. 22 investigated the principle of the bandgap of the locally resonant sonic crystals, composed of an array of silicone rubber-coated hollow steel cylinders embedded in an epoxy matrix. The simulation results showed that resonance bandgaps exist between the local resonators. Zhang and colleagues23,24 proposed a novel locally resonant structure with harvesting vibration energy capability. Using finite element method (FEM), the first seven-order resonant frequencies of the structure can be reduced to the frequency range of 50–250 Hz by changing material and geometric parameters. With a developed multi-core structure, dozens of resonant frequencies appear below 250 Hz and the lowest frequency is 20 Hz. These low and broadband resonance properties are confirmed to satisfy the low and broadband frequency requirements of the energy harvesting from ambient vibrations. Chen et al. 25 have innovated one-dimensional phononic piezoelectric cantilever beams (PPCBs) as vibration energy harvester. The PPCBs can be used to reclaim low-frequency vibration energy, validated by numerical analysis and experimental tests. Qi et al.26,27 adopted acoustic metamaterial to investigate acoustic wave manipulation. By creating suitable resonant defects, the acoustic wave can be focused and the energy can be converted into electrical energy by a structured piezoelectric material. The acoustic focusing and confinement increase with the sides of the multilateral metasurfaces, which also shows great potential in low-frequency acoustic isolation.
In this article, quarter-wavelength resonator phononic crystals (QRPCs) are proposed to harvest the acoustic energy with the PVs, which couple the acoustic and electric domains. Local resonance bandgap of the QRPCs is analyzed theoretically by transfer matrix method (TMM), and sound localization effect of the QRPCs is studied by FEM and experiments. The prediction of the output voltage of energy harvesting is calculated and analyzed by numerical method and experimental results. This article can provide a theoretical guidance for harvesting low-frequency, broadband sound energy using QRPCs in engineering application.
Theoretical analysis of local resonant
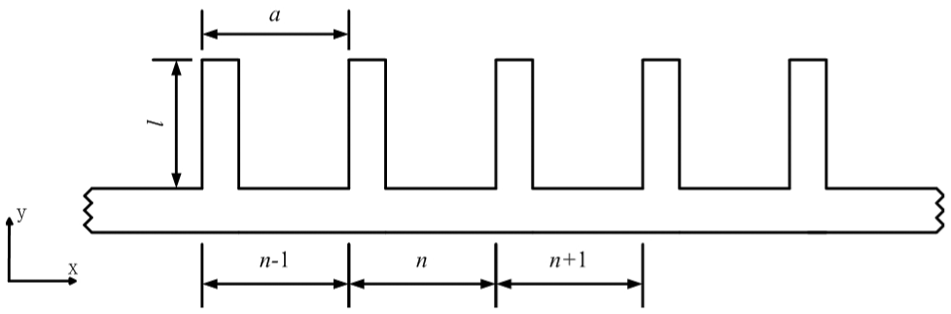
If the QWRs are arranged along a main wave duct (MWD) with a certain period distance, the QRPCs proposed in this article are obtained; there is full of air in the QWRs and MWD (Figure 1). The square MWD with cross-sectional area S0 can extend to both ends limitless. One end of the square QWRs is freely connected with the MWD, while another end with cross-sectional area of Sb is closed. If the wavelength of the incident sound is much larger than the lattice constant a, the sound pressure at the nozzles of the QWRs can be considered almost the same as that of any point in the duct. Then the acoustic impedance rate at nozzles can be calculated as

where
Model of QRPCs.
From equation (1), if the length l is constant,
For the QRPCs, the acoustic impedance rate changes periodically along x-direction; consequently, it can be considered as a one-dimensional PCs. TMM is used widely to calculate the acoustic bandgaps because of the versatility and efficiency,28,29 so that it is used to forecast the band structure of the QRPCs.
Then, the sound wave propagation characteristics in the MWD can be described as

where p is sound pressure in the MWD, x is position,
While p at the nth nozzle can be calculated as

where

The boundary conditions are

where
Using equations (3) and (4), the matrix formation can be obtained

where

Based on Bloch’s theorem, the relationship between vectors

Combining equations (6) and (7)

Through solving the eigenvalues of matrix
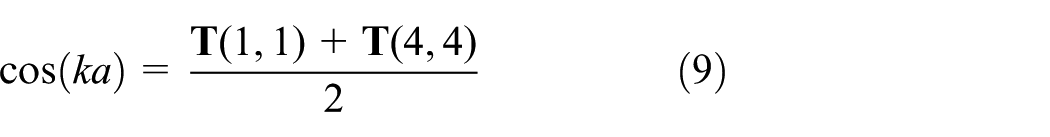
For a given arbitrary frequency, corresponding value of k can be solved from equation (9), namely the band structure of the PCs. Especially, when
Table 1 summarizes the structural parameters of QRPCs, while its complex band structure is shown in Figure 2. Figure 2(a) shows the corresponding relationship between the frequency and the real vector; meanwhile, it is that of the frequency and the absolution value of imaginary vector. Five bandgaps under the frequencies of 3500, 533–655, 1404–1560, 1705–1890, 2715–2875, and 3098–3228 Hz exist, namely first, second, third, fourth, and fifth bandgap in turn. If the frequencies of the incident wave are within the bandgaps, they would not transmit through QRPCs.
Structural parameters of QRPCs.

MWD: main wave duct; QWR: quarter-wavelength resonator; QRPC: quarter-wavelength resonator phononic crystal.

The QRPC band structure: (a) real part and (b) imaginary part.
Figure 2(b) shows that there are several asymmetric and shrill peaks, for example, the first, third, and fourth bandgaps, corresponding to the specific fano-like character of the localized resonant. 30 Additionally, these peak frequencies are the same as the first- to third-order natural frequencies of the QRPCs shown in Table 2.
Comparison of the peak frequency of imaginary wave vector and natural frequency.

QWR: quarter-wavelength resonator.
Sound localization effect
For the finite period QRPCs, FEM is provided to calculate the transmission spectrum and the sound pressure distribution in them. The sound wave propagates in the QRPCs and is governed by

where

Using the weighted residual method, the corresponding weak solutions are derived as follows

where

The divergence theorem can be expressed as

where
Then partial integration is carried out on equation (12), adding equation (13) yields

where
Definite the pressure distribution function of each finite element

where
The Galerkin approach is adopted to solve equation (14), definite

where i = 1, 2, 3,…, n, and

Equation (16) can be rewritten in matrix form as

where
And then the distribution of pressure inner the QRPCs can be got. The model of QRPCs is shown in Figure 3.The transmission ratio can be calculated by rating the average sound power of the incident sound and the output one, described as

where

Model of QRPCs: (a) 3D FEM model and (b) 2D.
The transmission spectrum of QRPCs is shown in Figure 4. When sound frequency is 520–642 Hz (almost the same as the results of the TMM in Figure 2),

Transmission spectrum of QRPCs.
If the incident sound excites the QRPCs at the eight peaks frequencies, the sound pressure distributions in the QRPCs are shown in Figure 5. The sound pressure is scaled in the QWRs in varying degrees, which is called sound localization effect. For the peaks far away from the bound frequencies of the bandgap (i.e. PR1, PR2, PR7, and PR8), the sound pressure in both the MWD and the QWRs is amplified little because of the weak coupling between the MWD and the QWRs array. The sound pressure in the QWRs is higher than that in the MWD, when the peaks are close the boundary frequencies, that is, PR3, PR4, PR5, and PR6. When the incident frequency is near the bound limits, the acoustic impedance rate rapidly drops off at the inlet of the QWRs, and the resonance of the PCs vibrators enhances abruptly. Meanwhile, the strong coupling interaction between each QWR intensifies the local resonant. In brief, the sound localization effect of the QRPCs is prominent if the incident sound frequencies are tending to the bound limits of the first bandgap from the outside of the bandgap. The amplified sound pressure can excite the PV to harvest the sound energy.

Sound pressure distributions corresponding to the frequency of resonant peaks and bandgap: (a) PR1, 383 Hz; (b) PR2, 456 Hz; (c) PR3, 489 Hz; (d) PR4, 505 Hz; (e) PR5, 511 Hz; (f) PR6, 644 Hz; (g) PR7, 677 Hz; (h) PR8, 762 Hz; (i) PF1, 523 Hz; and (j) PF2, 628 Hz.
While for the frequencies 523 Hz (PF1) and 628 Hz (PF2) in the bandgap, the sound waves are attenuated due to the resonance in the bandgap, 21 and the amplification of sound pressure is not so significant.
AEH
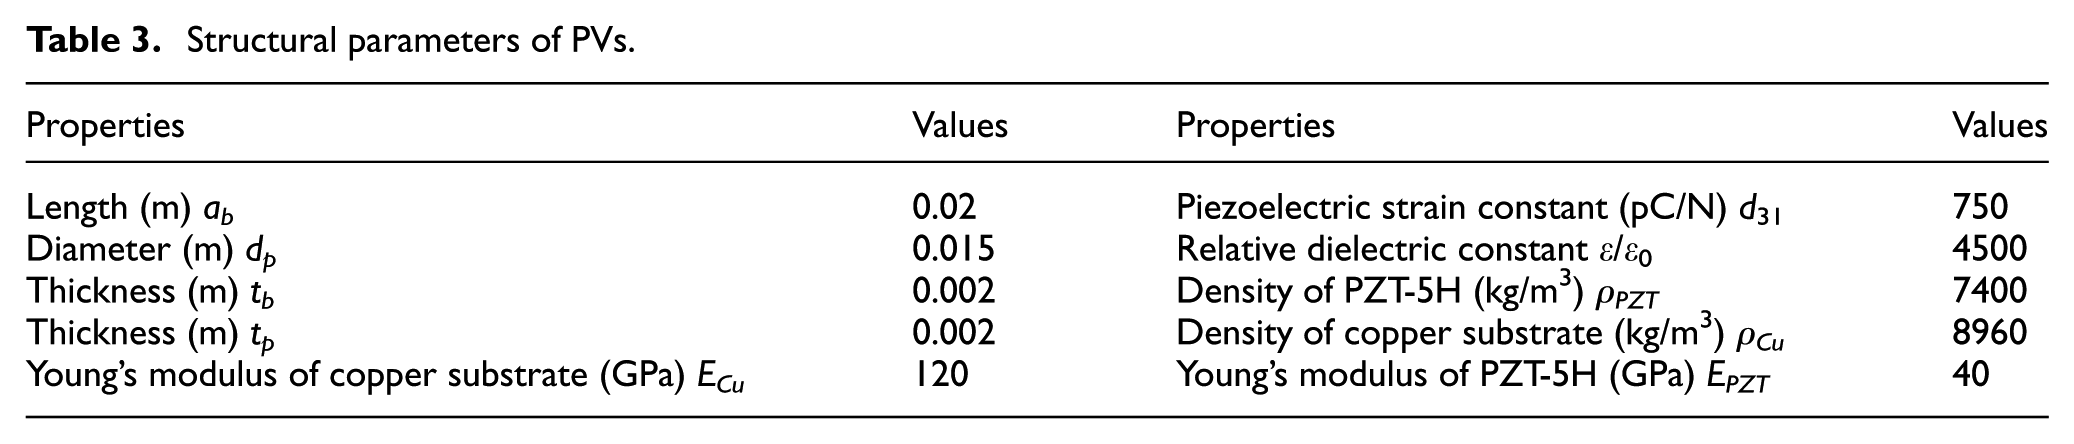
In this article, circular PZT-5H piezoelectric ceramics are taken as the PVs (Figure 6) which cover a square copper substrate and replace the closed ends of the QWRs with PVs to harvest the acoustic energy. The rigidity of round PVs is lower than that of the square ones, so that the deformation in the central area of the round ones is much higher and more energy could be reclaimed. Structural parameters of the PVs are summarized in Table 3.
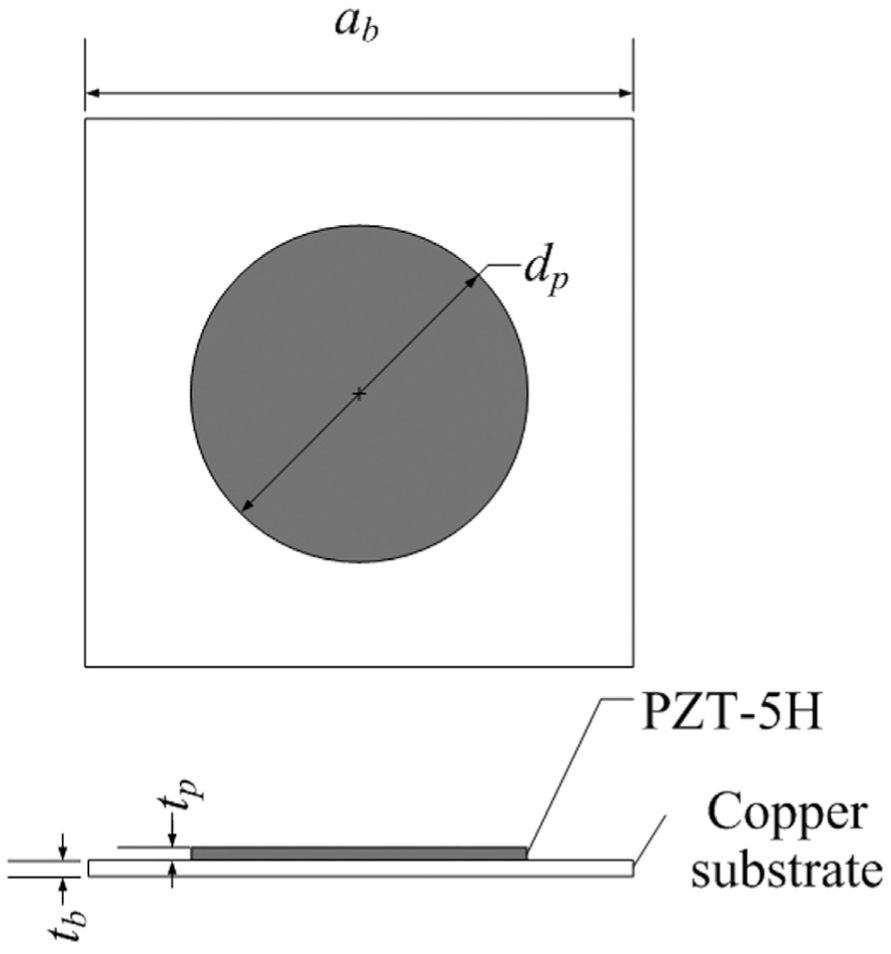
Piezoelectric vibrators.
Structural parameters of PVs.
To forecast the harvesting acoustic energy, the load effect is considered in the harvesting system by introducing an external resistance R as the load and connecting both ends of each PV. The structural parameters of piezoelectric QRPCs are summarized in Table 4. Considering the interaction among the acoustic field, vibrating mechanical system, and the piezoelectric dynamic, the acoustic-mechanical-piezoelectric-coupling finite element model is established in COMSOL Multiphysics software.
Structural parameters of piezoelectric QRPCs.

MWD: main wave duct; QWR: quarter-wavelength resonator; QRPC: quarter-wavelength resonator phononic crystal.
From Figure 7, the sound pressure in the QWRs is raised obviously and excites the PVs to oscillate as the first-order bending mode. Then the electric potential is generated along the vibrators, and ground terminal potential is zero. The electric potential difference between the two ends of the vibrators can be set as the output voltage, which can operate on the load of the external circuit or be harvested. In this article, a resistance of 5100 Ω is used to consume the harvesting energy.
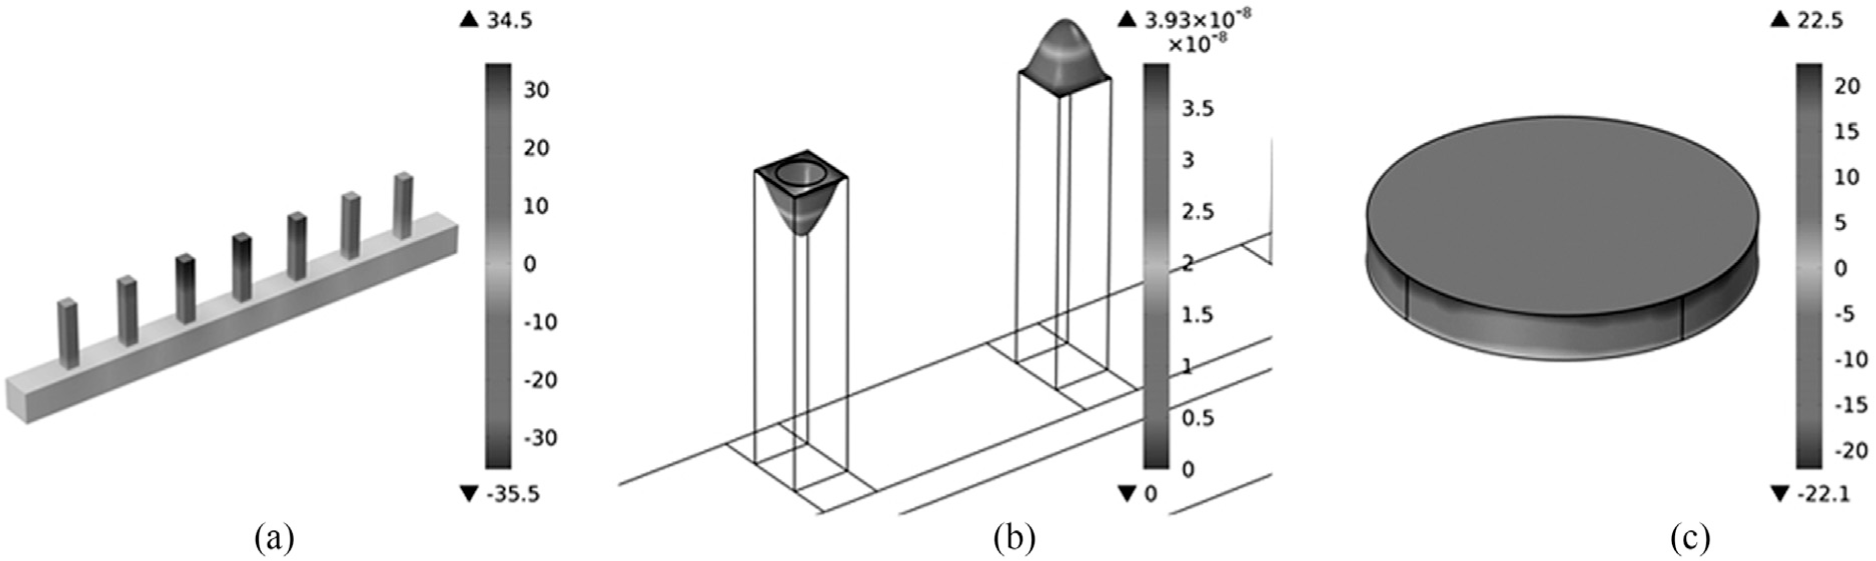
Contours of physical variables: (a) sound pressure, (b) elastic deformation, and (c) electric potential.
The curves of the average sound pressure at the top end of each QWR and the output voltage from the PVs against the incident wave frequency are shown in Figure 8. As the first bandgap of the piezoelectric QRPCs is 776–830 Hz, almost all the incident sound among this frequency range is almost attenuated due to the resonance and rarely transmitted through other QWRs, so that both the curves of the sound pressure and output voltage are almost near zero. Otherwise, near both sides of the bandgap, several harvesting voltage peaks exist at each QWR because of the sound localization effect near the bounds bandgap. The smaller the distances between these peaks and the two sides of the bandgaps, the larger the output voltage amplitudes. The relative position of the QWRs at the MWD affects the maximum output voltage of the different PVs at each QWR. The maximum value of output voltage on the PVs at the center of MWD is often higher than those at both sides. The response curves of the sound pressure at the top of the QWRs agree well with these of the output voltage of the load. Minor differences exist only in the relative size of the amplitude of individual resonance frequency and resonance peaks. As known, when the sound pressure at the top of the QWRs applies on the PVs, PVs will radiate sound wave as a secondary source to the inside of the QWRs and then the coupling changes the sound field of the QWRs and frequency response characteristics of the PVs.

Frequency response curves of sound pressure and output voltage of each QWR.
Experimental results
An AEH bench is designed to carry out the experiments in the hemi anechoic room (Figure 9). The sweep frequency sine signal is generated from the LMS (registered logo of Siemens Product Lifecycle Management Software Inc.) data acquisition system and amplified by power amplifier to drive the LMS mid-frequency volume source; from which the sound wave is generated, for transmitting into the QRPCs. When the sound wave is localized in the QRPCs, it excites the PVs. Meanwhile, the incident sound pressure at the QWRs and the voltage between the both ends of the PV are collected individually using a LMS data acquisition system and the Tektronix Mixed Domain Oscilloscope.

Block diagram of experimental processes and experimental setup.
Figure 10 shows the results of numerical simulations and experiments in terms of frequency–response curves of output voltage on each PV of the QRPCs. Symbols U1–U7 are output voltage on each PV from near the sound incident end to another faraway end; the amplitude value of the output voltage decreases with the increasing of the distance from the QWR to the sound source. Therefore, for frequencies from 736 to 825 Hz, each frequency response curves of the output voltage have varying degrees of decrease. According to the sound pressure in each QWR, simulated as shown in Figure 8, several voltage peaks obviously appear at each PV in the QWRs besides both sides of the bandgap. Symbols P1–P4 represent the resonant peak of the experimental output voltage on each PV, while the corresponding frequency is 658, 710, 840, and 877 Hz. As for the same resonant peak, the maximum voltage values and the corresponding frequencies vary at the different PVs. For example, the voltage peak value at P1 for the first, third, fifth, and seventh QWR, while the second, fourth, and sixth QWR do not show any peak; the corresponding frequency of the maximum voltage value appears at P2 for the first, second, fourth, and sixth QWR, while at P1 for the third and fifth QWR, and at P4 for the seventh QWR.
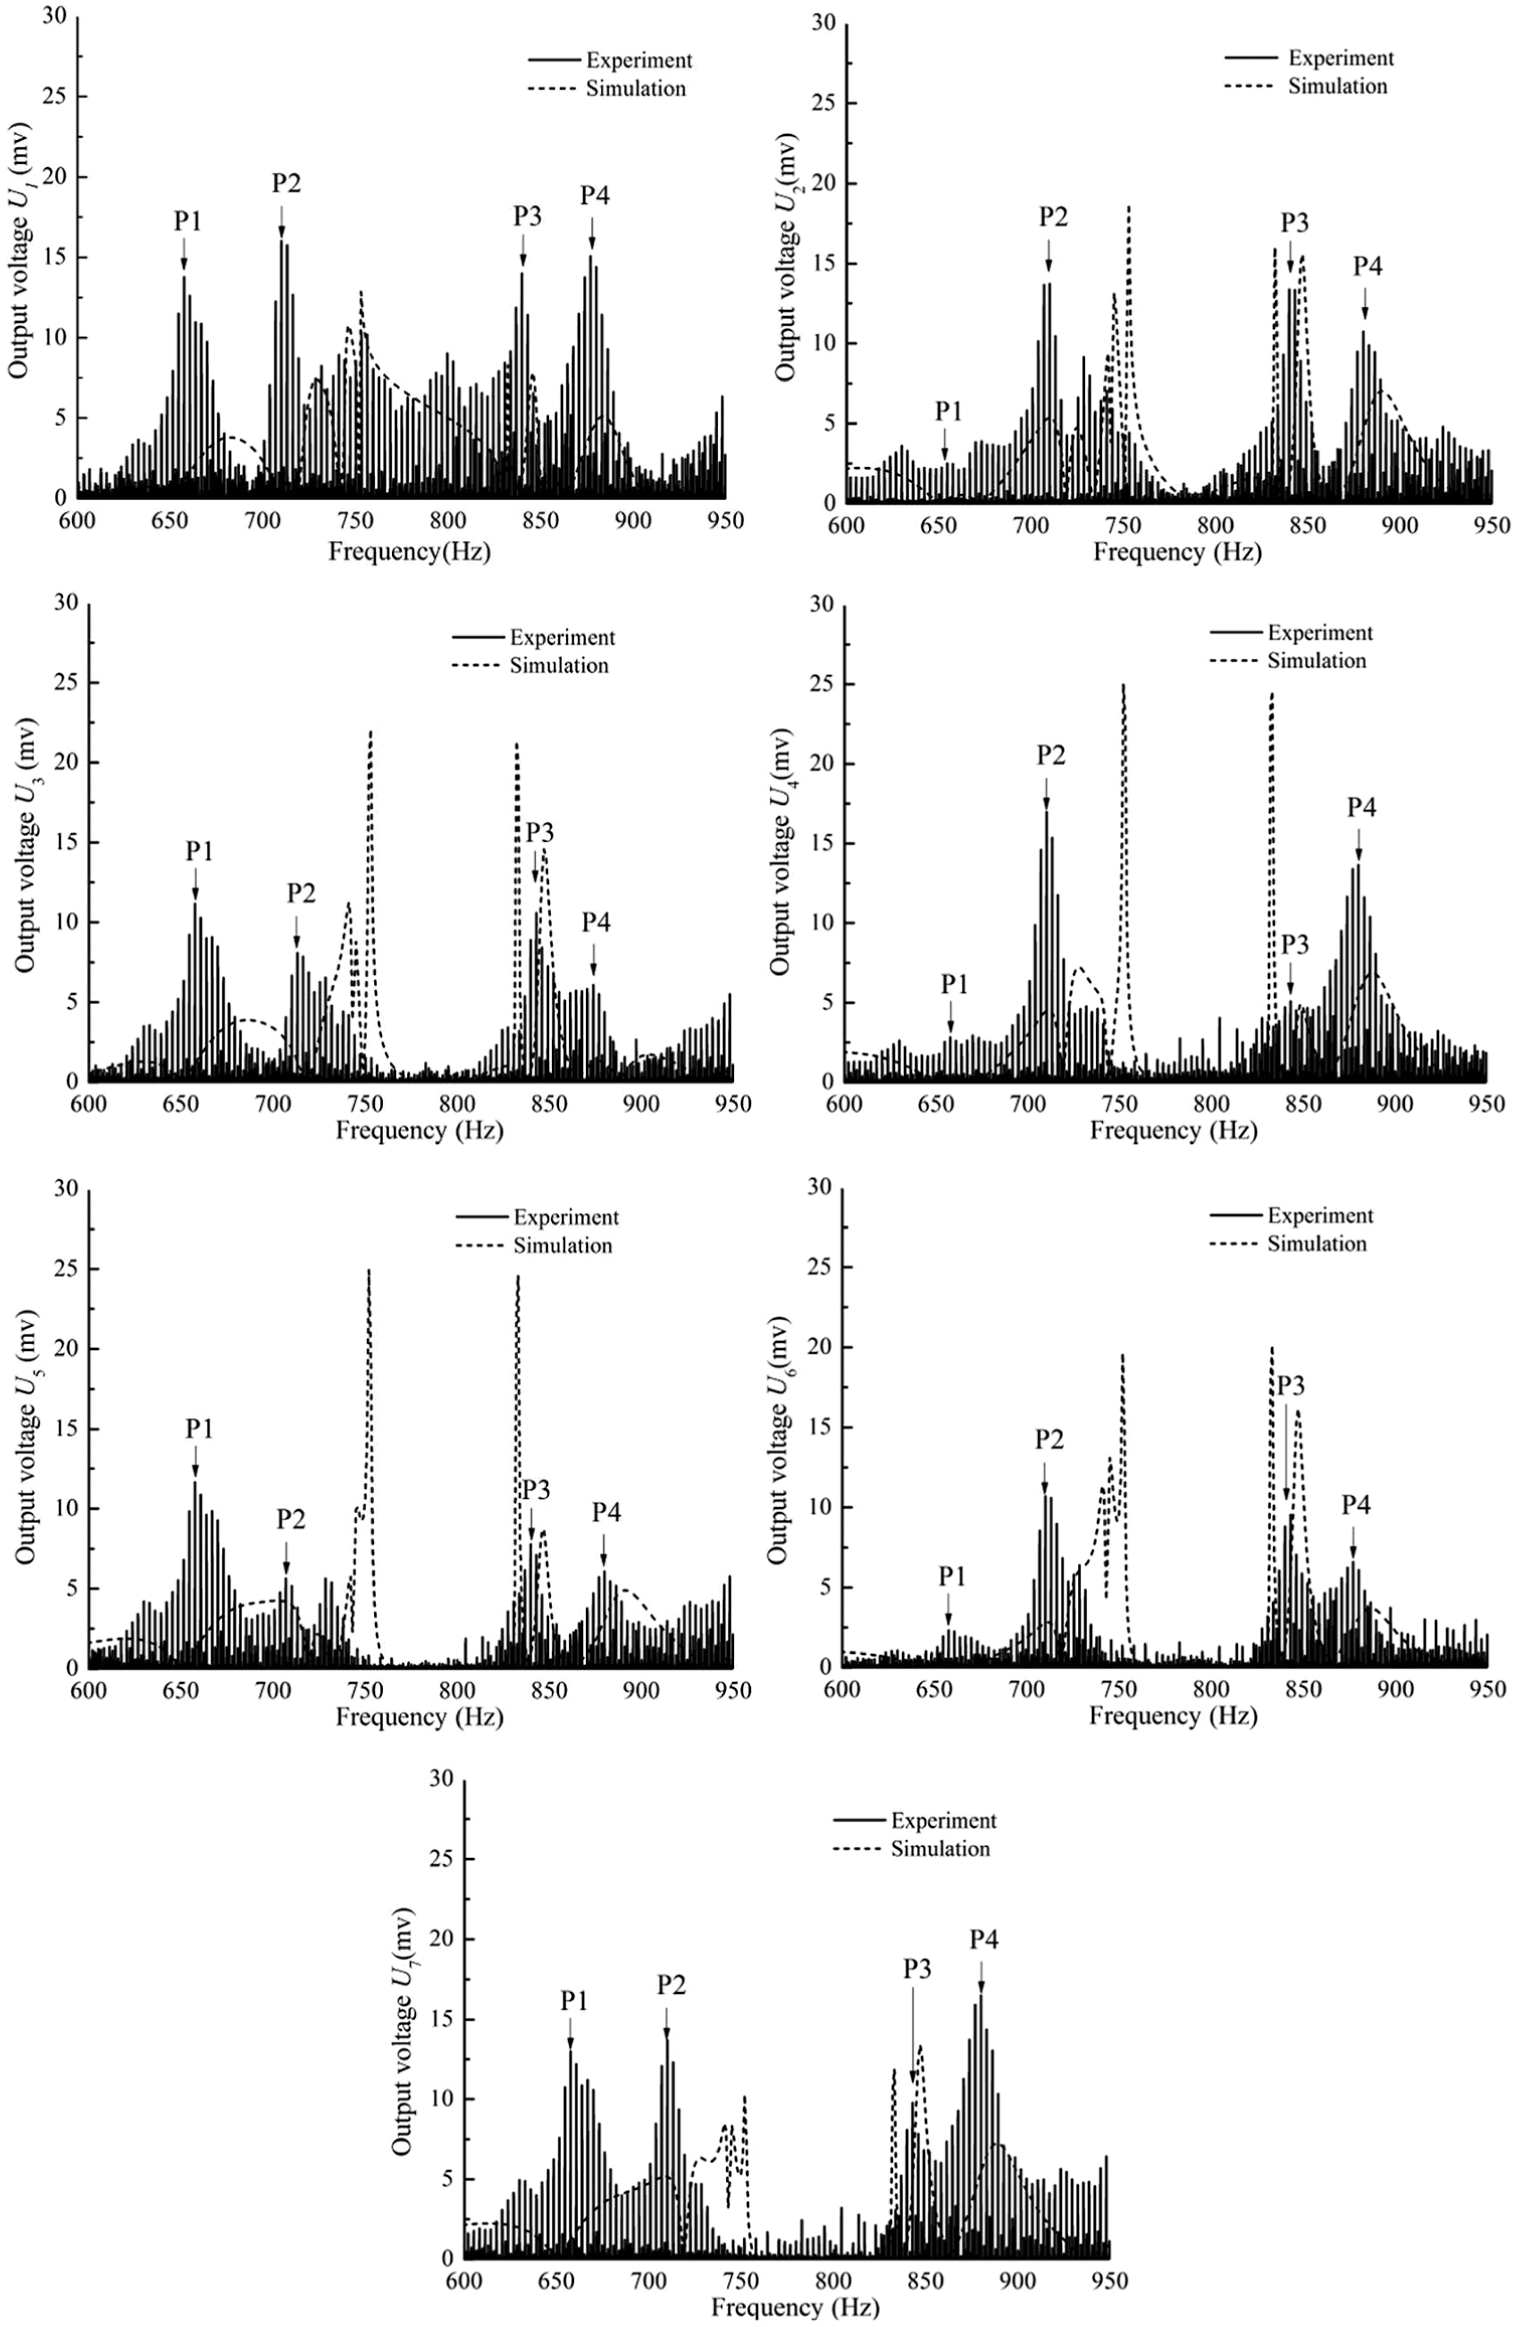
Frequency response curves of output voltage on PVs.
Discussion
The feasibility of acoustic energy reclamation using QRPCs has been demonstrated. Experimental and simulation investigation shows that the piezoelectric QRPCs can help harvest acoustic energy at the both sides of its bandgaps, but the acoustic-to-electric efficiency differs at different QWR and different incident sound frequencies. This is because the sound localization effect is much stronger inside the QWRs at the both sides of the bandgaps. Experiments under the single frequency (710, 780, and 840 Hz) incident sound wave excitation are carried out. Figure 11 shows the time domain response curves of output voltage of PV on the second QWR. Considering the voltage spectrum plot of Figure 10, the three frequencies correspond in turn to the start frequency, center frequency, and cutoff frequency of the bandgap. The amplitude of the time domain output voltage at the start and cutoff frequency of the bandgap is significantly larger than that of the center one, thus verifying the strong sound localization effect inside the QWRs.

Time–response curves of output voltage of the PV corresponding to the second QWR: (a) 710 Hz, (b) 780 Hz, and (c) 840 Hz.
Note that although the simulation and experimental results match well with each other, little differences with resonant frequencies distribution and its magnitude exist, because of several possible causes. First, the numerical simulation neglects mechanical damping of the PVs; therefore, it is difficult for the tested QRPCs to reach the ideal state in FEM, leading to resonant frequency offsets and formant amplitudes changes. If the mechanical damping of the PVs could be correctly considered, the resonant frequency and amplitude would agree better with the simulation. Second, the boundaries of the tests are not as ideal as the simulation. Ideal absorption boundary is adopted at the MWD outlet when simulating, so all the transmitted sound wave is absorbed and no diffraction exists, which cannot be neglected in practical testing. Once the ideal absorption material is designed and put at the MWD outlet, the experimental results would be more accurate. Then, the sound leakage existing in the real QRPCs is not considered in simulation. Finally, the sound source of the experiment cannot match perfectly that in FEM. A single directive planar wave radiation source is adopted in FEM, and there is no reflected sound wave at the entrance to the MWD. The experiment used middle frequency bulk acoustic source, which inevitably generates the reflected sound wave. The incident sound waves from 400 to 1600 Hz are ideal broadband swept sine noise with constant pressure in FEM. As shown in Figure 12, the acquired incident sound pressure spectrum at the entrance of the MWD fluctuates above 0.8 Pa from 500 to 1000 Hz, and the maximum fluctuation is close to 30%, which will affect testing results.

Frequency spectrum of the incident wave.
The proposed acoustic energy harvester may be used for self-powered wireless sensors detecting some physicals characteristics of the environment, for example, the water in the river or lake, or somewhere is not suitable for people to replace or maintain the chemical batteries.
Conclusion
In this article, a novel acoustic energy harvester, the piezoelectric QRPCs is presented and studied theoretically and experimentally. Using TMM, the structure band of the QRPCs is investigated and the sound localization effect is analyzed by FEM inside the QRPCs. The amplified sound excited the PVs to harvest the acoustic energy, and it is verified well in experiment. The results show that when the frequencies of the incident sound are near the both sides of the bandgap of piezoelectric QRPCs, maximum output voltage always can be got.
Both the simulation and the experiments show the relative position of the QWRs at the MWD affects the maximum output voltage of the different PVs at each QWR. The maximum value of output voltage on the PVs at the central of the MWD is often higher than those at both sides. The response curves of the sound pressure at the top of the QWRs agree well with these of the output voltage of the load. Meanwhile, the difference between the results of simulation and experiments is analyzed, and the main causes are presented.
Footnotes
Handling Editor: Jining Sun
Declaration of conflicting interests
The author(s) declared no potential conflicts of interest with respect to the research, authorship, and/or publication of this article.
Funding
The author(s) disclosed receipt of the following financial support for the research, authorship, and/or publication of this article: This work was supported by the Project of Natural Science Foundation of Shanghai (no. 14ZR1418600) and partly supported by the Project of National Natural Science Foundation of China (nos 51675324, 51175320).