
Abstract
Under the urban public transport conditions, engine operating points are lesser in the economic area. Motor operating points are scattered and its working efficiency is low. Besides, the battery state-of-charge value cannot be maintained at a certain value range. In order to solve the problems, this article uses the genetic algorithm to optimize the logic threshold control strategy and improve the fuel economy. The process of solving the objective function is attributed to the random search algorithm and is optimized by the fitness function. First, forward simulation platform of the hybrid electric bus is established by AVL CRUISE, MATLAB/Simulink, and Interface module. Second, based on the data which are collected from the actual operating conditions on the city bus, the actual operating conditions are divided into three categories: light load, middle load, and heavy load. The typical condition is selected as the simulation test condition in each case. Finally, in order to improve the fuel economy of the vehicle, the control parameters are optimized by the genetic algorithm and the optimized model is established. The main contribution of this article is the optimized energy control strategy to control hybrid electric bus’ energy distribution and reduce emissions. The strategy can be obtained by combining the logic threshold control strategy and genetic algorithm. The optimal engine torque and motor torque of the hybrid electric buses can be obtained by solving the objective function of equivalent fuel consumption. Compared to the original data model, the optimized parameter model can reduce the hybrid electric bus gas consumption, improve engine and motor efficiency, and better maintain state-of-charge values in a range under the typical operating conditions.
Keywords
Introduction
With the development of 20 years, hybrid electric bus (HEB) gradually matured with the products of the major manufacturers. 1 Great progress has been made in some aspects of the parameter matching of power system, control strategy, and regenerative braking strategy. In the fields of academic research, instantaneous optimization and global optimization have been applied to the hybrid control strategy. 2 In the mature application of the control strategy, the threshold-based control algorithm is widely used. 3
Because of the complex traffic and irrationality of energy management strategies, the natural engine has shortcomings of slow response and works in the inefficient areas. Due to the restriction of some objective constraints, the logic-based energy management strategy is not optimal in the running conditions. Besides, the traditional control strategy does not consider actual driving conditions which are affected by some dynamic factors. With the change in working conditions, the threshold value cannot be adjusted according to the optimal matching value, which leads to the failure of engine and motor operating points to follow the optimal distribution. 4 Based on the actual vehicle running status, it is found that the gas consumption of the HEB is not up to the ideal standard, and the battery state of charge (SOC) is in a low state and is not well maintained. SOC is also called residual power and represents the ratio of the remaining capacity of a battery over a period of time or a long period of time to the capacity on a fully charged state. First, the genetic algorithm is used to optimize the control parameters in the feasible region. 5 Second, the actual operating conditions of HEB are collected, and control parameters are matched by the actual operating conditions.
According to the problem of HEB low efficiency, Wang 6 proposes a method for optimizing the efficiency of individual assembly on the actual working conditions. According to the design of efficiency priority rules, the torque equalizing allocation of hybrid power system is designed. The optimized control strategy of the HEB can improve engine efficiency. The above have been studied by Dr Wang Baohua at Shanghai Jiao Tong University.6,7 In the study of Sijun, 8 genetic algorithm programming and ADVISOR simulation software are used to adjust the control parameters of the vehicle, mainly including gear transmission ratio. In the simulation phase, vehicle parameters are optimized by ADVISOR and genetic algorithm program. Montazeri-Gh et al. 5 adopted genetic algorithm to solve the optimization problem for an electric assist control strategy in order to meet the minimum fuel consumption and emissions while maintaining the vehicle performance requirements. However, specific steps of the design are lacked. Under different conditions, the data of the economic, SOC, and emission were used as the fitness function. According to the difference in target selection, three kinds of fitness functions are used to write the threshold value, including economy and emission. 9
In this article, control parameters of HEB are matched by the computer simulation technology. The purpose of the article is to improve the fuel economy of the vehicle by adjusting the control strategy without changing vehicle parameters. First, the simulation model of HEB is built by the AVL CRUISE soft. Second, the threshold control strategy model is built by MATLAB. Finally, two models are combined to form the vehicle simulation platform by the Interface model. Through the analysis, the relationship between the control parameters and the economy is obtained. At the same time, typical conditions are selected as the basis of working condition collection. According to the typical operating conditions, under the premise of meeting the constraints and minimum gas consumption as the objective function, the genetic algorithm is used to optimize the control parameters of the HEB.
Establishment of HEB simulation platform
HEB key component model
Engine model
The engine modeling is divided by two methods: experimental and theoretical modeling. In the actual model building, two methods have their own advantages and disadvantages. So, we generally use the combination of the two methods. Figure 1 is the engine model, where
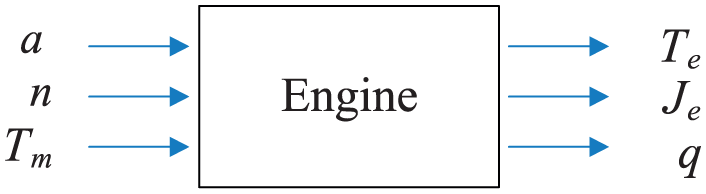
Schematic diagram of engine input and output.
The engine’s external characteristic power formula is


where
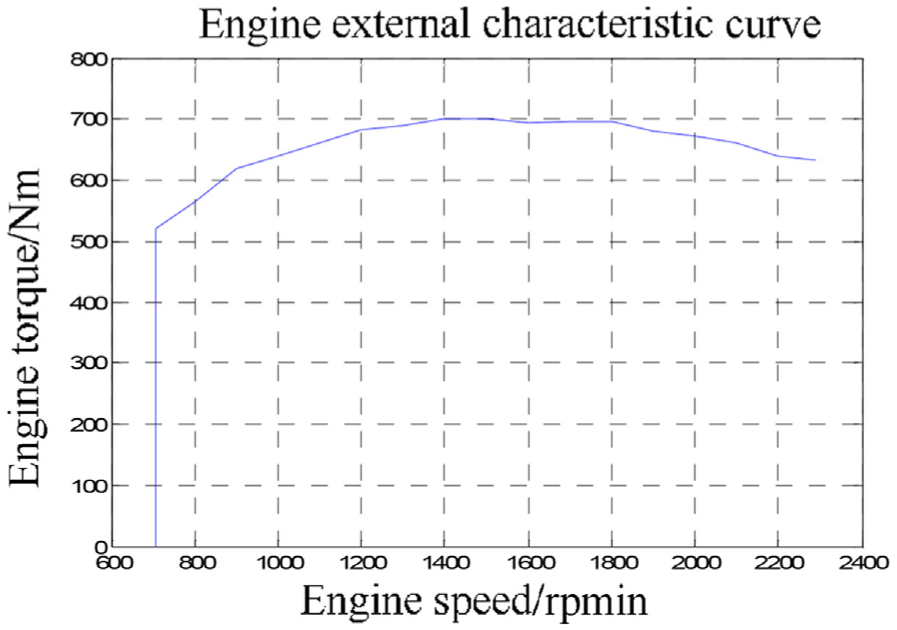
Schematic diagram of engine’s external characteristics.
Both the external characteristic and the partial characteristic curves of the engine are the steady-state characteristics of the engine. These properties are expressed as functions of throttle opening and engine speed. The function is

where
Motor model
In the HEB, the electrical machinery can be used as motor which is used as the auxiliary engine power, which can also be used as a generator. In the electrical machinery calculation, the actual output torque of the electrical machinery is

where
Electric power of the electrical machine is

where
The mechanical power of the electrical machine is

If the mechanical power is greater than zero, the electrical machine is as the motor mode or the generator mode.
Battery model
The power battery is connected by the series style in the HEB. In the model building process, input battery parameters are the initial charging rate, average voltage, maximum voltage, number of batteries, and temperature, as shown in Figure 3. 10
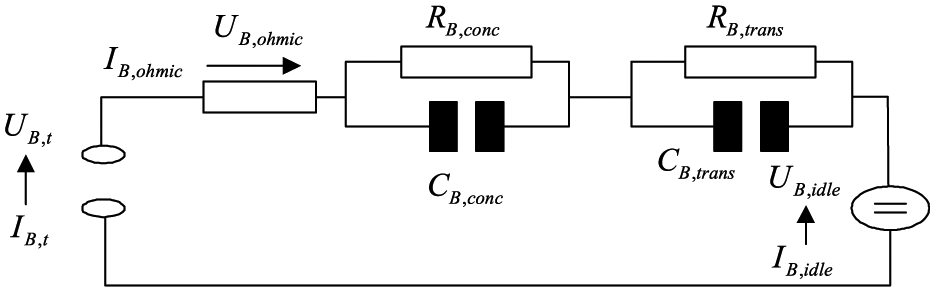
Battery model.
In Figure 3,


As current symbols affect static voltage and static resistance, the maximum battery charge current formula is

The maximum battery discharge current formula is

where

The maximum output power

where
Control strategy model of HEB
The article adopts the logic threshold control strategy. In the process of simulation, compared to the preset threshold values, the actual operating parameters of the vehicle trigger the corresponding control mode to achieve the corresponding control effect, as shown in Figure 4. 11
Schematic diagram of control strategy for HEB.
In order to control the vehicle, it is necessary to connect the data of simulation model with the control strategy. Interface module makes the CRUISE vehicle model used as a subsystem of the MATLAB/Simulink model and is called by the Simulink model. The control strategy outputs the following 10 driving modes: 1, hybrid drive; 2, driving charge; 3, engine drive alone; 4, electrical machinery shutdown; 5, parking charge; 6, sliding brake; 7, electrical machinery brake; 8, pure sliding; 9, parking; and 10, idle speed. The control strategy flow chart is shown in Figure 5.

Flow chart of vehicle control strategy.
Simulation platform of HEB
The HEB model is established by CRUISE software,11,12 as shown in Figure 6. The simulation platform of the HEB is composed of five sub-modules. The calculation module is responsible for calculating the fixed parameters of the output of the powertrain.

CRUISE model of the HEB.
The input module inputs the results of the CRUISE calculation into each module of the Simulink mode at a certain time step. According to the output parameter of CRUISE, the vehicle control module outputs the control mode of the HEB, distributes the vehicle working state vehicle of the engine and electrical machine, and makes output parameters export the display output module which display and output results. The vehicle simulation platform is shown in Figure 7.

Simulink’s schematic diagram of the HEB simulation platform.
Genetic algorithm matching for control parameters of HEB
Genetic algorithm is a random search algorithm, which has better performance in solving complex nonlinear problems, and defines the objective function and the penalty function using the compiling of fitness function. A genetic algorithm toolbox is embedded in MATLAB and is combined with the Simulink vehicle simulation model to solve.10,13
Real driving condition acquisition of the HEB
The threshold control strategy of parallel HEB has a great relationship with the working conditions, and driving conditions are needed to be studied. 14 In order to develop and improve the HEB model in a city, actual operating conditions are required to collect the data, and the vehicle model is adjusted according to the actual operating conditions. Therefore, the data of the actual operation conditions are collected for a period of 2 weeks and covering all day (including early and late peaks). The collected data of the 30 actual operating conditions are sorted, and according to the number of passengers and traffic conditions, conditions will be divided into three categories: light load smooth, middle load, and congestion. The data of three typical conditions are shown in Table 1.
Data processing results of typical working conditions.

In the simulation program, working conditions can be divided into two forms: one is the working condition data of working conditions with velocity, acceleration, and so on; the other is the working condition data of the main data characteristics with the power demand and torque demand. As the cycle average speed has the most significant impact on the economy, the light load and smooth, the middle load and slightly blocked, and the heavy load congestion are three kinds of working conditions, which optimize vehicle control parameters. The speed change curves under three conditions are shown in Figures 8–10.

Speed change curve under the light load condition.

Speed change curve under the middle load.

Speed change curve under the heavy load.
Correlation analysis of control parameters and economy of HEB
According to the reflected problems in the motor and the motor operating conditions, the article selects the control parameters which are closely related to the engine and the motor, and then matches the control threshold curve. 15 There are four control parameters:
Engine optimal economic zone cap;
Engine optimal economic area of the lower limit of 1 (0.3 < SOC < 0.45);
Engine optimal economic area of the lower limit of 2 (0.45 < SOC < 0.55);
The motor gear ratio.
Because the parallel HEB is affected greatly by the working condition, the threshold values of the upper and lower limits in the engine economic zone determine the output of the control mode in a single working condition. However, the electrical machine power ratio in every gear affects the vehicle power, battery SOC, and vehicle efficiency.
For example, the simulation test is carried out on the light load condition, and correlation results of the above parameters are listed to the HEB fuel economy, as shown in Table 2.
Effect of control parameters on simulation results.

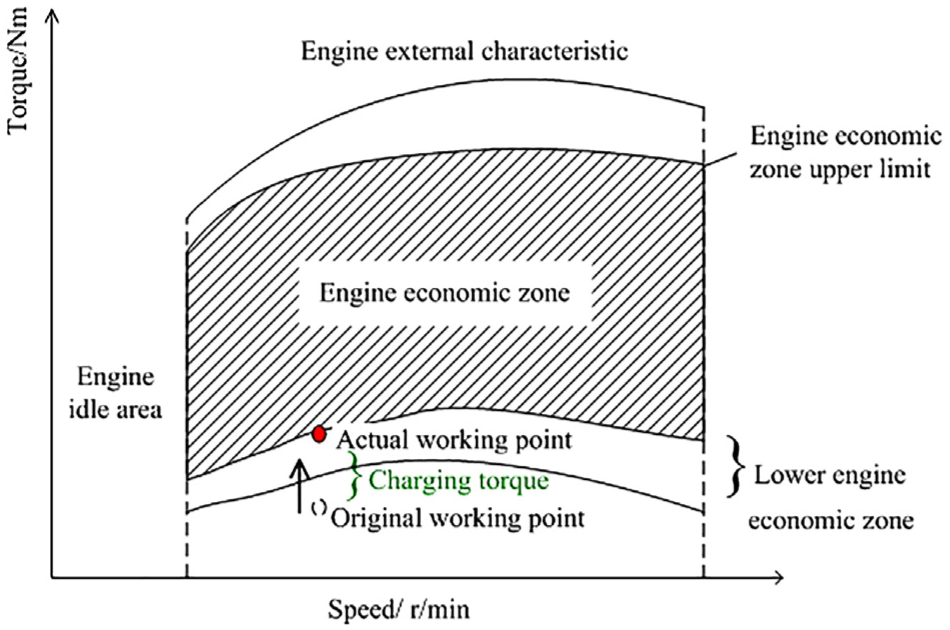
From Table 2, we can see that the upper limit of the engine economic zone has a great impact on gas consumption, while the lower limit has a great influence on the SOC. The effect of both is not interference on the vehicle performance. The upper limit can be used to adjust the gas consumption, and the lower limit is used to adjust the SOC value. Therefore, two parameters are optimized by the optimization method, and then, the motor power ratio is optimized. The upper and lower limits of the engine economic zone are optimized as shown in Figure 11.

Schematic diagram of engine economic zone optimization.
Programming design of the control parameter matching genetic algorithm
The genetic algorithm is used to solve the mathematical model of a problem by means of natural selection “survival of the fittest,” which is the solution of the minimum point of fitness function.16,17
In general, the algorithm selects the more competitive (less fitness function) as a parent. There are three different kinds of individuals in the generated offspring: Elite offspring (Elite): in the current generation, the individuals of the best fitness function are automatically inherited to the next generation as the elite; Hybrid progeny: the offspring is obtained by cross combination of parent arrays; Variant offspring: It is obtained through the random variation of the single parent array. The flow chart of genetic algorithm is shown in Figure 12.

Flow chart of genetic algorithm.
Genetic algorithm control parameters matching flow of the HEB
Taking the upper and lower limits of the engine economic zone as an example, the process of matching the control parameters is determined.
The upper limit of the engine economic zone is a curve. In order to achieve the optimal curve and get the ideal threshold value, the curve can be regarded as a series of fixed torque array.18,19 In the process of genetic algorithm optimization, a typical working condition is determined. In the hybrid drive mode, the genetic algorithm is used to match the array. In the process of Cruise operation, the data are input into the vehicle model by the form of array, and the upper limit value of the engine economic zone is obtained by inputting the engine speed signal. 20 In the matching process of genetic algorithm, the workflow is as shown in Figure 13.

Flow chart of genetic algorithm to optimize control parameters.
After the start of the optimization process, first, under the constraints of the initial population, random initial population is generated by the genetic algorithm and calculated. Second, the initial population is substituted into the simulation model of operation and the fitness function is calculated by simulation results. According to the algorithm, a new population is generated by the current population. Then, after optimizing the upper limit at the engine economic zone, the upper limit is fixed. Repeat the above steps to solve the optimal value at the engine economic zone. The upper and lower limits need to be reset. After determining the upper and lower limits in the engine economic area, the motor gear ratio is optimized.
Control parameter matching genetic algorithm fitness function of the HEB
Fitness function embodies the optimization objectives of application and constraints, and the need to return the fitness function in genetic algorithm values to select individual in the population. 21 Fitness function and target function is the contrary and defined target when the objective function is defined. The choice is optimal when the value of the objective function is high. The genetic algorithm is set with the minimum standards as select individual fitness function. The relationship between fitness function and target function can be obtained as

where

where
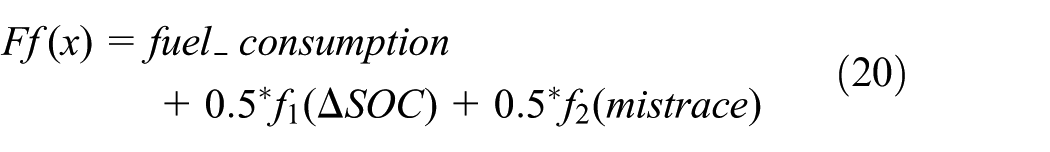
In the writing process of fitness function, two values are joined. Taking the difference of the final value and the initial value of SOC, and the average of the actual speed difference as a constraint, the two values are, respectively, designed with the penalty function, and add those three functions as a fitness function. The minimum fitness function is regarded as the optimal solution
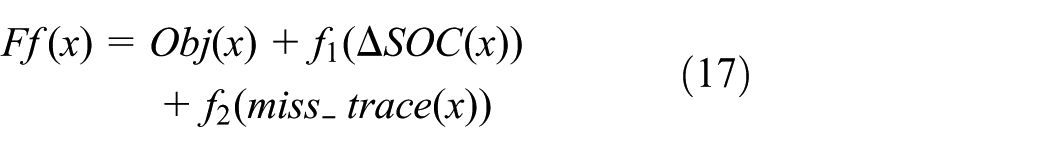
where x is the need to optimize parameter, engine discrete torque value of the upper limit value of the economic zone. Define ΔSOC as the difference value of final SOC’s and initial SOC’s 100 multiples. When the final value of SOC is smaller than the initial value 0.1, the penalty function shot up, and the expression is shown in formula (18)

where

ΔSOC penalty function curve.
The simulation results show that the average difference value of ideal speed and actual speed is generally between 0.1 and 0.2, and define mistrace as many as 20 times for this difference value. This is the penalty function of speed tracking parameter
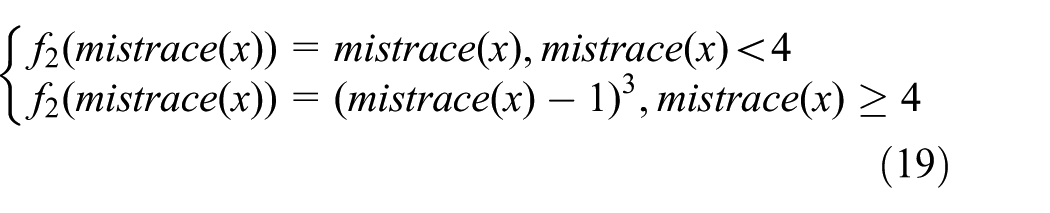
After defining the penalty function, the fitness function is defined for the optimizing parameters, as shown in Figure 15.
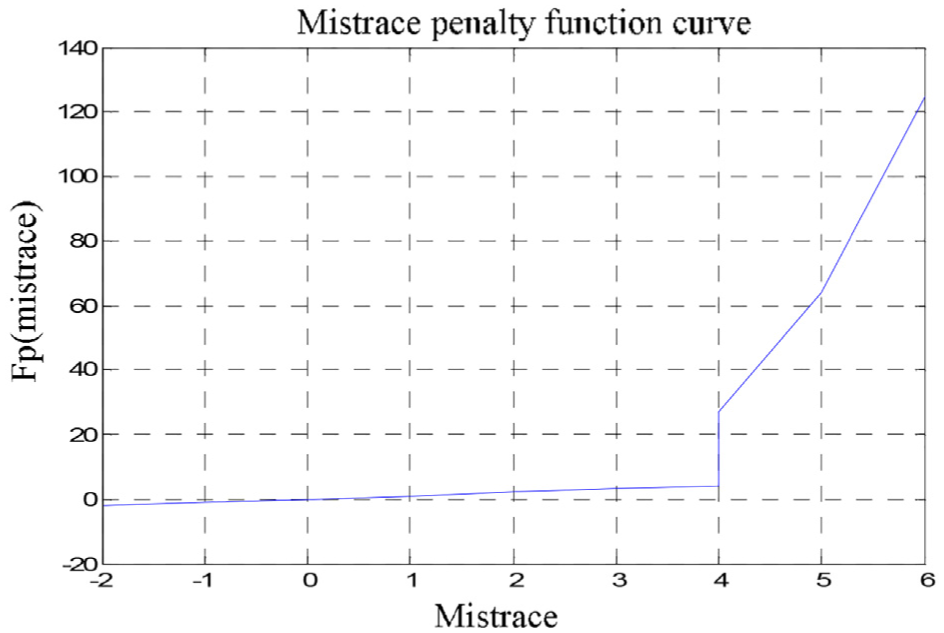
Penalty function curve of average speed difference.
First, the fitness function is written for the upper limit of the engine economic zone. Because the upper limit of the economic zone has little effect on the SOC and the dynamic performance, penalty functions for the two items are all 0.5
Second, the lower engine economic zone is optimized. Because the lower limit of the economic zone has great effect on the SOC,

Finally, the parameters of the electrical machine assist ratio are optimized and have greater influence on economy and vehicle power. The

Genetic algorithm control parameters matching by MATLAB toolbox
In this article, the genetic algorithm is optimized by MATLAB programming fitness function, and set by the genetic algorithm toolbox. The variables of genetic algorithm are defined, and the upper and lower bounds of the variables are as shown in Table 3.
Upper and lower bounds of the control parameters.

Application of genetic algorithm in matching parameter analysis
Under different operating conditions, the rematching of the control parameters will affect the distribution of the engine and the electrical machine operating point, and then affect the economy and power simulation results. Therefore, through the theoretical analysis of the distribution of the electrical machine and its operating point, it can be concluded that the working condition of the power system is affected by the change in the control strategy. 22
Comparison of engine operating points
Under different driving conditions, the two engine operating points are compared on the original model and single parameter optimization model. Under two conditions, engine operating points are shown in Figures 16–18.

Engine operating points on the light load condition, from top to bottom: original parameters, genetic algorithm matching.
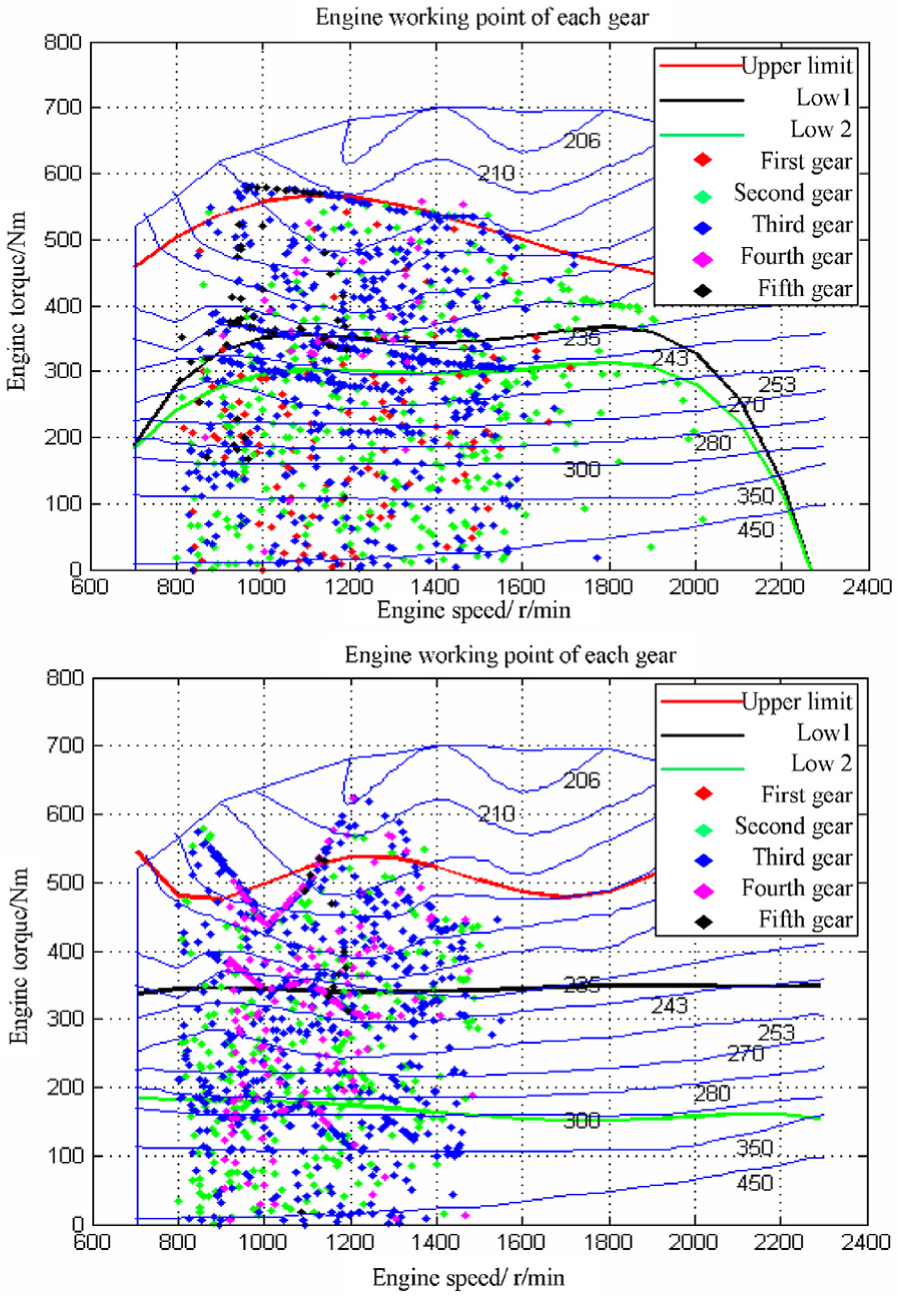
Engine operating points on the middle load condition, from top to bottom: original parameters, genetic algorithm matching.

Engine operating points on the heavy load condition, from top to bottom: original parameters, genetic algorithm matching.
Light load conditions
In contrast with the original data, it is found that the operating points of the engine are mostly concentrated in the 1500 r/min after the parameter optimization. At the economic zone and the above region, engine operating points relatively increase, especially in the above economic zone. The change in these working points leads to economic improvement.
Middle load conditions
In Figure 17, compared to the original vehicle model, throttle operating points of the second gear significantly reduce and increase in the regional economic. The second throttle points significantly reduced the parameters of genetic algorithm on the matching model, and increased on the genetic algorithm matching model. Meanwhile, engine work points increase in the geometric fuel consumption region. The reason is that most of the new economic zone is between 270 and 220 in the ratio of fuel consumption, and leads to increase in the engine operating points in this interval. Therefore, the optimization model reduces the gas consumption.
Heavy load conditions
In the heavy load condition and on the optimization model, the distribution of engine operating point is changed little. The main reason is the reduction in throttle operating points, and the engine operating points increase in the ratio of fuel consumption range of 270–235 g/kW·h. The above shows that the drive mode operates according to the control strategy.
Comparison of the electrical machine working points
The operating points of the electrical machine in the two models are shown in Figures 19–21.
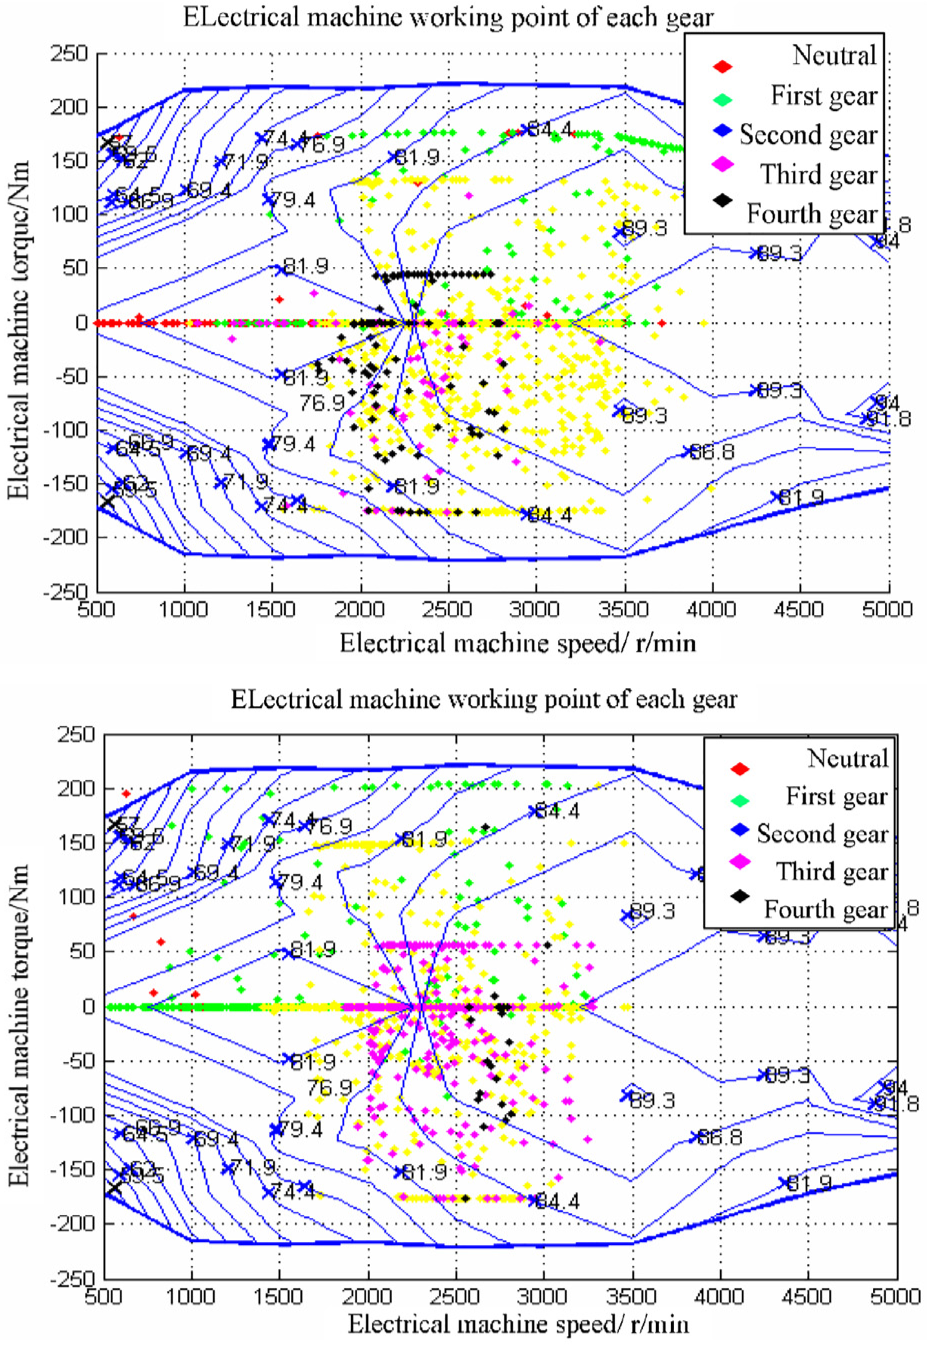
Working points of the electrical machine under light load condition, from top to bottom: the original parameter.

Working points of the electrical machine under middle load condition, from top to bottom: the original parameter.

Working points of the electrical machine under heavy load condition, from top to bottom to right: the original parameter.
Light load conditions
In the light load condition, compared to the original model, operating points of the electric machine are less in the low-efficiency area. In the low-speed region, the electric machine outputs higher torque. Meanwhile, the high-power output and the economy of the engine are ensured. In the high-position work point, torque and efficiency of the electrical machine are improved. In the 81% efficiency zone, operating points of the electrical machine increase and the overall efficiency of the electrical machine is improved.
Middle load conditions
In the middle load condition, the optimized model has removed the operating point of the above 3500 r/min. In this way, the output operating points of the high-efficiency zone are reduced, but engine operating points with high fuel consumption rate are reduced. With the increase in the operating point of the electrical machine in the intermediate efficiency area, the economy of the whole vehicle is improved.
Heavy load conditions
In the heavy load condition, low-efficiency operating points of the electrical machine account a large proportion. In the simulation operating point diagram of the original model, the engine output high speed and work out. These operating points are mostly the starting operating points in the second gear; are not in the engine economic zone; and have a negative impact on the economy.
After removing these points, the vehicle economy is improved. However, the optimized model has better performances in battery SOC, economy, and power.
Comparison of vehicle performance simulation results in actual typical conditions
According to different conditions of the light load, middle load, and heavy load, control parameters are matched by genetic algorithm. For each kind of typical conditions, the optimization regional limit values of the vehicle engine and optimal operation parameters of the motor power ratio are, respectively, optimized. The original model and a single condition matching model are, respectively, simulated under the three typical operating conditions of the light load, middle load, and heavy load. The simulation results are shown in Table 4.
Simulation results of different typical conditions.

From Table 4, it can be seen that in the typical operating conditions, compared to the original parameters, the gas consumption of the HEB can reduce about 10% by the genetic algorithm. On the premise that the power of the HEB is basically unchanged, the SOC value can be well maintained at 0.45 at the different conditions. The simulation model which uses genetic algorithm to match the control parameters can be better than the original data model in terms of gas consumption, battery SOC maintenance, and vehicle speed tracking.
Conclusion
In order to reduce the gas consumption and maintain a good battery power balance, this article adopts the genetic algorithm to optimize the energy control strategy of HEB. According to the characteristics of control parameters, combined with the actual acquisition data, the data search method of the genetic algorithm for typical conditions is put forward to match the parameters in typical operating conditions. In this article, the collected data are classified and the typical conditions are selected. According to a single typical working condition and the relationship between control parameters and economy, control parameters are matched with high economic relevance. According to the influence of different parameters on the economic parameters, the optimization scheme is established. According to the selected threshold values which affect the economy and dynamics, the optimal order is put forward. The threshold curve points of the control strategy are interpolated, and every interpolation point is optimized. For each control parameter of the engine and electrical machine, the fitness function is written their as constraints. Finally, the rematch results of control parameters are obtained under each typical condition. Its application for the designed control model of HEB is shown to demonstrate the genetic optimal approach. Through the comparison of simulation results, the engine and the electrical machine’s working efficiency and maintaining a SOC value are better than the parameter data of the original model by the genetic algorithm. Besides, the fuel economy of the HEB increases about 10% under various typical conditions.
Footnotes
Handling Editor: Anand Thite
Declaration of conflicting interests
The author(s) declared no potential conflicts of interest with respect to the research, authorship, and/or publication of this article.
Funding
The author(s) received no financial support for the research, authorship, and/or publication of this article.