
Abstract
Small but complicated labyrinth channel emitters are easily clogged. In this study, computational fluid dynamics–discrete element method coupling approach was employed to investigate the mechanism of emitter clogging caused by particles in size of 65, 100, and 150 µm. Computational fluid dynamics used Navier–Stokes equation to analyze flow characteristics of continuous phase. Discrete element method used Newton’s laws of motion to measure single particle motion and group distribution of disperse phase. Particle tracking velocimetry was also utilized to follow the trajectories and velocity of single particle. Our results indicated that the smaller the particle size, the less the total force. Tiny sands were mainly influenced by drag forces. The amplitude between tooth tips was small. Particles moved basically in the main stream with fast velocity and short travel distance, thereby having good following performance. It took shorter time to reach micro-dynamic balance. Meanwhile, the amount of sediments in the labyrinth channel was less. Particles in size of 150 µm were mainly affected by inertial forces. They can easily enter vortex areas. Sands staying longer than 0.1 s in the labyrinth channel accounted for 37.9% of total number. Sand groups were mainly distributed at the inlet of labyrinth channel. The more sands trapped in vortex areas, the easier it was to precipitate and cause emitter clogging.
Introduction
So far, as the most water-conserving precision irrigation technique, drip irrigation can effectively alleviate the shortage of water resources. Emitter is the most important part of the irrigating system. Besides, labyrinth channel emitter is presently one of the most extensively applied drippers. 1 However, the flow passage of the labyrinth channel emitter is narrow, resulting in easily clogging by solid particles, organics, and microbes. 2 For example, the average sediment concentration of the main stream of the Yellow River reaches up to 35 kg/m3 over the years, which brings great risks to the currently running irrigating systems in that area. 3 Although sediment content is considerably reduced using filtration apparatus, sand granules can still enter the channels. Nowadays, more and more researches have been focused on whether those sands will precipitate and cause emitter clogging or not.
Nakayama and Bucks 4 considered suspended particles as a sensitive factor that had brought about the clogging of emitters. Camp 5 thought total suspended solid (TSS) was closely related to emitter blocking. Many studies have been done on the movement of solid particles in the flow channels including computational fluid dynamics (CFD) numerical simulation of the two-phase flow and particle tracking velocimetry (PTV) particle movement measurement. CFD modeling has been a major interest of researchers in engineering field.6,7 Li et al. 8 investigated water and sediment two-phase flow in the channel of emitter with CFD. Our research optimized the structure of labyrinth channel and significantly reduced emitter clogging using external factors. 9 Wei et al. 10 measured solid particle movement in the flow channel using PTV and confirmed the results of CFD simulation. But CFD simulation is based on discrete phase mode (DPM) in Lagrangian coordinate system. Particles were added after flow field calculation without considering the influence of particles on the flow field or the collisions among particles or between the particles and the wall. Although grain flow in the emitter is dilute-phase flow, the velocity and direction of water changes frequently. Therefore, either the collision among particles or that between the particles and the wall is not to be neglected. Classical discrete element method (DEM) model was proposed by Cundall and Strack. 11 In recent years, CFD-DEM coupling system was developed to determine the collision among granules or between the granules and the wall. However, no numerical simulation of particle movement in the emitter has been reported. In this study, CFD-DEM coupling approach was adopted to investigate movement and distribution of sediment in the flow and the possible blocking positions caused by granules. PTV was employed to determine the direction and velocity of movement. Our study revealed the mechanism of emitter clogging and provided theoretical foundation for flow channel structure optimization. The CFD and DEM software used in this research was Fluent12.0 and EDEM2.2, respectively.
Materials and methods
Physical model and boundary conditions
The structure of tooth shape labyrinth channel was indicated in Figure 1(a). The flow path was closely against the inner wall of drip irrigation pipe. Water in the drip line entered channel through filter grid, then converged at the exit after energy dissipation and finally effused from the drip line after punching in the corresponding positions of pipe. There are a variety of channel dimensions. The dimensions adopted in this study are illustrated in Figure 1(b). The flow path had a length (S) of 20.62 mm, and depth (D) of 1.41 mm. The sectional area (A) was 1.33 mm2. The angle of the tooth prong was 65°. The tooth space width (L) was 2.2 mm, and the tooth height (H) was 1.2 mm. In line with the actual operational condition of the drip irrigation system, pressure boundary conditions for the inlet and outlet were defined. If the inlet pressure is 50,000 Pa and 0 Pa is the outlet pressure, others are wall boundary conditions. By adopting the finite volume method, the better simulated results can be got from the small size of flow path and the grid spacing set at 0.1 mm. As shown in Figure 1(c), the mesh number of hexahedron was 39,830 after gridding, little influence on the final results was found when using even finer grids.
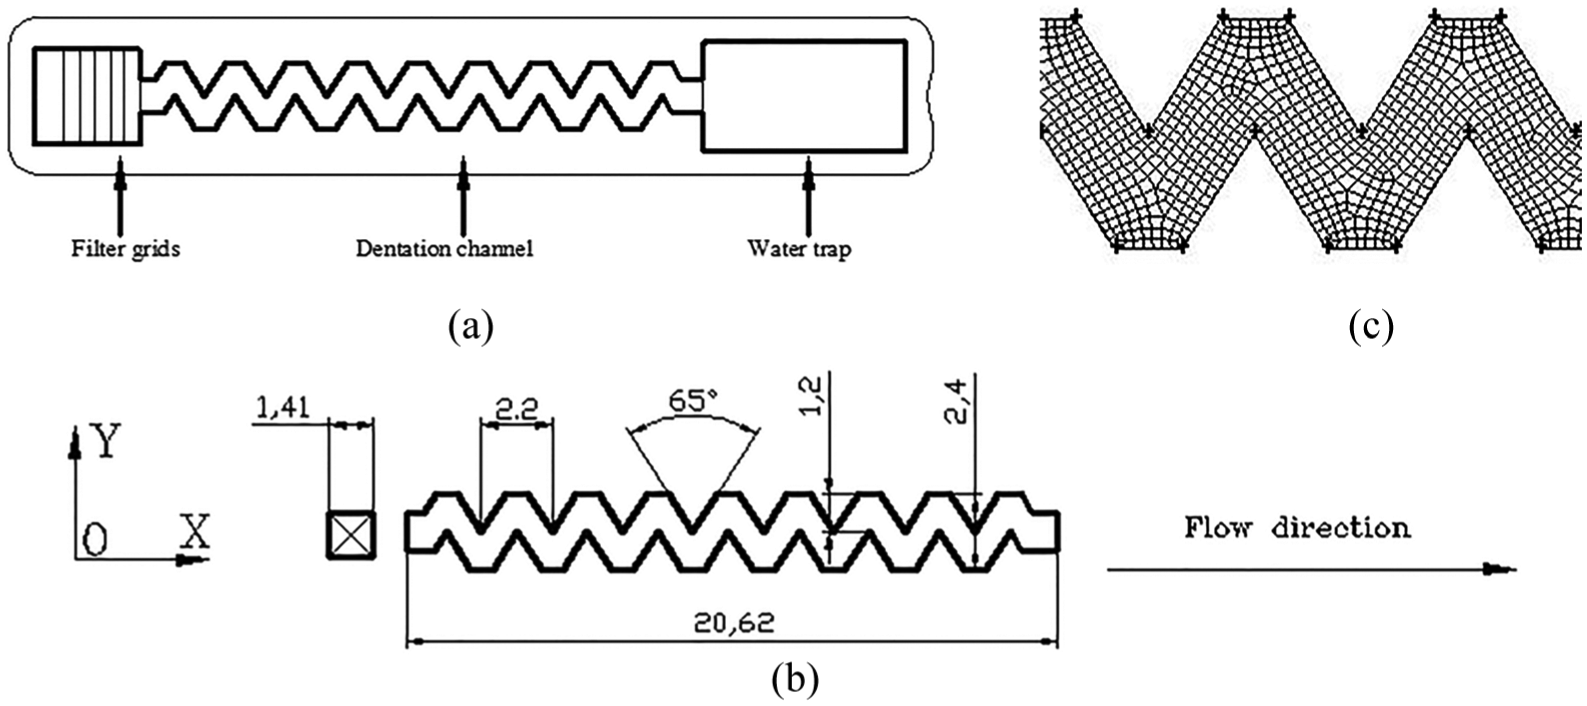
CAD model of the emitter with geometrical parameters: (a) structure of tooth shape labyrinth channel, (b) dimensions of tooth shape labyrinth channel, and (c) hexahedron mesh.
Mathematical model and simulation method
The flow in channel can be considered as a viscous incompressible fluid, running under normal temperature. The effect of gravity and channel wall roughness was regarded. The influence of surface tension was ignored. At present, Reynold’s number of emitters (Re) is roughly among 78–1284. Nishimura found that laminar turbulent transition occurred when Re was between 200 and 350, which was far less than the critical Reynold’s number of the conventional straight path.12,13 Other similar experimental results were also reported at a number of times. 14 There are two reasons for this: first, because of the small cross-sectional area of the flow passage which can be easily affected by the roughness of the wall and so on; second, because of the labyrinth’s complicated flow channel boundaries, the structures are bending and changeable which is more likely to turn laminar flow to turbulent flow as shown in equation (1) 15

where Re is Reynold’s number, ρ (kg/m3) is the density of fluids, V (m/s) is the average velocity, R (m) is the hydraulic radius of flow, and µ (kg/(m s)) is the viscosity coefficient of fluids.
The working pressure of emitter was 50,000 Pa, the rated flow was 4.85 L/h, and Reynold’s number Re was 286. The unsteady standard k − ε turbulence model was adopted for the simulation of continuous phase.
The continuity equation is 16

The momentum equation is

ρ is the density of fluid; ui and uj are both fluid velocity, which is the sum of average fluid velocity and turbulent velocity; and µ is dynamic viscosity.
Sediments used belonged to dilute phase flow with the maximum particle volume fraction of 1%. Lagrangian coupling system was adopted in this study. Table 1 indicates the specific parameter settings. The total time of numerical simulation is 1.0 s, and every time increment size is 0.001 s. The total record is 1000 times. The discrete approach was employed to simulate sand movement, collisions among granules and between granules and the wall, the effect of sand movement to the surrounding continuous phase, and energy and momentum exchange. Collisions among sands and between sands and the wall did not lead to significant plastic deformation, thereby attributing to hard particle contact, which is a wet grain contact model. “Hertz–Mindlin (no slip) built-in” was utilized in this study.
Parameters used in the model. 17

The overriding consideration in the process of calculation was viscous drag force and gravity. Other additional forces such as pressure gradient force, virtual mass force, and Saffman force had smaller order of magnitude compared with the former; thus, they were not considered. 18 The referring equations 19 can be seen in Table 2.
The referring equations and specifications.

The two-way coupling process of CFD and DEM is as follows: continuous phase was solved by CFD to acquire fluid drag force in sediments, which was transformed from flow field information through drag force model. The stress state of sediments was measured by DEM to obtain new information such as position and velocity of sands and counter reflect to the flow field. CFD was used to renew the flow and produce the latest stress condition of sediments. The two approaches were coupled by a certain model that carried out transmission of mass, momentum, and energy.
PTV flow test platform and experimental sediments
PTV experimental platform consisted of continuous light source, high-speed camera, and VS-M0910 magnifying lens (Figure 2). Movias Pro Viewer 1.63 analysis software can calculate the velocity of particles and display direction of movement according to the distance they move per unit time. The test platform was engraved in plexiglass using numerical control machines, covered by Lucite plate with good light transmission to seal the flow channel. In this experiment, 100 sieve and 120 sieve screen meshes were utilized to sift out grains at a diameter of 150–125 µm. In all, 150 sieve and 180 sieve screen meshes were employed to sift out sands at a diameter of 100–90 µm. In all, 270 sieve and 220 sieve screen meshes were used to sift out grains at a diameter of 65–58 µm. In total, 10 continuous grains of sand were collected to analyze their movement. Particles were delivered at a concentration of 12 g/L and stirred constantly in the water tank to ensure a moderate sediment content and even distribution in flow. For CFD numerical simulation, the maximum of particle size was adopted such as 150, 100, and 65 µm.

PTV experimental platform.
Results and analyses
Characteristics of flow field of continuous phase
Figure 3(a) shows the pressure distribution chart at half of the channel depth under 50,000 Pa working pressure. There was no energy exchange with the outside. Friction loss and minor loss were provided by pressure drop. A linear reduction of pressure in the direction of flow was found. Besides, the pressure drop in each unit was approximately the same. Figure 3(b) indicates the velocity distribution chart at half of the channel depth under 50,000 Pa working pressure. Except the first unit at the inlet, velocity distribution at other inlets was basically the same with the speed range of 0.18–2.91 m/s. The flow velocity reached maximum near the tooth tip, and the minimum appeared approaching the center of wall and vortex. Figure (4) shows the velocity streamlines of the fourth unit under 50,000 Pa working pressure. A represented the main flow. B represented the vortex area. In Figure 3(b), each vortex area was labeled with a number with a total of 17 vortex areas. The flow channel consisted of an inlet, a middle part and an outlet. (1)–(6) indicated inlet. (7)–(11) represented the middle part, and (12)–(17) indicated outlet. It suggested that there was an obvious boundary between the main stream and vortex area. The main stream was close to the tooth tip, which changed with the position shift of the tooth tip. The instantaneous velocity was approximately 1.1–2.91 m/s. The vortex areas were away from the tooth tip and the main stream, which formed some independent closed areas with instantaneous velocity around 0.18–0.53 m/s.

The distribution chart of pressure and velocity at half of the channel depth under 50,000 Pa working pressure: (a) pressure distribution chart and (b) velocity distribution chart.

The velocity streamlines of the fourth unit under 50,000 Pa working pressure.
Analysis of representative sediment movement
Sediments entered labyrinth channel after releasing at random location of inlet. The initial velocity was the average flow rate which was 1.02 m/s. Figure 5 shows the direction of movement of representative sediments in a diameter of 65, 100, and 150 µm, respectively. Particles in size of 65 µm mainly moved in the main stream without entering vortex area, thereby indicating very good following performance. When the diameter increased to 100 µm, particles moved primarily in the main stream. However, the motion amplitude in the Y-axis increased with four times entering the 16th vortex area. Compared with 65 µm sands, their paths are in disorder. For particles in size of 150 µm, the moving trajectory was more disturbed with larger amplitude in the Y-axis and multiple times of departure from the main stream entering several vortex areas. The reasons are that the drag force on sediments is proportional to the square of the particle size. But the inertial force is proportionate to the cube of the diameter of sands. The force condition of different sediments varies in different sizes. For particles in the size of 65 µm, the drag force was far beyond the inertial force. Hence, sands moved only in the main stream. With the increase in diameters, the drag force and inertial force tended to equilibrium. For sediments in the size of 100 µm, the drag force was close to the inertial force, which enhanced the probability of sands into the vortex. When the diameter went up to 150 µm, the inertial force became the major force. Particles tended to leave the main stream and enter vortex areas under the effect of inertial force. Thus, the trajectories of sediments were disarranged. All sand movement displayed various degrees of disturbance due to rapid change of flow directions in the channel, especially in the vortex area with flow velocity at approximately 0.18–0.53 m/s. Both velocity and sand movement were slow. Sediments underwent endless circular low-speed motion if they could not leave the vortex area. With the increase in time and numbers, they could easily form adhesive aggregates and cause emitter clogging.
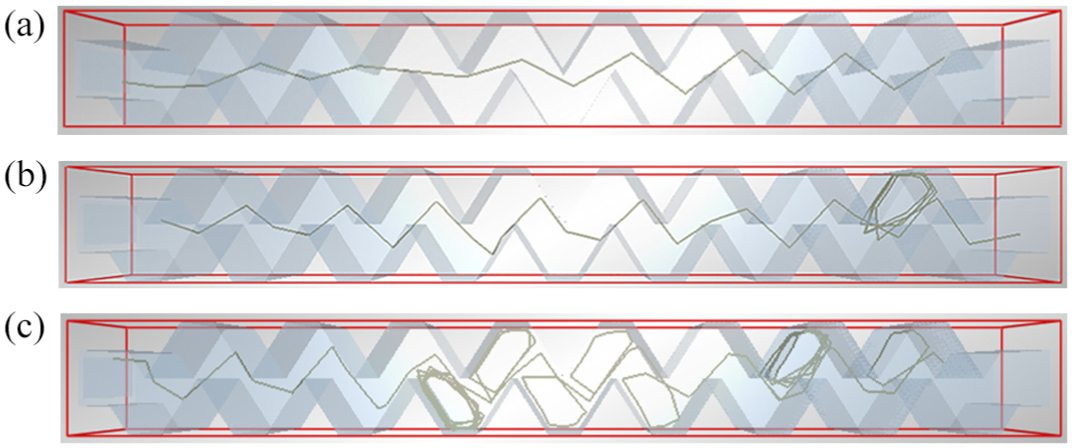
Numerically obtained particle trajectories in the channel: (a) particles with a diameter of 65 μm, (b) 100 μm, and (c) 150 μm.
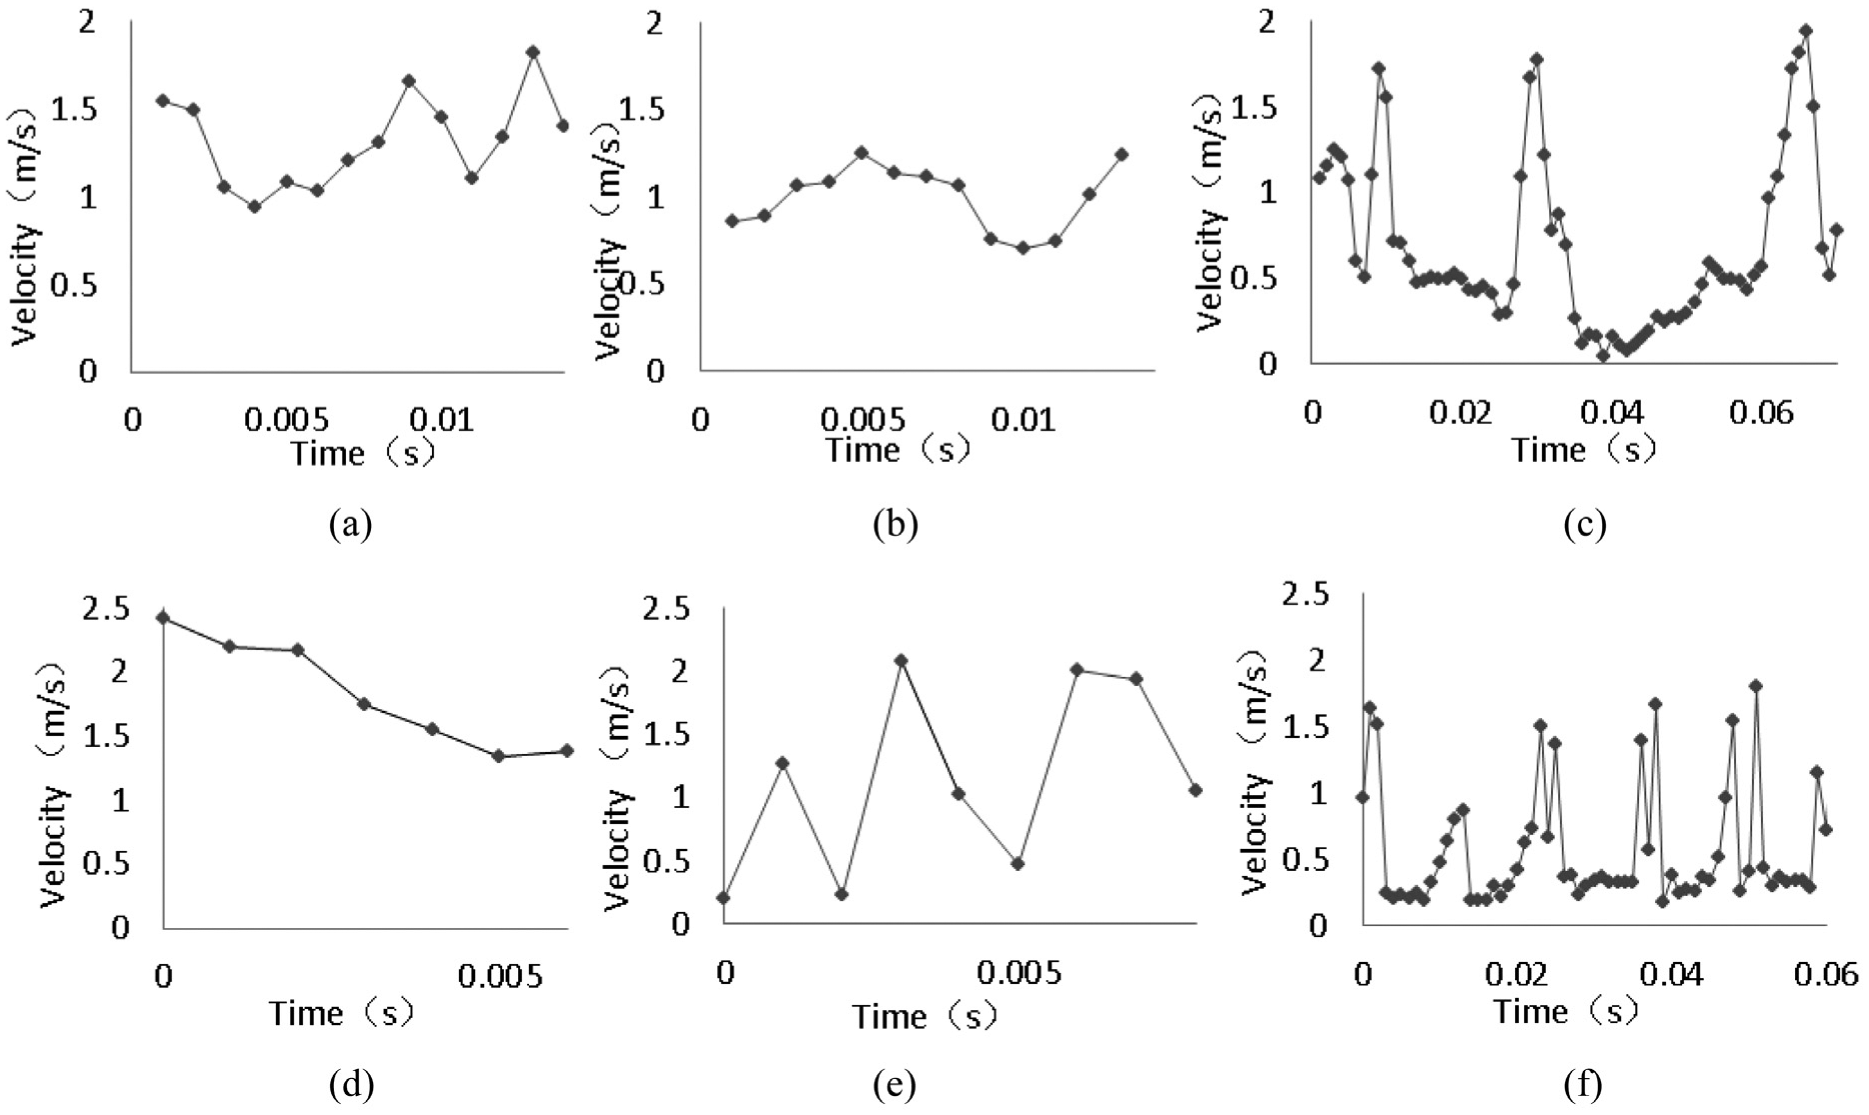
Figure 6 shows the velocity and total force of the representative sediments in Figure 5. For particles in the size of 65 µm, the force was even with small variations. The force was small with the magnitude at 10−7–10−6. The corresponding velocity change was small. The range of velocity was 0.76–2.37 m/s. The average velocity was 1.48 m/s. For particles in the size of 100 µm, the variation of force was complex with magnitude at 10−6. The corresponding velocity changed considerably. The range of velocity was 0.08–2.05 m/s. The average velocity was 0.77 m/s. For particles in the size of 150 µm, the variation of force was complicated and huge. The absolute value of force was also great with 10−6–10−5 in magnitude. The frequency of velocity changed drastically. The range of velocity was 0.07–1.80 m/s. The average velocity was the lowest, which was 0.55 m/s.

Velocity and force condition of representative sand particles: (a) particles with a diameter of 65 μm, (b) 100 μm, and (c) 150 μm.
PTV tracing of sediments
Figures 7(a)–(c) and 8(a)–(c) indicate the trajectories and velocity of representative sand movement in diameters of 65, 100, and 150 µm measured by PTV. In all, 10 grains of sand were traced, respectively. Due to limitations of viewing region and clarity, only the fourth and fifth channel units, including the main stream of the fourth and fifth channel units and the 7th, 8th, 9th, and 10th vortex areas, were measure in the PTV experiment in this study.

PTV traced and numerical obtained of particle trajectories: (a) and (d) particles with a diameter of 65 μm, (b) and (e) 100 μm, and (c) and (f) 150 μm.
PTV traced and numerical obtained of particle velocity: (a) and (d) particles with a diameter of 65 μm, (b) and (e) 100 μm, and (c) and (f) 150 μm.
Figures 7(d)–(f) and 8(d)–(f) indicate the trajectories and velocity of representative sand movement in diameters of 65, 100, and 150 µm measured by numerical simulation, they are the same fourth and fifth channel units measured by PTV. The movement trajectories of sands, namely the representative sands’ trajectories in the fourth and fifth channel units, are shown in Figure 5(a)–(c). The velocity of the representative sands is what presented in the fourth and fifth channel units of Figure 6(a)–(c). The motion laws of sands measured by PTV and numerical simulation are almost the same. With the increase in sand sizes, sediments turned to be more and more disturbed in the channel.
For particles of 65 µm in size, 10 sand trajectories were approximately the same. No circular motion was detected. The amplitude in the Y-axis was small. The following performance of sand was great. A representative sand trajectories 7(a), exactly similar 7(d). The average velocity of sands from the PTV was 1.32 m/s, the average velocity of sands from the numerical simulation was 1.82 m/s, and almost all velocities were larger than 1.0 m/s. Therefore, the conclusion is that the sand movement mostly stays in the main flow area and passes through the fourth and the fifth units at higher velocity (see Figure 8(a) and (d)).
For particles of 100 µm in size, 1 of 10 grains underwent one time of circular movement. The amplitude in the Y-axis increased. A representative sand trajectories is shown in Figure 7(b). The same situation also occurred in numerical simulation and it is shown in Figure 7(e). The average velocity measured by PTV was 0.99 m/s, whereas the numerical simulation measured number was 1.14 m/s. More than half of the time, the movement velocity was between 0.5 and 1.0 m/s which was apparently lower than the velocity of the 65 µm sand, which explained that although the sand movement was in the main flow area, the larger the amplitude of vibration, the more declining of the velocity (see Figure 8(b) and (e)).
For particles of 150 µm in size, 9 of 10 grains underwent circular movement, among which one grain had endless circular motion within limited tracing time. A representative sand trajectories 7(c). In numerical simulation, the results showed that sands entered into vortex area to have a circulation movement which can be seen in Figure 7(f). The average velocity of sands measured by PTV was 0.68 m/s, while the average velocity from the numerical simulation was 0.57 m/s. For most of the time, the velocity of the sands was lower than 0.5 m/s and that is apparently lower than the velocity of 65 µm and 100 µm. Sands moved in vortex area for most of the time with low velocity and they even could not escape from vortex area (see in Figure 8(c) and (f)).
Analysis of movement of sand clusters
Figure 9 shows the distribution of sand clusters in the size of 65, 100, and 150 µm at different time. The sediment volume was calculated at 1%. The time was 1 s. The total number of grains detected in 1 s was 36,215, 25,658, and 7592, respectively. In combination with Figures 6–8, they suggested that particles in the size of 65 µm and 100 µm moved fast. The input speed was also fast. It reached micro-dynamic balance inside the flow channel in a short time (0.03 s and 0.05 s, respectively, as shown in Table 3). However, the velocity of particles in the size of 150 µm was low. Hence, the input speed was slow. It took a long time to attain micro-dynamic balance (0.50 s as shown in Table 3). Therefore, the time points in Figure 9(a)–(c) were different. For particles in size of 65 µm, all sand clusters moved in the main stream without entering any vortex area. The trajectories were almost the same. In the effect of the drag force, particles got over the inertial force and exhibited very good following performance. For particles in size of 100 µm, most of sand clusters moved in the main stream with lesser grains getting into the vortex area. The trajectories were similar. The drag force and inertial force were close, but the drag force was dominant. Sediments had good follow-up ability. For particles in size of 150 µm, the vast majority of sands got into vortex areas, all grains had distinct trajectories, and the inertial force was dominant, particles showed bad following performance.

Distribution of sand groups at different moments: (a) particles with a diameter of 65 μm, (b) particles with a diameter of 100 μm, and (c) particles with a diameter of 150 μm.
Characteristics of sand groups in flow channel at t = 1 s.

After sand clusters reached dynamic equilibrium, the number of sand particles in the size of 65, 100, and 150 µm in the channel was 632, 671, and 1155, respectively. A certain fluctuation may happen. As indicated in Table 2, more particles occurred in the channel with bigger diameter and longer time. Part of sediments had comparatively longer run time, for example, for particles in size of 150 µm, at t = 1.0 s, 0.6% of sediments moved longer than 0.3 s in the channel. 5.1% of sediments moved longer than 0.2 s. 32.2% of sediments moved longer than 0.1 s. 33.2% of sediments moved longer than 0.044 s. The reason of this phenomenon is due to participation of particles in the circulation. On the contrary, it took only 0.044 s for particles not involved in the circulation to pass through the same channel, which accounted for merely 0.84% of total sand clusters (Table 4). Sediments were difficult to escape from vortex areas in the effect of inertial forces. This is the major cause of emitter clogging.
Characteristics of sand groups through flow channel in 1 s.
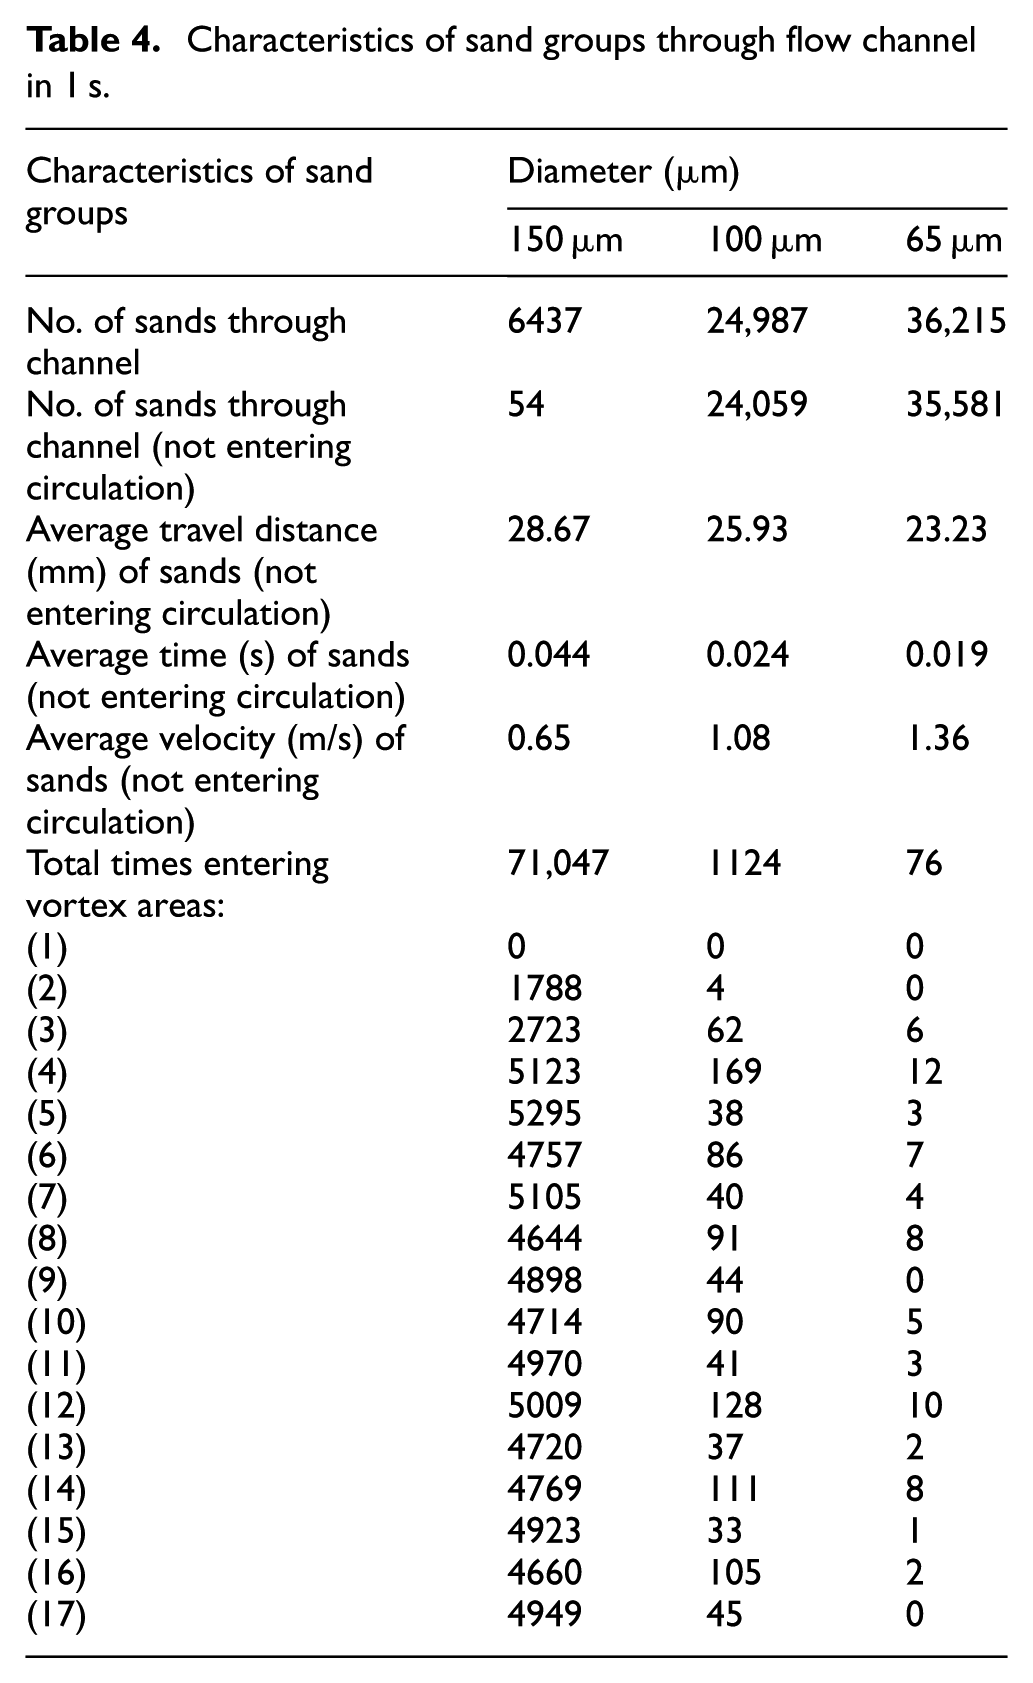
The characteristics of sand clusters running through the whole channel in 1 s are indicated in Table 4. The circulating times increased with enlarging particle sizes. The corresponding circulating times for particles in size of 65, 100, and 150 µm were 76, 1124, and 71,047, respectively. The circulating times in different vortex areas were arranged in descending order as outlet, middle, and outlet. The velocity reduced with rising numbers of circulation. Under the influence of surface charges, particles tended to accumulate and precipitate to cause the clogging of emitters. Our results were similar to those in other reference. 20 The distribution of circulating times not only had a certain regularity, which occurred many times at the inlet, but it also showed some randomness. Particles in size of 150 µm performed 5295 times of circular motion in vortex area 5 in 1.0 s. Grains of sands collided many times. The collision among particles consumed immense kinetic energy, making them unable to escape from the inertial force in the vortex areas. The probability of precipitation enormously increased with prolonged running time and occurrence of flocculent materials. It consequently led to emitter clogging.
Conclusion
In this study, the forces, trajectories, velocity, and distribution of sand clusters of particles in size of 65, 100, and 150 µm in the labyrinth channel were measured by CFD-DEM coupling approach. The results were confirmed by the trajectories and velocity of single grain of sand through PTV. The conclusions are as follows:
Tiny sands had small amplitude between tooth tips. They moved basically in the main stream. Their velocity was fast. The travel distance and time were short. Particles were mainly influenced by drag forces. The total force was small, thereby having better following performance. With the increase in particle sizes, the amplitude between tooth tips enlarged. The velocity decreased but the frequency of change was raised. The travel distance and time rose. Sediments easily entered vortex areas from the main stream. The inertial force gradually built up. So the total force increased. As a result, the following performance turned to be bad.
The smaller the particle sizes, the shorter time it took to reach micro-dynamic balance. Thus, the amount of sediments in the labyrinth channel was less. For particles in size of 150 µm, sands staying longer than 0.1 s in the channel accounted for 37.9% of total sediments. Particles not involved in circulation merely accounted for 0.84% of total sands. Therefore, it is necessary to have filters or even to have multi-stage filtration system to reduce the entering of larger particles which are more than 100 µm into the labyrinth channel.
Sand groups were mainly located at the inlet of the labyrinth channel. Meanwhile, they showed certain randomness. A large number of sands were trapped in vortex areas. Collisions among particles used kinetic energy, making sands unable to escape from vortex areas, which eventually led to precipitation and emitter clogging.
Footnotes
Handling Editor: Francisco Denia
Declaration of conflicting interests
The author(s) declared no potential conflicts of interest with respect to the research, authorship, and/or publication of this article.
Funding
The author(s) disclosed receipt of the following financial support for the research, authorship, and/or publication of this article: This work was supported by the National Natural Science Foundation of China (NSFC) (Nos 51379024 and 51769009).