
Abstract
An output-only method for structural diagnosis based on passing vehicle response is proposed in this article. Theoretical derivation reveals that the area of displacement response from only one sensor when vehicle loads pass over a bridge is in relation to global bending stiffness. Therefore, it can be preliminarily ascertained whether damage occurs in structure by comparison of the area of displacement responses before and after damage. Then, in order to localize damage, a damage index composed of displacement responses from several sensors is presented. The damage index has corresponding relationship with local bending stiffness and it is irrelevant to vehicle load parameters. Meanwhile, the method is suitable for both dynamic moving load and static vehicular load test. Case study of a box-girder bridge and experimental data verify the accuracy of the method, and different kinds of vehicle loads at different speeds basically have no influence on the method. In addition, the comparison between the method of curvature of displacement influence line and the presented method is also made, and the results show that the presented damage index is free from the effect of vehicle speeds while the damage index of curvature of displacement influence line is susceptible to vehicle speed.
Introduction
The concept to promptly detect, localize, and quantify deterioration in bridges has drawn increasing attention in the past several decades, and bridge diagnosis has become an important tool in maintaining the safety of bridges and providing information for retrofitting program. Many bridge diagnosis methods have been explored, and most are vibration-based diagnosis methods due to the fact that the bridges are subject to dynamic loads (moving vehicle loads, wind loads, earthquake loads, etc.). The typical vibration-based diagnosis methods are output-only methods and model-based methods.
The output-only methods usually extract the dynamic properties of bridges for damage diagnosis, and the commonly used dynamic properties mainly include natural frequency, 1 displacement mode shape, 2 frequency response function (FRF), 3 curvature mode shape,4–6 and modal strain energy.7,8 Profound reviews about output-only methods can be found in the literature.9–11 Finite element (FE) model updating is defined by minimizing the errors between results from FE model and test experimental modal data based on optimization algorithms, and therefore structural parameters can be identified for damage diagnosis. Many researchers have developed different methods according to different objective functions (frequency-based, 12 modal strain energy–based,13,14 modal flexibility–based, 15 and strain mode shape–based16,17). Detailed literature reviews about FE model updating can be found in Imregun and Visser 18 and Mottershead and Friswell. 19 Frequency-spectrum analysis of time-history measurement is commonly utilized for extraction of dynamic properties of structures, and the process of transformation of data in time-domain to frequency-domain usually causes inevitable error.
Under this background, bridge diagnosis using passing vehicle response in time-domain has gained increasing attention due to the fact that bridges are mainly subjected to moving vehicle loads. The advantages of passing vehicle response-based damage identification can be summarized as follows: (1) the signal–noise ratio can be improved compared to the above-mentioned vibration-based damage identification (VBDI) methods which usually use the ambient excitation, (2) avoiding the error of Fourier transform of time-series response, (3) the assumption of white noise excitation often used in the VBDI methods is not required, and (4) it is a rapid damage assessment method compared to static loading test. Among these relevant researches, the damage identification methods using passing vehicle response in time-domain are mainly classified into two types: model-based and model-free methods. For model-based methods, analysis of vehicle–bridge coupling vibration is usually necessary. Zhu and Law 20 presented a method for damage detection of a simply supported concrete bridge using the interaction forces from the moving vehicles as excitation. Furthermore, Chang et al. 21 investigated the feasibility of the pseudo-static damage identification method derived from a bridge–vehicle interaction system through a moving vehicle laboratory experiment. In addition, Bu et al. 22 proposed a damage assessment method for a bridge deck by the measured moving vehicle response of a structure. For model-free methods, output-only responses of structures (i.e. deflection) are usually directly utilized to establish damage indicators, and analysis of vehicle–bridge coupling vibration or FE model updating is not required. Few other authors23–26 presented a method of curvature of displacement influence line (DIL) to detect damage, and the damage index without considering velocity effect is more effective than that considering velocity effect. In addition, damage indicator based on curvature of quasi-static component of dynamic passing vehicle displacement was presented in Sun et al.27,28 Among these model-free methods, static response should be first extracted from dynamic response in order to obtain the damage index. Other damage identification methods using passing vehicle response can be found in the literature.29–31
Considering the advantages and disadvantages of the above-mentioned model-free damage identification methods using passing vehicle responses, this article aims at developing an output-only method for damage identification of structures under passing vehicle loads. It requires no complicated analysis of vehicle–bridge coupling vibration, and it only necessitates the area of displacement time history when vehicle loads pass by. Compared to model-free methods in the literature,23–28 the process of extraction of static component from dynamic displacement is not required in this article. Both damage detection and damage localization strategies have been presented. For damage detection, the area of displacement time history of only one sensor has corresponding relationship with global bending stiffness, and this feature can preliminarily judge whether damage occurs in structure. For damage locating, a damage index composed of displacement time histories from several sensors in critical zones is in direct corresponding relationship with local stiffness, and the damage index has nothing to do with vehicle parameters (weight, speed, and axle numbers). Simulation analysis of a box-girder bridge verifies the effectiveness of the presented method. In the analysis, the effect of speed, weight, axle numbers, and vehicle location on the method has been investigated. In addition, the comparison between the method of curvature of DIL and the presented method is also made, and the results show that the damage index in this article is free from the effect of the vehicle speeds while the damage index of curvature of DIL is susceptible to vehicle speed.
Theoretical background
Damage detection
For a flexural structure (Figure 1), the span of the structure is l, and the height of cross section is H. The structure is subjected to a moving vehicle which has n axles. The weight of each axle is assumed to be equal to Pk (k = 1, 2, …, n). During the process of moving through the structure at the velocity of v, the vertical displacement of section j can be achieved

in which

Structure under passing vehicle loads (with one displacement sensor).
Using integral along the span direction of the structure, 32 equation (1) can be transformed into

in which
According to the relationship x = vt, equation (2) can be further expressed as

in which
Suppose one displacement sensor is placed at section j, the method which judges whether damage occurs in the structure can be established by equation (4)

in which v1 is the vehicle speed during the first test while v2 is the vehicle speed during the second test.
When the vehicle type and speed for all the test samples are of the same, equation (4) can be simplified as

Equations (4) and (5) are applicable to dynamic moving load. For static vehicular load test (vehicle at different position along the span of structure), the damage detection index can be established as

in which
Damage locating
The coordinates of sections j − 1, j, j + 1, and j + 2 are xj−1, xj, xj+1, and xj+2, respectively (Figure 2). The vertical displacement of sections j − 1, j, j + 1 and j + 2 at time t are


Structure under passing vehicle loads (with several displacement sensors).
The rotational displacement at section j can be obtained by subtracting equation (7) from equation (8)

In a similar way, the rotational displacement at section j + 1 can be achieved

The average strain between sections j and j + 1 can be obtained with the assumption of Bernoulli–Euler beam 33

Submitting equations (9) and (10) into equation (11), the average strain between sections j and j + 1 at time t can be transformed into

Based on previous research, 34 damage localization method of bridges based on average strain response has been established, and this method will be extended to displacement response in this section.
Similar to the strategy of derivation of equations (1)–(3), the area of average strain time history between sections j and j + 1 can be obtained 34
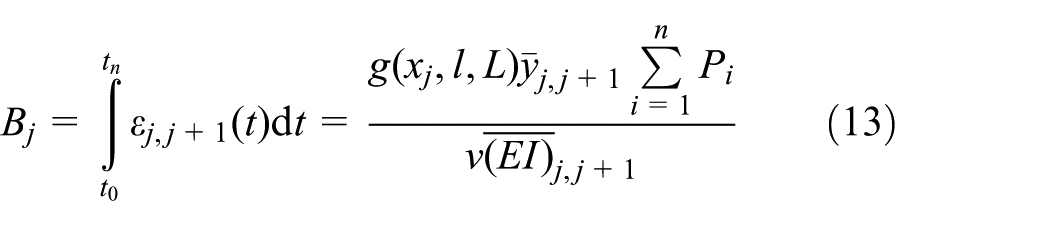
where
Submitting equation (12) into equation (13), the below can be obtained

where
The reference

The ratio of

The ratio of

The damage locating index

Equations (14)–(18) are applicable to dynamic moving load. For static vehicular load test (vehicle at different position along the span of bridge),
According to this method, several displacement sensors installed at the critical zones of bridges are needed. From the above-mentioned analysis, the flowchart of structural diagnosis can be obtained (Figure 3). When the structure is at intact state, the damage index

Flowchart of structural diagnosis.
Verification of a box-girder bridge
In order to verify the validity of the presented procedures, a simply supported concrete box-girder bridge with the span of 30 m is simulated in ANSYS. The bridge is divided into 100 elements along the length direction (namely, E1–E100 from left to right), and the length of each element is 0.3 m. The detained information about the bridge is shown in Figure 4. The values for the material properties of the bridge were assigned as follows: the elastic modulus E = 3.45 ×10¹⁰ N/m2 and the density ρ = 2.5 × 10³ kg/m3. The structure subjected to moving load is simulated by transient analysis, and the vertical displacement time history from each node of the center of the bridge was extracted. A total of six damage cases are set and include intact case and damage cases (D1, D2, D3, D4, and D5) by varying the damage severity of the bridge. D1 is damage cases with 10% flexural rigidity decrease in elements 50 and 51. D2 is damage cases with 20% flexural rigidity decrease in elements 50 and 51. D3 is damage cases with 30% flexural rigidity decrease in elements 50 and 51. D4 is damage cases with 50% flexural rigidity decrease in elements 50 and 51. D5 is damage cases with 40% flexural rigidity decrease in elements 50 and 51, 20% flexural rigidity decrease in elements 22 and 23, and 30% flexural rigidity decrease in elements 74 and 75. The elastic modulus is reduced to simulate decrease in flexural rigidity.

FE model of the box-girder bridge.
Three types of passing vehicle loads are applied in the simulation, and they are illustrated in Figure 5. The space of left axle and right axle is 1.8 m. For two-axle vehicle, axle load P1 is equal to 100 kN and axle load P2 is equal to 100 kN. For three-axle vehicle, axle loads P1, P2, and P3 are equal to 60, 120, and 120 kN, respectively. For five-axle vehicle, axle loads P1, P2, P3, P4, and P5 are equal to 60, 100, 100, 120, and 120 kN, respectively. The detained information about the passing vehicle loads is shown in Figure 5.

Different types of passing vehicle loads.
Damage detection
Three types of vehicles with the speed of 10 and 20 m/s, respectively, are applied in analysis. The displacement time history of mid-span (Figure 6) is utilized to preliminarily judge whether damage occurs in the bridge. From equation (4), the damage detection index for damage 1 is calculated (as shown in Figure 7). The values of calculated damage detection index are only relevant to the global bending stiffness EI of the bridge. At the same damage state, the results of calculated damage detection index using information of different passing vehicles (different weight or speed, etc.) will keep constant. Only damages (change in global bending stiffness) can change the values of the damage index. In practical application, the vehicle type and speed can be set as the same.

Typical displacement time history.

The influence of vehicle parameters on the damage detection index.
The damage detection indices for D1–D5 are shown in Figure 8. The threshold of the index is 1 from equation (4), while the indices for D1–D5 are larger than 1 which reveals that damage has occurred in the bridge in these cases. However, the damage location cannot be determined due to the fact that the index can only reflect the global bending stiffness. By comparison of Figure 8(a) and (b), it is obvious that both the indices are effective for damage detection, although the location of the vehicle is different. However, it is worth noting that the vehicle should be at the same location before and after damage due to the fact that DIL is relevant to load location.

Damage detection indices for all damage cases: (a) vehicle at the center and (b) vehicle at the right side.
In addition, the experimental data in Wang et al. 23 have been analyzed to further verify the presented damage detection method. The test specimen is a simply supported H-beam, and the span of the beam is 5 m. One displacement sensor was placed at the mid-span, and the displacement response from the sensor was measured when a two-axle vehicle was loaded at different position along the span of the beam. Four kinds of vehicle weight (99, 151, 203, and 254 kg) were applied in the test. A total of three kinds of damage cases (Intact state, Damage state 1, and Damage state 2) were set. Crack at position x = 1.2 m occurred at Damage state 1, while cracks at position x = 1.2 m and x = 3.25 m occurred at Damage state 2. Detailed test setup can be found in Wang et al. 23 The displacement responses at the mid-span are shown in Figure 9(a)–(c). The area enclosed by x-axis and the displacement response for all cases is calculated, and the damage detection index (as shown in Figure 9(d)) can therefore be achieved using equation (6). It is obvious that the damage detection index deviates from the threshold when crack occurs in the beam. In addition, the damage index is independent of the vehicle load type.

Displacement of mid-span for damage cases and damage detection index: (a) displacement of mid-span (Intact state), (b) displacement of mid-span (Damage state 1), (c) displacement of mid-span (Damage state 2), and (d) damage detection index.
Damage locating
The displacement time histories of nodes with the space 0.6 m are utilized to damage locating. Using equation (16), the ratio of
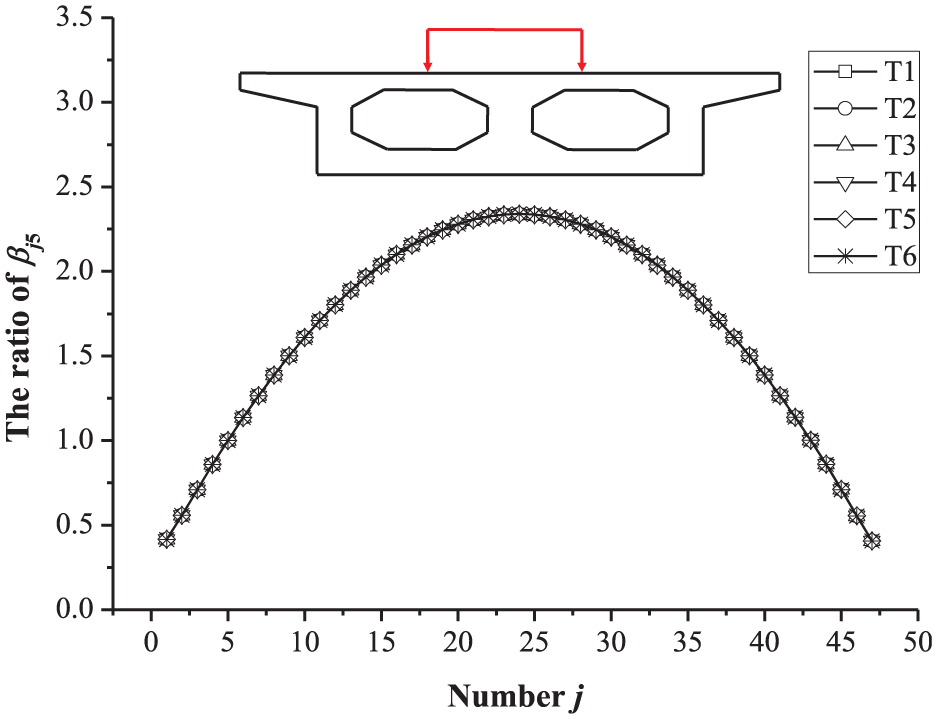
The influence of vehicle parameters on the ratio of
Based on equation (18), the damage locating indices for D1–D4 are shown in Figure 11. It is obvious that the damage index in damaged zone is greater than 0 while the damage index in undamaged zones is equal to 0. Furthermore, the damage index increases as the damage severity increases. Hence, the damage index can also be an indicator for damage severity. By comparison of Figure 11(a) and (b), it is obvious that both the indices are effective for damage locating, although the location of the vehicle is different. However, it should be stressed that the moving vehicle should be at the same location before and after damage based on the theoretical derivation process.

Damage locating indices for single damage cases: (a) vehicle at the center and (b) vehicle at the right side.
The displacement time histories of nodes with the space 1.2 m are also utilized to damage locating, and the damage locating indices for D1–D4 are shown in Figure 12. Although the number of sensors decreases, the damage locating index is still effective. By comparison of Figures 11(a) and 12, the value of damage index in Figure 11(a) is larger than that in Figure (12). It can be explained using equation (18) that the damage locating index reflects the average bending stiffness between adjacent displacement sensors, and a decrease in the number of sensors will lead to an increase in average bending stiffness between adjacent sensors. In practical application, the displacement sensors can be reasonably optimized according to this conclusion.

The influence of number of sensors on the damage locating index.
Likewise, the damage index for multiple damage case (D5) is also calculated (Figure 13). The influence of the number of sensors on the damage index is also investigated. The damage index has the corresponding relation to both the damage location and severity.

Damage locating index for multiple damage case: (a) sensors with space of 0.6 m and (b) sensors with space of 1.2 m.
Comparison of different methods
In this section, the comparison of the method of curvature of DIL23–26 and the presented method is made. The principle of the method of curvature of DIL is that damage will cause an increase in the curvature of DIL, and this feature can be utilized for damage locating. When unit load moves across the bridge at different speeds, different displacement time histories of one node are shown in Figure 14. The speed of v = 0 indicates the load is static, and load position changes along the span of the bridge. Take damage case D5 for example, the damage index using curvature difference of DIL is shown in Figure 15. Figure 15(a) means the damage index is obtained when the speed of the unit load is 0, and it gives clear indication of damage location. Figure 15(b) means the damage indices are obtained when the speeds of the unit load are 0.1, 1, and 10 m/s, respectively, and they fail to localize damage. In other words, the method of curvature of DIL is effective only when DIL is obtained by static load testing. In contrast, the damage index in this article is suitable for moving vehicle load at different speeds (Figure 16), and therefore the presented method is time-saving and cost-saving. In practical application, it can be a new alternative for fast structural diagnosis of bridges.

Different displacement time histories by varying the load speed.

Damage index using curvature difference of DIL: (a) load at the speed of 0 m/s and (b) load at the speeds of 0.1, 1, and 10 m/s.

Damage locating index in this article.
Conclusion
In this study, a model-free method for bridge diagnosis based on passing vehicle response is presented, and some conclusions are listed as follows:
The method requires no complicated analysis of vehicle–bridge coupling vibration, and it only necessitates the area of displacement time history when vehicle loads pass by.
Both damage detection index and damage locating index are presented, and the damage detection index is in direct relation to global bending stiffness, while the damage locating index is in corresponding relation to local bending stiffness.
The damage locating index is irrelevant to the vehicle parameters (axle load, speed, and axle numbers).
Compared to the method of curvature of DIL, the presented method is free from the effect of the vehicle speeds, and therefore it can be a new alternative for bridge diagnosis.
Footnotes
Handling Editor: Fakher Chaari
Declaration of conflicting interests
The author(s) declared no potential conflicts of interest with respect to the research, authorship, and/or publication of this article.
Funding
The author(s) disclosed receipt of the following financial support for the research, authorship, and/or publication of this article: This study was supported by grants from National Natural Science Foundation of China (grant no. 51508269), Natural Science Foundation of Jiangsu Province (grant no. BK20150957), and University Science Research Project of Jiangsu Province (grant no. 15KJB580007). The support from China Scholarship Council (CSC) is also appreciated.