
Abstract
In this article, we proposed an active method of obstacle attached on the blade to control cavitation in centrifugal pump. The modified shear stress transport k-ω model with a local density correction for turbulent eddy viscosity combined with Kubota cavitation model was employed to simulate three-dimensional unsteady flow. The simulated external performance agreed fairly well with experiment observation. The results show that the obstacles of appropriate height can cause little disturbance to external performance. The over-high obstacle can cause larger perturbation to deteriorate the flow field at large flow rate point. The obstacle of appropriate height can induce relative high pressure and optimize the flow structure to suppress the cavitation, which is the main mechanism of cavitation control in a centrifugal pump. The passages would be blocked if over-high obstacle is arranged, which is bad to suppress the cavitation in centrifugal pumps. The effects of 1/2 the outlet width of impeller for cavitation suppression are optimal when the bubbles reach close to the obstacle, which degrade the amplitude of dominate frequency and simultaneously attenuate the bubble volume. When cavitation completely developed, the obstacle of any height can keep the cavity volume attenuating and 1/2 of the outlet width of impeller is best.
Introduction
Cavitation in pumps appears at operating conditions where the pressure locally drops and below the vapor pressure. The cavitation phenomenon is a complex flow, which contains massive undesired impact factors such as phase change, unsteadiness, multi-dimensional turbulence, and thermal effects. The cavitation not only affects the steady flow situation but also influences the dynamic response. 1 The types of cavitation in centrifugal pump present rotating cavitation,2,3 cavitation surge, 4 choked surge, and other high-frequency flow instabilities. 5 During the process from cavitation inception to head break-off operation in a centrifugal pump, the accumulation of bubbles occurs and gradually breaks the normal energy exchange. The unsteady cavity collapses strongly affect the hydrodynamic performance and produce vibration, noise, cavitation erosion, and so many severe problems. 6 The leading edge cavitation is the main cavitation type in centrifugal pumps and is known to be responsible for severe erosion and head drop. 7 And the cavity occurs on the suction side of the blade at the low flow rate and the pressure side at the high flow rate, respectively. In the engineering applications, the net positive suction head (NPSH), cavitation number, and cavitation specific speed are usually employed to represent the operation condition and suction performance of a centrifugal pump. 8 The numerical means has been a main tool to capture the detail flow in the field of cavitation analysis.
In the previous investigations, there are four main methods to control the cavitation: one is to arrange obstacles on the cavitation surface to hold back the re-entrant jet, 9 the second is injecting the inverse air jet to reduce the magnitudes of large impulsive surface pressures,10,11 the third is employing the roughness wall to suppress the boundary layer separation and delay the cavitation inception, 12 and the last one is employing the J-grooved geometry to reduce the cavity sheet length and even suppress the cloud cavitation shedding. 13 Kawanami et al. 9 thoroughly investigated the cloud cavitation in a series of detailed experiments on E.N. hydrofoil with pressure measurements utilizing surface-mounted pressure transducers, and a clear relationship was established between the re-entrant jet and the cloud cavity generation process and then proposed that a tiny obstacle attached at the mid-span near the termination of the sheet cavity can block the re-entrant jet to prevent the cavitation inception. Pham et al. 14 conducted an experimental investigation of unsteady cloud cavitation using non-intrusive technique to study the re-entrant jet dynamics and the interfacial instabilities. Coutier-Delgosha et al. 12 investigated the impact of hydrofoil surface roughness on cavitation suppression based on numerical study; they found that the roughness enhances the turbulence kinetic energy near the wall of laminar transition, which induces a relative high pressure to delay and suppresses the cavitation inception. Mou et al. 15 analyzed the characteristics of non-smooth drag reduction influence on centrifugal pump impeller; the non-smooth surface well controls the near blade wall boundary layer flow and reduces the shear stress of the blade; and the pit-shaped non-smooth surface can reduce the fluid turbulent flow in the centrifugal pump impeller, reduce the energy dissipation caused by the turbulent, make the fluid flow more stable in the impeller, and improve the efficiency of the centrifugal pump. Coutier-Delgosha et al. 16 also studied the cavitating flow structure and analyzed a surge mode oscillation characterized by a global pulsation at low frequency by numerical and experimental methods. Pouffary et al. 17 investigated the cavitating flow in turbomachinery with the help of numerical simulation using a barotropic state law to model cavitation phenomenon. From the comparison of the numerical results with experiment, a good agreement results regarding the head drop of investigated turbomachines. Medvitz et al. 18 studied the cavity flow at small cavitation number in a centrifugal pump based on the Kunz et al. 19 cavitation model. Tan et al. 20 employed the numerical simulation to study unsteady cavitation flow in a centrifugal pump at off-design conditions based on the modified re-normalization group k-ε turbulent model, and their results indicate that cavitation has less influence on pressure fluctuations in the impeller under large discharge than under partial discharge. Friedrichs and Kosyna 2 also investigated rotating cavitation in a low specific speed impeller, and they found a mode of quasi-steady stable cavity, such as the attached cavitation that attaches at the leading edge of suction surface and the shroud of the impeller.
The objective of this article is to investigate the effect of different obstacles fitted on the pressure side of blades on the cavitation control in a low specific-speed centrifugal pump. The modified shear stress transport (SST) k-ω model 21 with local density correlation to capture the cavity shedding details and a mass transfer Kubota et al. 22 cavitation model based on the Rayleigh–Plesset equation has been adopted to predict the pump performance and internal flow patterns. This article is organized as follows. The experiments verify the accuracy of the numeric methods and physical models by the external performance tests. Compared to the case without obstacles on the blades, the cavity patterns, the streamline distribution, the cavity volume, and cavity growth rate are investigated for different height schemes. Finally, the effects of obstacles on frequency characteristics are presented. Detailed results and discussions are given in section “Results and discussion.”
Research model and mesh generation
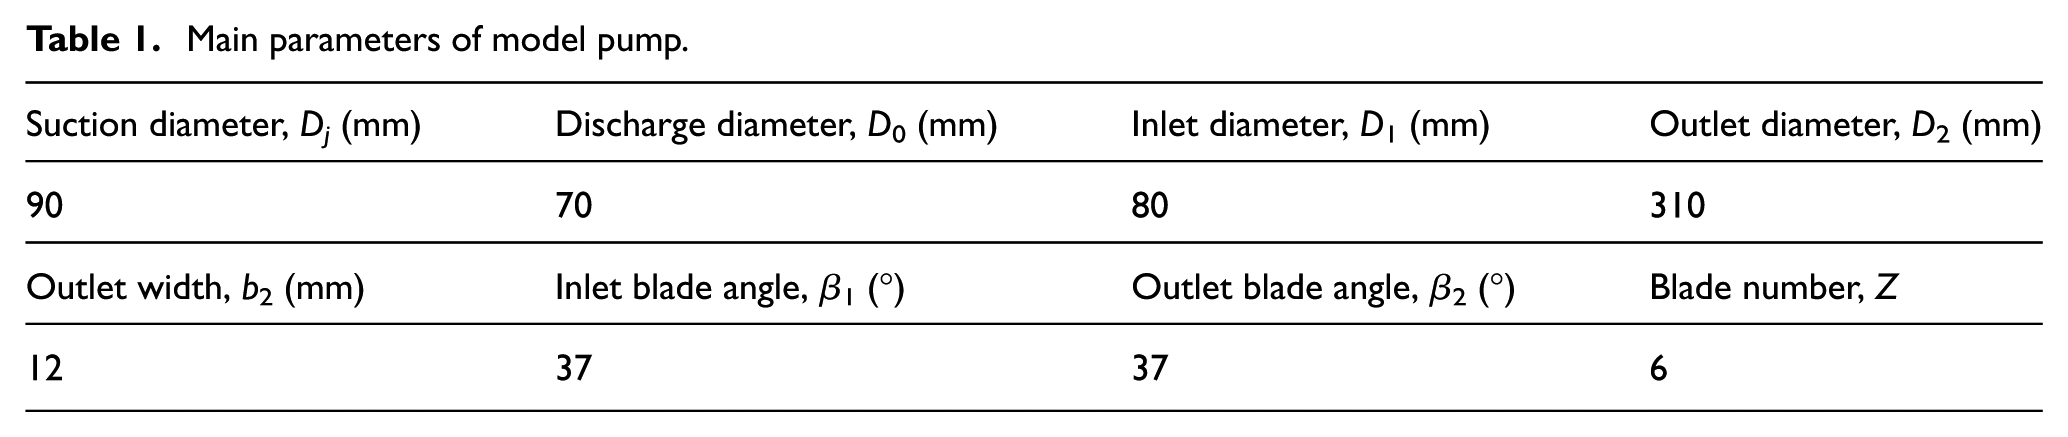
The test pump in this article is a low specific-speed centrifugal pump with suction pipe, impeller, and volute. The specific speed ns = 32 is defined at the design point (ns = 3.65nQ0.5/H0.75, H = 4.2 m, n = 500 r/min, Q = 8.6 m3/h). The main geometric parameters are shown in Table 1, whose blade profile is cylindrical shape.
Main parameters of model pump.
The flow domain of the pump consists of the dynamic and the stationary domain; therefore, the multi-block grid technique is used to generate grids in the suction chamber, impeller domain, and volute domain, respectively. Structural hexahedral meshes are used in the suction chamber, impeller domain of the centrifugal pump, and the meshes near the blade surface are locally refined to get better calculation accuracy. Through mesh independence test as shown in Table 2, taking computational accuracy and computation speed into account, the final scheme is determined in which the total number of nodes and elements is 838,520 and 1,017,321, respectively. The whole computational domain and mesh are shown in Figure 1(a). The monitoring points are shown in Figure 1(b). P1, P2, P3, and P4 are in the middle section of impeller; P1 and P2 located in the passage, which are rotating with the impeller. P3 is located on the interface and P4 located close to the volute tongue, which are stationary with the volute area.
Check of grid independency.

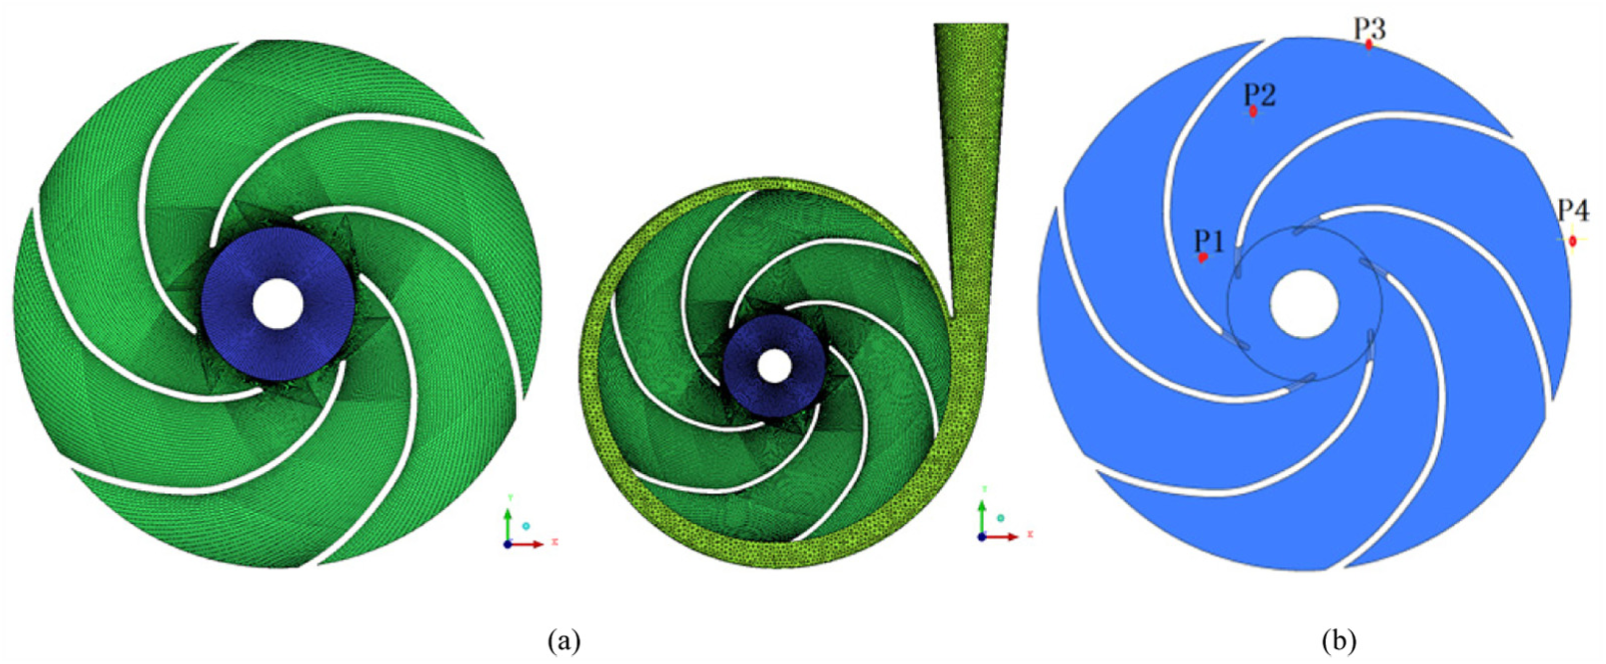
Grid of compute domain and monitoring points.
The non-dimensional normal distance Y+ is used to ensure the accurate prediction. 23 The Y+ is defined as

where τω is wall shear stress, N/m2; ρ is fluid density, kg/m3; Δn is the distance from the nearest node to the wall, m; and υ is the kinetic viscosity, m2/s. In this simulation, the “automatic near-wall function” is also used for the wall treatment. And the Y+ is ensured lower than 100 for near-wall treatment of the k-ω model, which is enough to capture more boundary layer flow details. 24 Thereby, the maximum Y+ in this calculation is 86.3, which satisfies the precision requirement for this calculation.
Compared to the previous investigations on cavitation control by obstacles on the hydrofoil9,14 and the cavitation patterns experimental observations in the centrifugal pump 25 as shown in Figure 2. Figure 2 illustrates the inception and development of the cavitation phenomenon within blades of the centrifugal pump due to gradual reduction of the suction pressure. Obviously, it can be seen that the cavity performs cloud pattern and close to pressure side of blades when the cavitation developed.
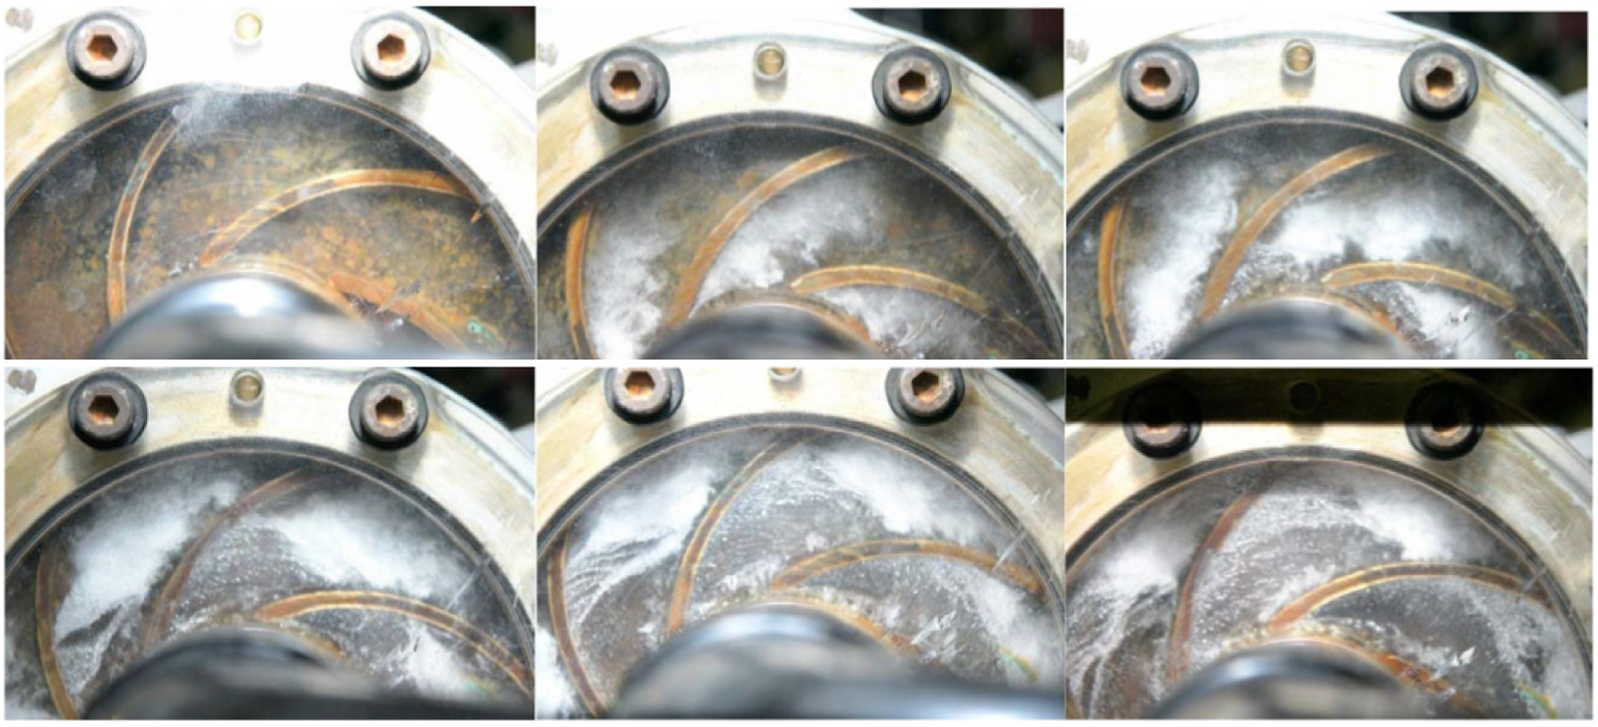
Cavitation patterns at different stage. 25
Through the cavitation observation in the impeller, the radical position of obstacles locates 45% radius of the impeller, and the section of obstacle is 2 mm × 2 mm rectangle. The arrangement sketch is shown in Figure 3.
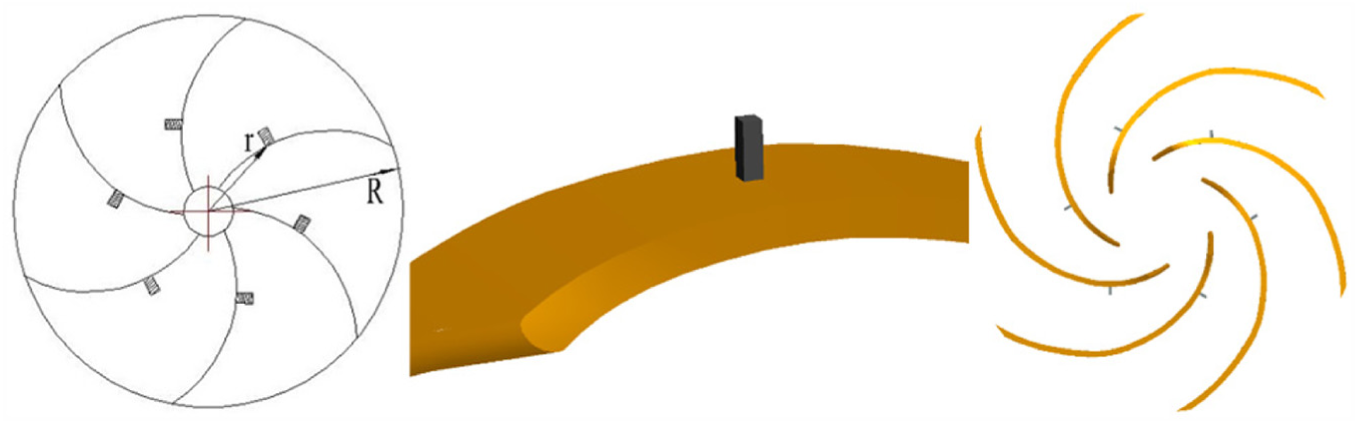
Sketch of arranged obstacles.
To illustrate the mechanism of cavitation control in the centrifugal pump, different height obstacles were compared to reveal the effects of obstacles on cavitating flow. For the convenient and wider engineering applications and taking the scale effects into account, we invent a non-dimensional height coefficient, so the obstacle height coefficient Kh is defined as

where h is the true height of obstacle and b2 is the outlet width of impeller. The varied height coefficient schemes are presented in Table 3 and mesh generation is shown in Figure 4.
Schemes of obstacle height.


Grid of obstacle: (a) H1, (b) H2, (c) H3, (d) H4, and (e) H5.
Governing equations and cavitation model
The numerical simulation employed the modified SST k-ω model to solve the unsteady Navier–Stokes equations coupled with Kubota cavitation model. The fluid is assumed homogeneous so that the multiphase fluid components are assumed to share the same velocity and pressure. 26 The continuity and the momentum equation for the mixture are given as follows:
Continuity equation

Momentum equation

where ui, uj, and uk are the velocity components; ρm is the mixture density; δij is the Kronecker delta; μ is the laminar viscosity; and μt is the turbulence viscosity, which is closed by SST k-ω model. Here, the mixture density ρm is defined as

where α is the volume fraction of one component, and the subscripts v and l refer to the component of vapor and liquid, respectively.
The SST k-ω model was developed by Menter, 27 which not only take the transport of turbulent shear stress into account but also give detailed prediction on the flow separation under different pressure gradient. This model combines the advantage of near-wall treatment of k-ω model and the ability to calculate the outer region of the k-ε model. The reason is that there is a hybrid equation which can activate the k-ω model in the near-wall region and initiate the k-ε model in the outer region, respectively. Compared to the standard k-ω model, the SST k-ω model add a cross-diffusion term D embedded in the ω equation, these improvements make the SST k-ω model own more precision and credibility to compute the real flow. Thereby, the SST k-ω model is appropriate for the prediction of high rotation speed and strong separate flow, especially in the low specific-speed centrifugal pump. The governing equations are as follows

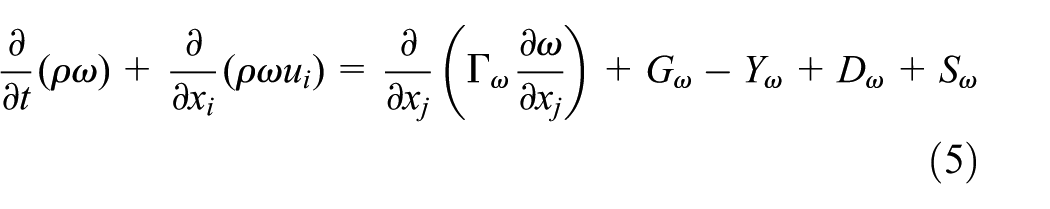

where Gk is the source term of turbulent kinetic energy k, Gω is the source term of dissipation frequency ω, and Γ k and Γ ω are the effective diffusion coefficients for turbulent kinetic energy k and dissipation frequency ω, respectively. Yk and Yω is the diffusion for turbulent kinetic energy k and dissipation frequency ω caused by turbulence, Dω is the cross-diffusion term, and Sk and Sω are the source term defined by users.
Owing to the variation of the mixture density and the high density ratio between liquid and vapor phase, the main difficulty of simulation is to handle the sharp density gradient for a cavitation process. So, the regular SST k-ω model is not able to predict the cavitation shedding dynamics accurately as it was developed for the fully incompressible single-phase flow, and the cavitating flow is actually compressible two-phase fluids in nature. To improve the simulation accuracy by considering the compressibility of cavitating, and capture the dynamic characteristics of cavity flow, some modification is needed only for the viscosity term in equation (2) and defined density function f(ρ) to replace the mixture density ρm. 28 The replace term is defined as

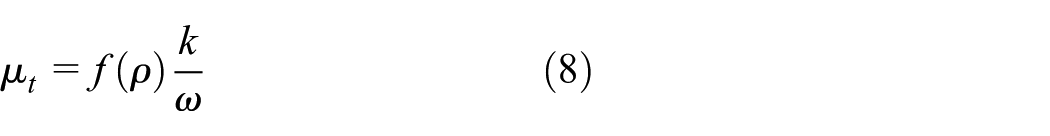
where n is usually 10. 29 This modification has been validated by many cases, such as cavitating flow around Venture-type sections 30 and hydrofoils. 31
A cavitation process is expressed by the mass transfer equation. Kubota cavitation model is developed from a simplified Rayleigh–Plesset equation, which neglects the second-order derivatives of the bubble radius. 32 A cavitation process is governed by the following mass transfer equation


where fv is the vapor mass fraction, Re is the liquid vaporization rate, Rc is the vapor condensation rate, Rb is the simplified bubble radius, αnuc is the volume fraction of nuclei, and Ce and Cc are empirical coefficients for the vaporization and the condensation processes with recommended values of 50 and 0.01.32,33αnuc has the value of 5 × 10⁻⁴ and Rb is the typical bubble size with the value of 1 × 10⁻⁶.
This calculation was finished by code CFX 15.0, the modified SST k-ω was implemented by user-defined subroutine. Under cavitation and non-cavitation calculation, the boundary conditions of steady flow simulation were almost the same. The total pressure was specified at the inlet of the suction pipe, and the volume fraction of vapor was assumed to be zero for the cavitation case at the suction inlet. The outlet boundary condition was given as mass flow rate and assumed that the flow direction is normal to the inlet section. The impeller domain was set as rotating domains with rotating speed 500 r/min and other domains were set as stationary. In the steady calculation, the interface type between rotating domain and stationary domain was set as frozen rotor. Stationary wall is set as no slip wall and automatic wall function is applied in the near-wall region. The steady results are set as the initial value for the transient simulation to accelerate the convergence; meanwhile, the interface type is changed to transient frozen rotor. The time step Δt is set to 0.001 s of every 3° for a rotating cycle, which ensures a reasonable CFL number based on physical time less than 1.0. This time step is equivalent to 120 time steps per impeller revolution. The total time of the unsteady calculation is set to two rotating periods when the results have been stable and reliable. The finite volume method based on the finite element method was adopted to discretize the governing equations. Advection term is dealt with high-resolution discretization scheme. Transient term is discretized by second-order backward Euler scheme. The lower courant number is set to 0.5 while the upper courant number is set to 1 to obtain an accurate result in every step. The iterative maximum residual for every time step was set to 1 × 10⁻⁴.
Results and discussion
Comparison of hydraulic performance
The closed pump test stand is shown in Figure 5. This experiment was conducted in Lanzhou University of Technology. In the case of non-cavitating flow, the comparison of external performance of experiment with numerical simulation is shown in Figure 6, which also presents the external performance for different height schemes.

Closed pump test stand.

Comparison of external performance.
Usually, the cavitation number in hydraulic machinery is defined as
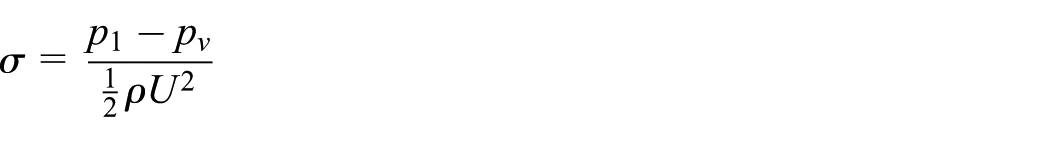
where p1 is the reference static pressure, which is the inlet pressure of pump; pv is the saturated vapor pressure; U is the reference velocity, which is the circumferential velocity of the intersection of the blade inlet and the shroud; and the circumferential velocity is represented as

where n is the rotating speed (r/min) and D1 is the diameter of the intersection of the blade inlet and the shroud.
Figure 7 shows the predicted cavitation performance curve of centrifugal pump at the designed flow rate Q, and the head remains constant until the inlet pressure drops to a certain value.

Comparison of cavitation performance.
Figure 6 shows that the predicted external performance agrees fairly well with experiment data. The head of scheme H1 and H2 keeps the same as the cases without obstacles. The head of H3 impeller decreases within 5% and 3% for the efficiency. The head of H4 and H5 performs a little unstable tendency. There is a sudden drop for the external performance curve of H4 and H5 at high flow rate, and the head decreases almost 20% and the efficiency decreases close to 10% compared to the NONE scheme (the blade scheme without obstacles), which can be explained that the over-high obstacles can easily block the internal passage and disturb the flow structure.
Figure 7 compares the effects of obstacles on the cavitation performance. Obviously, it can be seen that the obstacles cause little influence on the cavitation inception. When the inlet pressure drops to a lower value, the head presents a break-off situation. The break-off head is shown in Figure 5(b), the H3 scheme is outstanding to improve the head, which increases nearly 30% compared to NONE scheme. And other schemes do not have significant impacts on the head drop performance.
Effects of obstacles on pressure distribution
Figure 8 presents the contour of pressure in blade to blade view at 0.5 span for different height schemes at the last time steps. The cavities occur at the suction side of the blades at the design point in a centrifugal pump because of the positive blade incidence angle.

Pressure distribution in blade to blade view at 0.5 span: (a) σ = 0.82, (b) σ = 0.24, (c) σ = 0.15, and (d) σ = 0.09.
When the cavitation occurs, the dominate reason for the cavitation developing is that the low pressure region expands to the outlet of impeller. The obstacles fitted on the blade surface induce relatively high pressure and higher adverse pressure gradient in the periphery of obstacles. The variation of pressure distribution leads to the change of cavity pattern. Thereby, the change of pressure and pressure gradient induced by obstacles are the major factor to control the cavitation. It can be concluded that there are no evident effects of obstacles on the cavitation inception as shown in Figure 8(a). With the inlet decrease and cavitation developing, the improvement of pressure and pressure gradient induced by the obstacles prevent the effective expand of low pressure area, and different height schemes perform varying degrees of improvement as shown in Figure 8(b). On one hand, the obstacles can induce the high pressure to suppress the cavitation; on the other hand, the over-high obstacles would block the passages, which lead to the relative speed increasing dramatically and form an analogy Venture-type section in the flow passages. It is well known that the liquid flowed through a Venture-type section easily causes cavitation, which is substantially harmful to control cavitation. 34 Therefore, there is an optimum height to control the cavitation in the centrifugal pump. With the pressure decreasing further, it can be seen from Figure 8(c) and (d) that the control effect is distinct when height coefficient is Kh = 1/2.
The mechanism for the cavitation control for the transient flow can be explained as the high pressure induced by obstacles, and Zhang and Cheong 35 thoroughly investigated the cavitation excited pressure waves by the blunt cylindrical object and also analyzed the transient pressure distribution around the blunt object, which can also be interpreted as the control process of cavitation in a centrifugal pump. Figure 9 shows the transient pressure distribution and the vapor volume fraction. It is obvious that high pressure waves occur during the stage of cavitation collapse. Zhang et al. also concluded that the wave center is located at the point where the cavitation disappears.
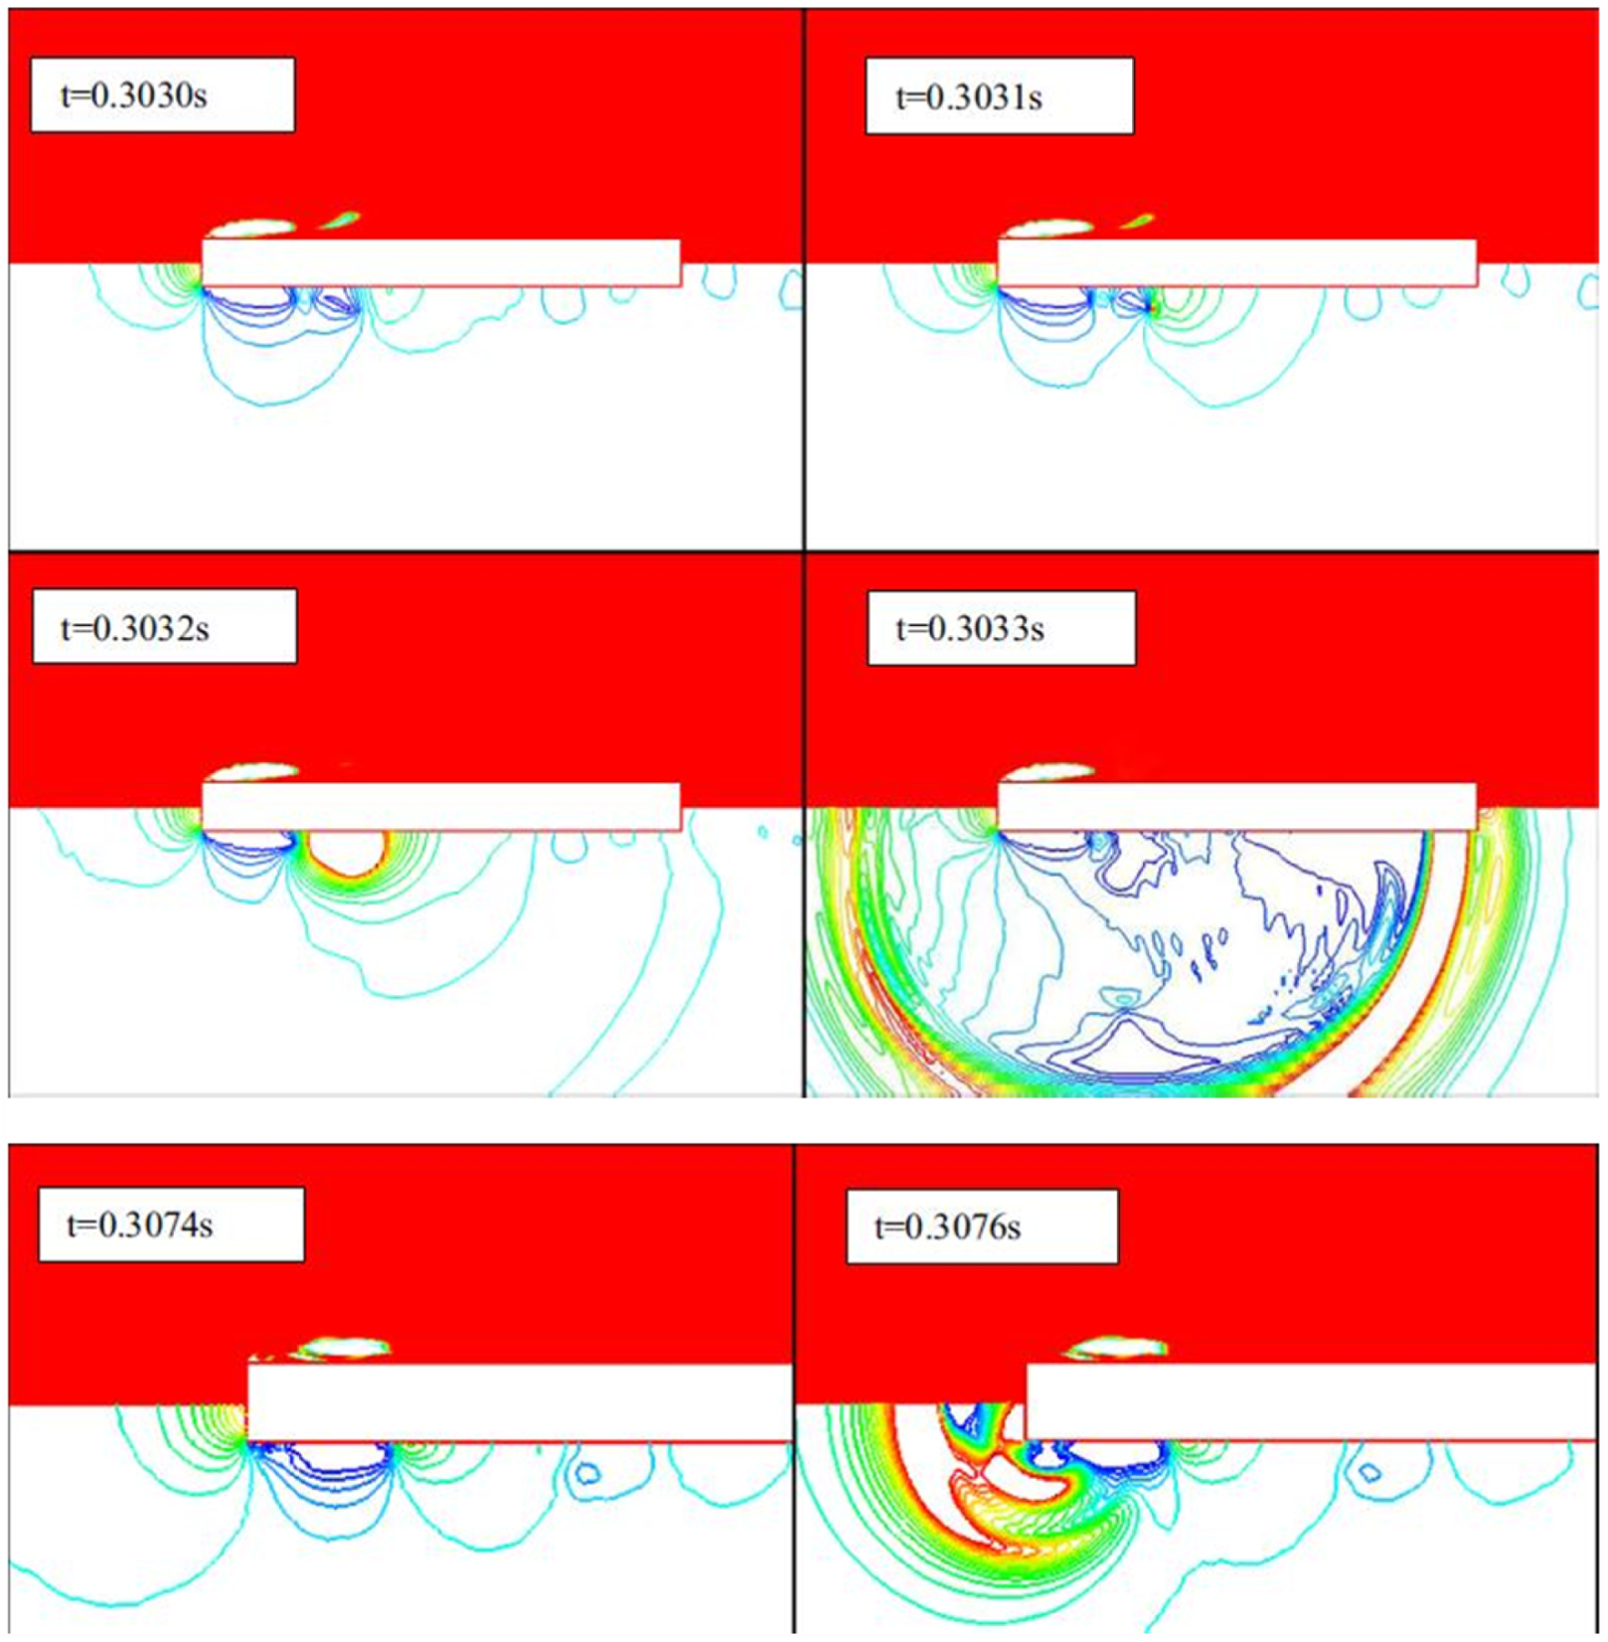
Time sequence of the fields of the volume fraction and the contours of the pressure. 35
When the liquid flow through the inter-blade passages of pumps with cavity occurring under low inlet pressure condition, radiating pressure waves are generated by the obstacles, which enforce the bubbles to collapse at the leading edge region. And the local rising pressure can continuously accelerate the collapse process until the last collapse, which can be interpreted as the preliminary mechanism of cavitation control in a centrifugal pump. In addition, the relatively adverse pressure gradient induced by obstacles can also help to limit the cavity growth in a centrifugal pump.
Effects of obstacles on flow structure
Figure 10 describes the cavitation regions and the impeller for different values of cavitation number at the last time steps. And the predicted cavity shape is illustrated by the iso-surface of vapor volume fraction of 0.1. The corresponding instantaneous streamline in the middle plane is also shown to compare the effects of different obstacles.

Cavity shape and streamline structure: (a) σ = 0.82, (b) σ = 0.24, (c) σ = 0.15, and (d) σ = 0.09.
When the cavity occurs at the leading edge of blades, the obstacles fitted on the pressure surface rise the function of regulate the flow field like a comb. As we have analyzed before, the over-high obstacles would block the passages to induce the vortex, which is bad to control cavitation phenomenon in a centrifugal pump. In the process of cavitation inception, the existence of obstacles can optimize the flow structure and weaken the vortex intensity close to the volute area as shown in Figure 10(a), but has no significant influence on cavity pattern. It can be evidently seen that the streamline distribution is distinct for Kh = 1/2 obstacle. When the cavity developed, the cavity pattern performs shedding characteristics, which are identical to sheet cavitation and cloud cavitation as shown in Figure 10(b) and (c). Sheet cavitation shedding often leads to cloud cavitation, which strongly affects hydrodynamic performance and produces vibration, noise, and cavitation erosion.1,6 When the cavity fully developed as shown in Figure 10(d), the cavity fills the spaces inside the inter-blade passage along the impeller blades. From the viewpoint of cavity pattern and streamline structure, the optimal effects of obstacle are the scheme of Kh = 1/2 in the whole process of cavitation.
As previously mentioned, the over-high obstacles would establish a Venture-type section to block the normal flow rate in the passages, which is not helpful to control the cavitation. Hu et al. 36 investigated the unsteady cavitating flows with external perturbations and pointed out that the cavity may shrink or collapse if the freestream flow speed is increased abruptly. Compared to the obstacle perturbation in the centrifugal pump, the over-high obstacles can also cause abrupt change in the velocity similar to a Venture-type section and with the inlet flow speed increasing, the emerging flow can cause the existing cavity to expand significantly. As shown in Figure 9, the streamline structure of H5 scheme induced stronger vortex intensity in the inter-blade passages, and the cavity are more easily expanding to the downstream and generating more cavity bubbles.
Effects of obstacles on cavity volume
To better illustrate the unsteady behavior of cavitation flow, the total vapor volume and the volume growth rate calculated at each time step are shown in Figure 11. And the total vapor volume in impeller Vcav is defined as


The cavity volume and growth rate: (a) σ = 0.82, (b) σ = 0.24, (c) σ = 0.15, and (d) σ = 0.09.
The vapor volume growth rate Ve is defined as

where N is the total number of control volumes in the computational domain, αv, i is vapor volume fraction in each control volume, and Vi is the volume of each cell.
Cavitation is a much complex phenomenon in centrifugal pump, the cavity volume performs varied trend during the period of cavitation developing. The accumulation of cavities in centrifugal pump has an important influence on the normal energy exchange. 37 When the cavitation number σ is 0.82 as shown in Figure 11(a), it can be evidently seen that the vapor volume with obstacles is smaller than that of NONE scheme in one rotating cycle, and the growth rate with obstacles indicates that the volume is alternately increasing and attenuating, which performs almost the same tendency as the case without obstacles. It can be concluded that any obstacles can suppress the cavitation inception for the incubation period, and the scheme of Kh = 1/3 is best. When the cavitation number σ is 0.24 as shown in Figure 11(b), the vapor volume presents increase first and then decrease for the scheme of Kh = 1/3, meanwhile other schemes show opposite tendency compared to the scheme of Kh = 1/3. When the cavitation number σ is 0.15 as shown in Figure 11(c), the scheme of Kh = 1/2 can decrease the vapor volume and make the volume decreasing accelerate. And the vapor volume all performs attenuating situation. It can be seen that there is no any evidence that higher obstacles present massive effects of suppression, which agrees well with the previous analysis. When the cavitation number σ is 0.09 as shown in Figure 11(d), the obstacle of Kh = 1/2 shows a huge impact to decrease the vapor volume, and other obstacles all cause a little increase on the vapor volume. It can be seen that any obstacles can keep the vapor volume attenuating while the case without obstacles keep that increasing from the vapor volume growth rate in Figure 11(d). And the vapor volume of Kh = 1/3 is attenuating faster than that of other obstacles. Obviously, the cavitation suppression effects are accomplished by the high pressure induced by obstacles, which is the main mechanism of cavitation control in centrifugal pump.
Effects of obstacles on transient flow
The obstacles can disturb the internal flow in the centrifugal pump, which cause the influence on transient characteristics. For this model pump, the fast Fourier transform (FFT) is employed to reveal the frequency characteristics of the internal transient flow. The rotating speed of this pump is 500 r/min; therefore, the axis frequency is 8.33 Hz and the blade passing frequency (BPF) is 50 Hz. Here are the comparisons of the amplitude of BPF (ABPF) for different obstacles as shown in Figure 12. The unit of ABPF is Pascal.

Amplitude of dominate frequency: (a) σ = 0.82, (b) σ = 0.24, (c) σ = 0.15 and (d) σ = 0.09.
Figure 12 shows the effects of obstacles on ABPF. It can be seen from Figure 12(a) and (b) that the obstacles result in a little destabilization, which lead to a small increase in ABPF. The ABPF of Kh = 1/2 is evidently lower than other obstacles which is close to that of the case without obstacles as shown in Figure 12(c). Combined with Figure 10(b) and (c), it can be concluded that the obstacle of Kh = 1/2 can suppress the cavitation and degrade the ABPF at the same time when the cavity reaches close to the obstacle. This phenomenon means that the obstacles can also suppress the transient behavior induced by cavitation including the vibration, noise, and cavitation erosion, but it is only useful at some operating condition. When the cavity fully developed and covers the whole passages as shown in Figure 10(d), the radical dimension of the cavity interface submerges the obstacles completely. The ABPF of Kh = 1/3, 1/2 is larger than that without obstacles, and ABPF of Kh = 1/6, 2/3, 1 is lower than that without obstacles. The relatively high pressure induced by the obstacles suppresses the cavies to collapse, but the impulse of pressure becomes more violent. And the volume attenuating speed of Kh = 1/3, 1/2 is outstanding as shown in Figure 11(d); therefore, it brings about a small increase in ABPF as shown in Figure 12(d).
Conclusion
This work proposed an active method to control cavitation in centrifugal pump by obstacles. Numerical simulation of the unsteady cavitating flow in a centrifugal pump was carried out by means of modified SST k-ω model coupled with a homogeneous cavitation model. Various fundamental mechanisms of the cavitation control indicating the complex flow behaviors, including the effects of obstacles on the pressure distribution, streamline structure, cavity volume growth, and cavitation excited pressure fluctuation, were examined and summarized. Note that these various results of cavitation control, these results should be further detail validated in future experiments, aims to provide comprehensive guide to control cavitation in pumps. The predicted performance curve agrees fairly well with the experiment data, which validated the accuracy of the calculating algorithm. The main conclusions are as follows:
The obstacles of Kh = 1/6, 1/3 cause little impact on the head and efficiency curve. And the obstacle of Kh = 1/2 decreases the head and efficiency within 5% and 3% at a range of flow rates. Meanwhile, the schemes Kh = 2/3, 1 bring about severe deviation from the external performance. The obstacle of Kh = 1/2 improves the drop head with almost 30% compared to that of without obstacles, which are helpful to improve cavitation performance in the hydraulic design of centrifugal pumps that usually operate at the cavitation condition.
For the process of cavitation inception and developing, different obstacles all can improve the pressure distribution and suppress the cavitation by the high pressure induced by obstacles, which is the preliminary mechanism of cavitation control in centrifugal pump. The role that obstacles play is to comb the streamlines and optimum the flow structure. The over-high obstacles would block the inter-blade passages and lead to the larger flow velocity, which count against the cavitation control.
At the instant of cavitation inception, different obstacles all can decrease the vapor volume and Kh = 1/3 is outstanding to attenuate the vapor volume. At the cavitation instant developing further, the obstacle of Kh = 1/2 can simultaneously decrease the vapor volume and make the attenuating speed faster. When the cavitation developed completely in the passages, any obstacles can fasten the volume attenuating speed and Kh = 1/2 is best. It can be concluded that the optimal height of cavitation suppression is Kh = 1/2 whose height equals to half of the outlet width of the impeller in a centrifugal pump.
At the station of cavitation inception, the obstacles can cause small increase in ABPF along the inter-blade passage and close to volute tongue area. When the bubbles develop close to the obstacle position, the obstacle of Kh = 1/2 substantially degrades the ABPF, which can effectively suppress the transient characteristics caused by the cavitating flow. When the cavity covers the obstacles, the ABPF performs unstable behaviors because of the excitation of vapor volume growth rate. These results are essential for understanding the cavitation excited pressure pulsations in a centrifugal pump, which will improve the development of more wide engineering designs to control these oscillations by the obstacles method.
Footnotes
Handling Editor: Assunta Andreozzi
Declaration of conflicting interests
The author(s) declared no potential conflicts of interest with respect to the research, authorship, and/or publication of this article.
Funding
The author(s) disclosed receipt of the following financial support for the research, authorship, and/or publication of this article: This work was supported by the National Natural Science Foundation of China, under a research program “Research on the cavitation mechanism of fluid machinery in sediment laden flow” (No. 51269011), and the Open Research Subject of Key Laboratory of Fluid and Power Machinery (Xihua University), Ministry of Education (szjj2017-093).